. 2018 Mar;14(3):318-329.
doi: 10.1016/j.jalz.2017.09.011. Epub 2017 Oct 19.

Evidence for brain glucose dysregulation in Alzheimer's disease

Affiliations

Evidence for brain glucose dysregulation in Alzheimer's disease

Yang An et al. Alzheimers Dement. 2018 Mar.

Abstract

Introduction: It is unclear whether abnormalities in brain glucose homeostasis are associated with Alzheimer's disease (AD) pathogenesis.

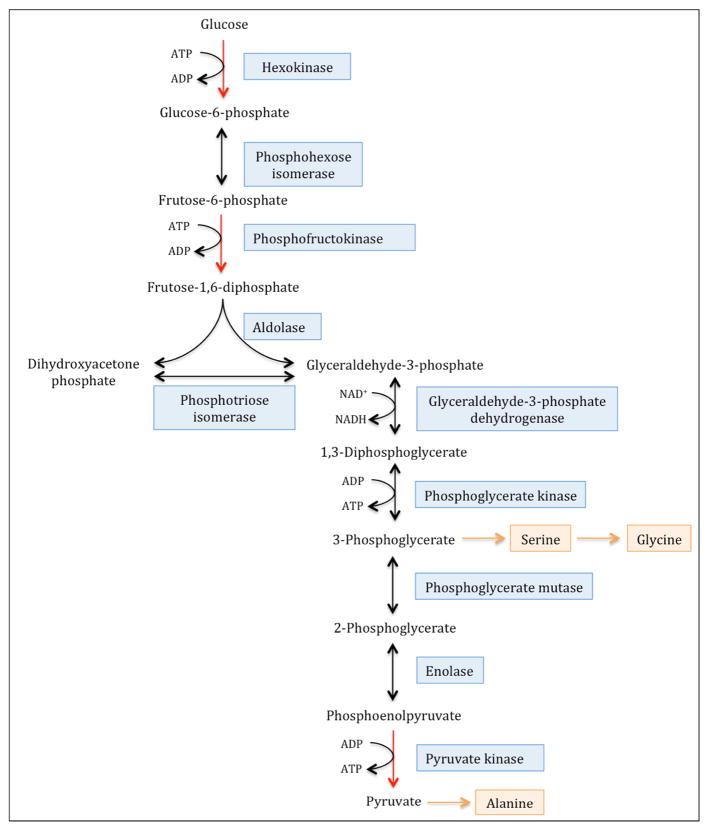
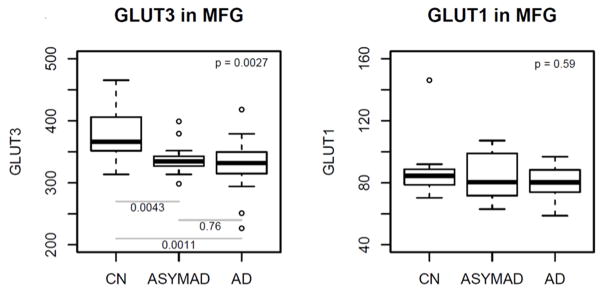
Methods: Within the autopsy cohort of the Baltimore Longitudinal Study of Aging, we measured brain glucose concentration and assessed the ratios of the glycolytic amino acids, serine, glycine, and alanine to glucose. We also quantified protein levels of the neuronal (GLUT3) and astrocytic (GLUT1) glucose transporters. Finally, we assessed the relationships between plasma glucose measured before death and brain tissue glucose.

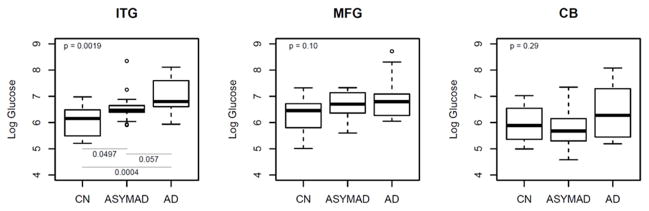
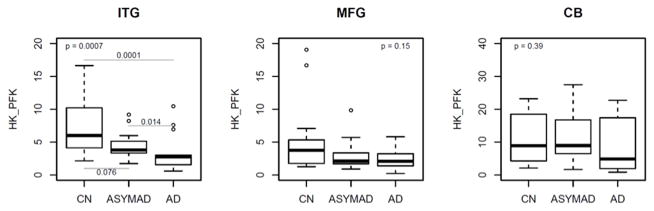
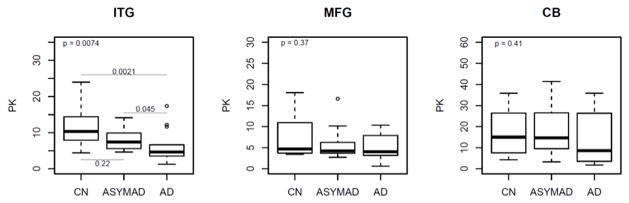
Results: Higher brain tissue glucose concentration, reduced glycolytic flux, and lower GLUT3 are related to severity of AD pathology and the expression of AD symptoms. Longitudinal increases in fasting plasma glucose levels are associated with higher brain tissue glucose concentrations.

Discussion: Impaired glucose metabolism due to reduced glycolytic flux may be intrinsic to AD pathogenesis. Abnormalities in brain glucose homeostasis may begin several years before the onset of clinical symptoms.

Keywords: Alzheimer's disease; GLUT1; GLUT3; Glucose; Glycolysis; Insulin resistance; Mass spectrometry; Neuritic plaque; Neurofibrillary tangles.


Conflict of interest statement

Conflicts of interest: None

Figures

Figure 1
Figure 1. Glycolytic intermediates are biosynthetic precursors of the non-essential amino acids, serine, glycine and alanine
The three irreversible and rate-controlling steps of glycolysis are catalyzed by the enzymes, hexokinase, phosphofructokinase and pyruvate kinase, yielding intermediate metabolites that can undergo conversion to serine, glycine and alanine. The ratio of the concentrations of serine and glycine to glucose (serine+glycine:glucose) therefore reflects the net activities of the two irreversible enzymatic reactions in glycolysis that are upstream of 3-phosphoglycerate, catalyzed by hexokinase and phosphofructokinase. Similarly, the ratio of serine+glycine+alanine to glucose provides an indirect assessment of the net activity of pyruvate kinase, which catalyzes the conversion of phosphoenolpyruvate (PEP) to pyruvate.
Figure 2
Figure 2. Box plots showing differences in brain tissue glucose concentrations (2A) and, brain tissue ratios of glycolytic amino acids: glucose (2B and 2C) between groups (unadjusted models)
ITG = inferior temporal gyrus; MFG = middle frontal gyrus; CB = cerebellum; AD = Alzheimer’s disease; CN = control; ASYMAD = asymptomatic Alzheimer’s disease; HK_PFK = hexokinase and phosphofructokinase; PK = pyruvate kinase Upper corner shows the overall p-values comparing all 3 groups. Post-hoc pair-wise comparisons are only conducted for regions with overall p-value <= 0.05 and are highlighted by lines showing the relevant pair-wise comparisons (2A–2C). ‘HK_PFK’ (2B) indicates activities of hexokinase and phosphofructokinase enzymes assessed by ratios of the glycolytic amino acids, serine and glycine to glucose (serine+glycine:glucose). ‘PK’ (2C) indicates activity of the pyruvate kinase enzyme assessed by ratios of the glycolytic amino acids, serine, glycine and alanine to glucose (serine+glycine+alanine:glucose)
Figure 3
Figure 3. Box plots showing differences in protein levels of the glucose transporters GLUT3 and GLUT1 in the middle frontal gyrus (unadjusted models)
MFG = middle frontal gyrus; GLUT3 = glucose transporter-3; GLUT1 = glucose transporter-1 Upper corner shows the overall p-values comparing all 3 groups and post-hoc pairwise p-values are shown at the bottom

References

    1. Leibson CL, Rocca WA, Hanson VA, Cha R, Kokmen E, O'Brien PC, et al. Risk of dementia among persons with diabetes mellitus: a population-based cohort study. American journal of epidemiology. 1997;145:301–8. - PubMed
    1. Luchsinger JA, Tang MX, Stern Y, Shea S, Mayeux R. Diabetes mellitus and risk of Alzheimer's disease and dementia with stroke in a multiethnic cohort. American journal of epidemiology. 2001;154:635–41. - PubMed
    1. Ott A, Stolk RP, van Harskamp F, Pols HA, Hofman A, Breteler MM. Diabetes mellitus and the risk of dementia: The Rotterdam Study. Neurology. 1999;53:1937–42. - PubMed
    1. Chen Z, Zhong C. Decoding Alzheimer's disease from perturbed cerebral glucose metabolism: implications for diagnostic and therapeutic strategies. Progress in neurobiology. 2013;108:21–43. - PubMed
    1. Hoyer S. Brain glucose and energy metabolism abnormalities in sporadic Alzheimer disease. Causes and consequences: an update. Experimental gerontology. 2000;35:1363–72. - PubMed

Publication types