. 2017 Nov 2;101(5):643-663.
doi: 10.1016/j.ajhg.2017.09.004. Epub 2017 Oct 19.

A Dementia-Associated Risk Variant near TMEM106B Alters Chromatin Architecture and Gene Expression

Affiliations

A Dementia-Associated Risk Variant near TMEM106B Alters Chromatin Architecture and Gene Expression

Michael D Gallagher et al. Am J Hum Genet. .

Abstract

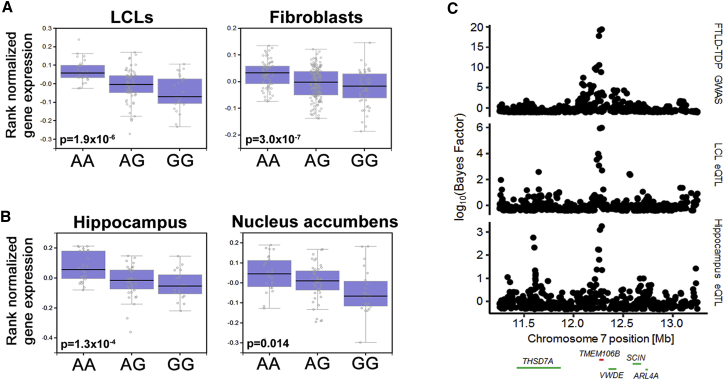
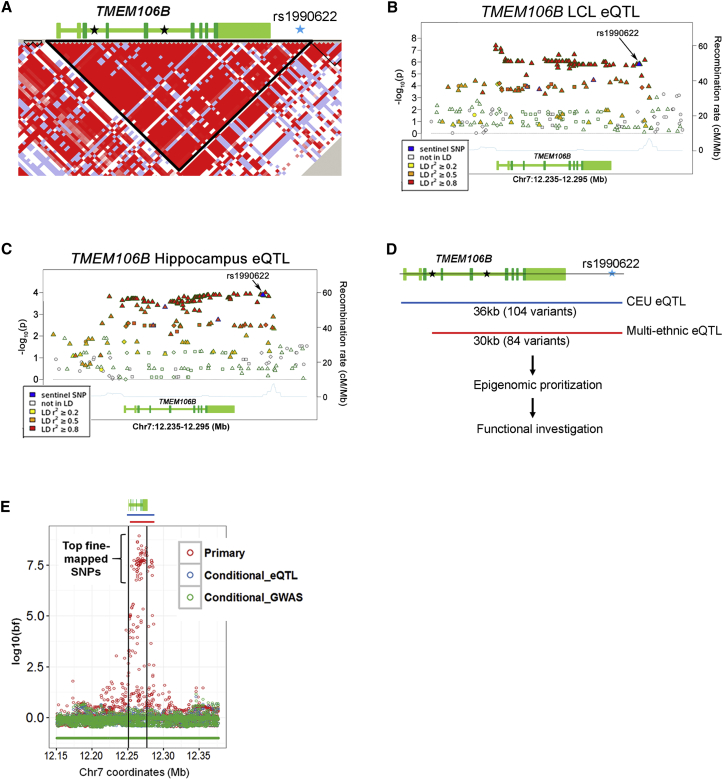
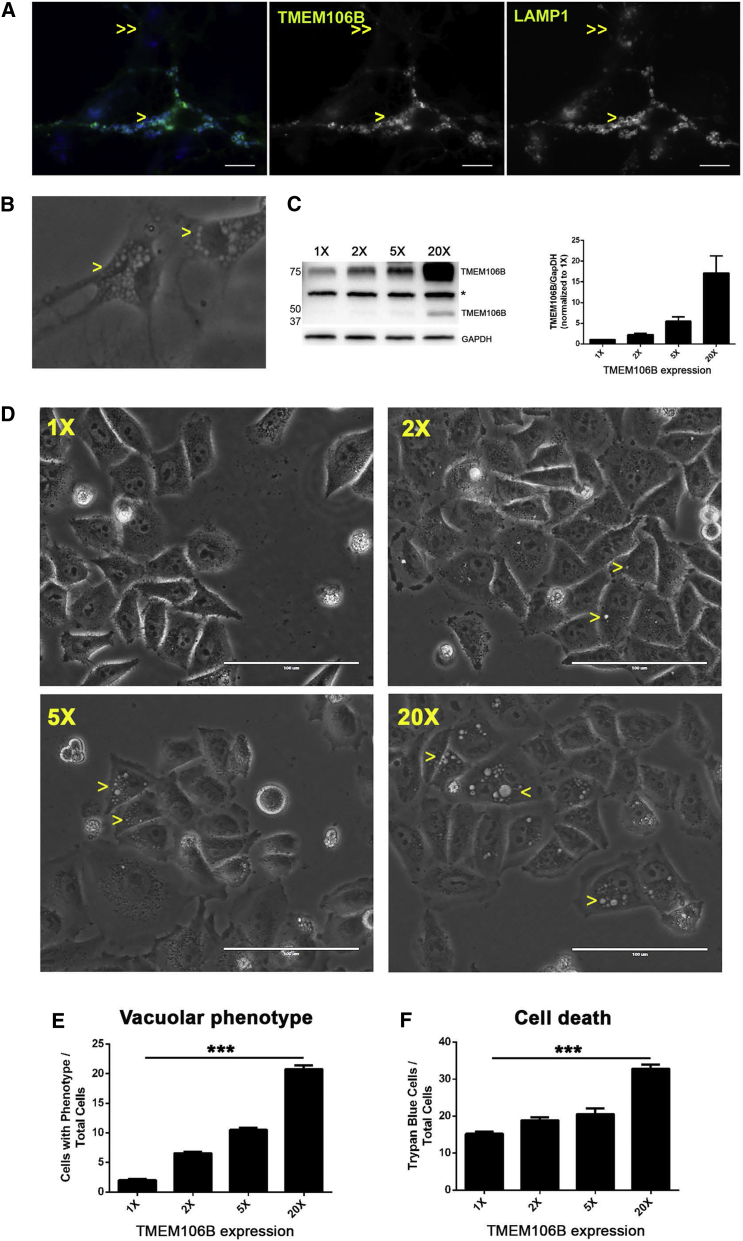
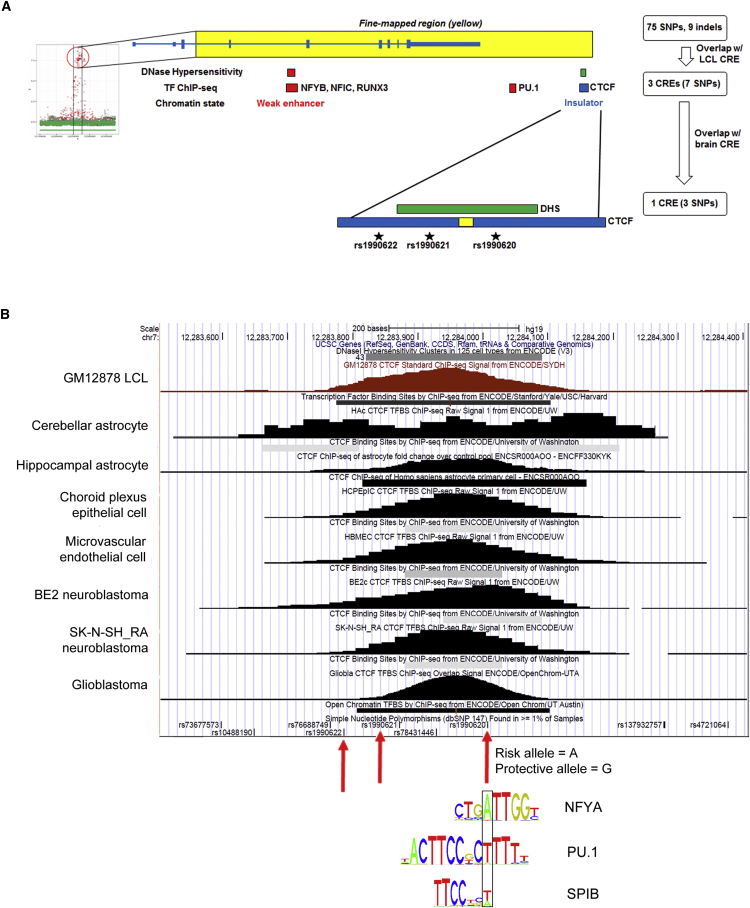
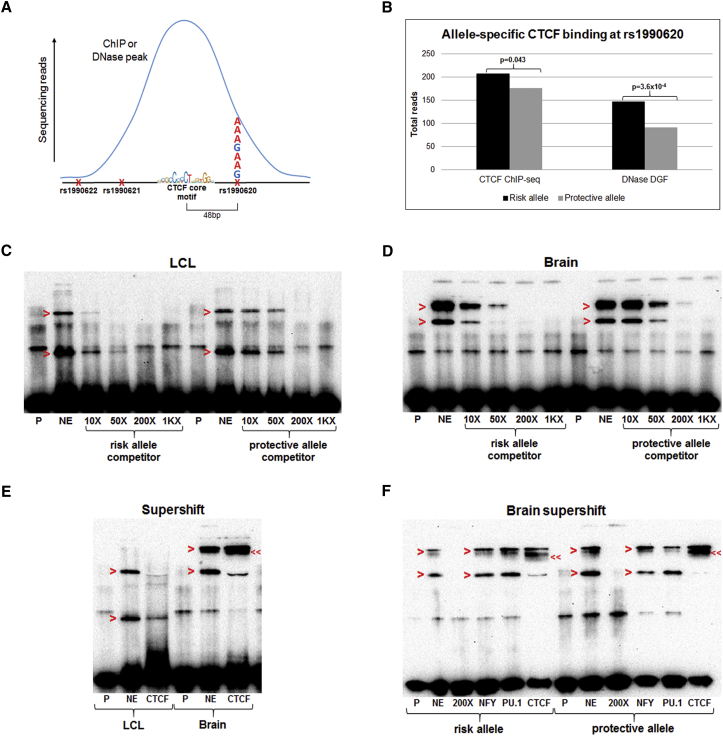
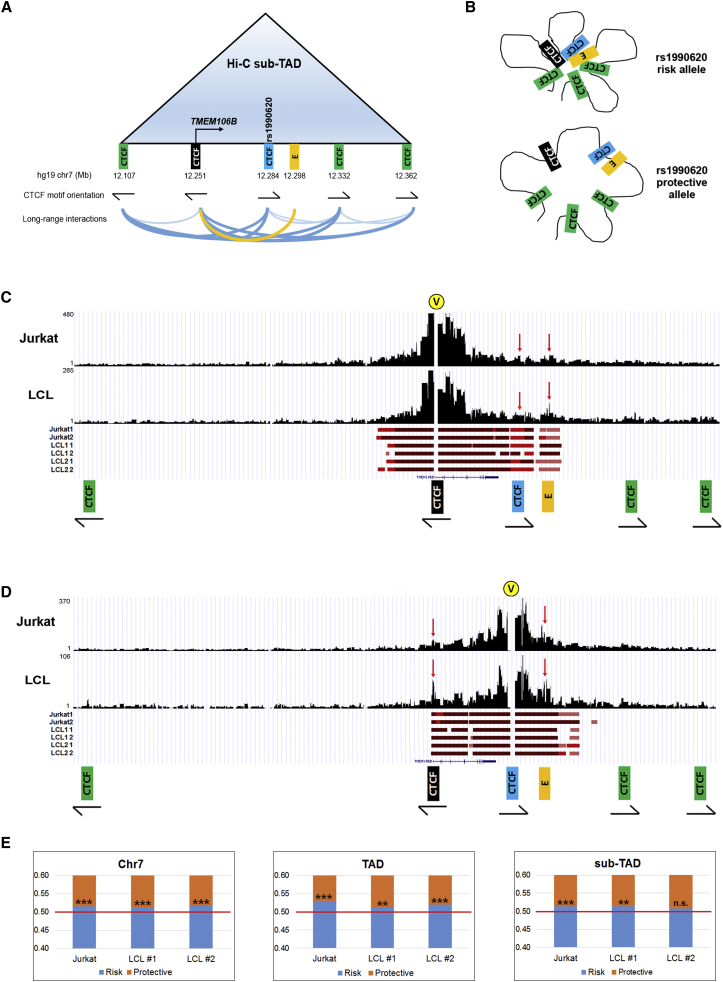
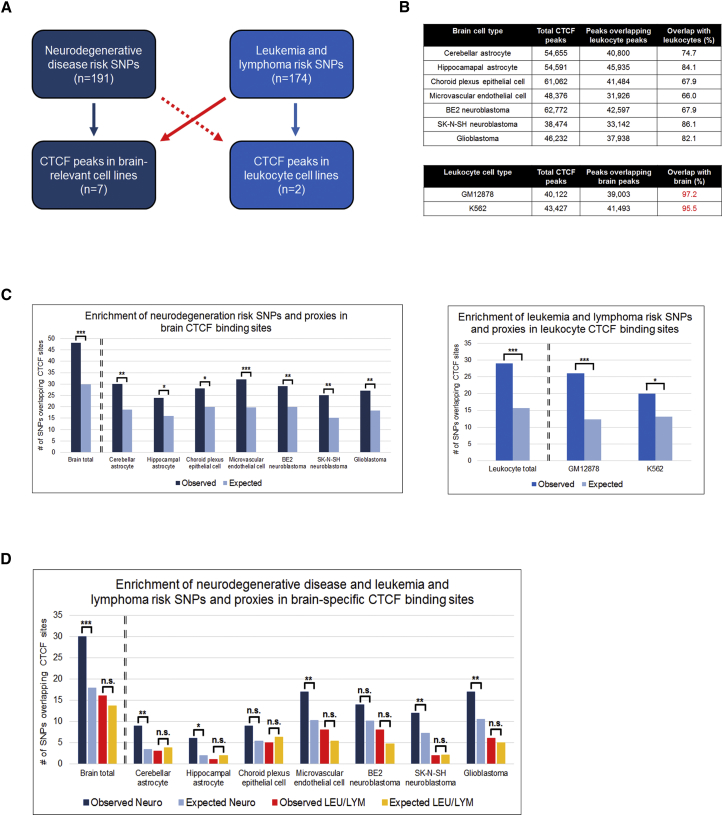
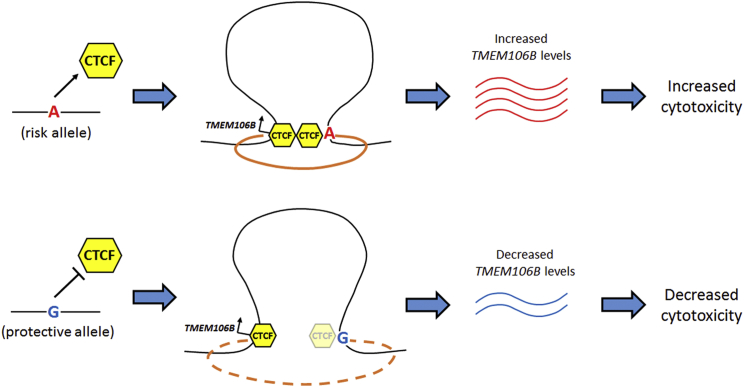
Neurodegenerative diseases pose an extraordinary threat to the world's aging population, yet no disease-modifying therapies are available. Although genome-wide association studies (GWASs) have identified hundreds of risk loci for neurodegeneration, the mechanisms by which these loci influence disease risk are largely unknown. Here, we investigated the association between common genetic variants at the 7p21 locus and risk of the neurodegenerative disease frontotemporal lobar degeneration. We showed that variants associated with disease risk correlate with increased expression of the 7p21 gene TMEM106B and no other genes; co-localization analyses implicated a common causal variant underlying both association with disease and association with TMEM106B expression in lymphoblastoid cell lines and human brain. Furthermore, increases in the amount of TMEM106B resulted in increases in abnormal lysosomal phenotypes and cell toxicity in both immortalized cell lines and neurons. We then combined fine-mapping, bioinformatics, and bench-based approaches to functionally characterize all candidate causal variants at this locus. This approach identified a noncoding variant, rs1990620, that differentially recruits CTCF in lymphoblastoid cell lines and human brain to influence CTCF-mediated long-range chromatin-looping interactions between multiple cis-regulatory elements, including the TMEM106B promoter. Our findings thus provide an in-depth analysis of the 7p21 locus linked by GWASs to frontotemporal lobar degeneration, nominating a causal variant and causal mechanism for allele-specific expression and disease association at this locus. Finally, we show that genetic variants associated with risk of neurodegenerative diseases beyond frontotemporal lobar degeneration are enriched in CTCF-binding sites found in brain-relevant tissues, implicating CTCF-mediated gene regulation in risk of neurodegeneration more generally.

Keywords: CTCF; Capture-C; GWAS; TMEM106B; causal variant; chromatin architecture; eQTL; frontotemporal dementia; frontotemporal lobar degeneration; functional variant.


Figures

Figure 1
Figure 1
Analysis of eQTL Effects at TMEM106B (A and B) Boxplots from the GTEx data demonstrate the association between TMEM106B expression and the rs1990622 genotype (A = risk allele) in peripheral cell types (A) and human brain regions (B). Data from LCLs (n = 114), fibroblasts (n = 272), hippocampus (n = 81), and nucleus accumbens (n = 93) are shown. Black lines indicate median expression levels, lower and upper bounds of boxes indicate 25th and 75th percentile expression levels, respectively, and circles outside whiskers denote outliers. Each circle represents an individual sample. (C) Association plots of the 2 Mb region centered on rs1990622 indicate the association between SNPs genotyped in the FTLD-TDP GWAS and FTLD-TDP (top), TMEM106B expression in GTEx LCLs (middle), and TMEM106B expression in GTEx hippocampal samples (bottom). Genomic coordinates are from the UCSC Genome Browser hg19 reference assembly, and RefSeq genes (TMEM106B highlighted in red) are indicated below the plots.
Figure 2
Figure 2
LD Structure and Candidate Causal Variants at the TMEM106B Locus (A) TMEM106B is located within a ∼36 kb LD block (inverted black triangle) in populations of European ancestry (CEU [Utah residents with ancestry from northern and western Europe]). The gene structure is indicated above the LD plot; coding exons are in dark green, UTRs and introns are in light green, and SNPs associated with FTLD-TDP by GWASs (including the sentinel SNP, rs1990622, in blue) are indicated with stars. (B and C) The TMEM106B eQTL effect extends across the 36 kb LD block in LCLs (B) and hippocampal samples (C) from GTEx; SNPs in strong LD with rs1990622 (indicated in blue and with an arrow) show the strongest association with TMEM106B expression. (D and E) Analysis of a multi-ethnic LCL eQTL study truncates the region of association on the 5′ end, and the remaining candidate causal variants span a ∼30 kb region (compare red lines to blue lines in D and E). Conditional analyses performed on the TMEM106B eQTL effect with the data from individuals of multiple ethnicities are shown in (E). Each circle represents a SNP; genomic positions are on the x axis, and associations with TMEM106B expression are on the y axis (log10-transformed Bayes factor). TMEM106B and regions of eQTL association are indicated above the plot and are color coded as in (D). The primary multi-ethnic eQTL analysis (red) demonstrates a strong association between a SNP cluster and TMEM106B expression. Conditioning this analysis on either the top eQTL SNP (blue) or the sentinel GWAS SNP (green) resulted in loss of an association signal at this locus (i.e., no highly associated SNPs are shown in blue or green). Genomic coordinates are from the UCSC Genome Browser hg19 reference assembly.
Figure 3
Figure 3
Dose-Dependent Effects on Cell Toxicity Are Seen with Different Amounts of TMEM106B (A) Mouse hippocampal neurons were nucleofected with TMEM106B-GFP, resulting in transient overexpression of TMEM106B in some cells (single arrowheads) and endogenous amounts of TMEM106B in neighboring cells (double arrowheads). Neurons were then visualized for TMEM106B (middle panel) or the lysosomal marker LAMP1 (right panel). Neurons with increased amounts of TMEM106B (single arrowheads) formed enlarged vacuoles in which TMEM106B (green) and LAMP1 (blue) co-localized (left panel shows merged color images of middle and right panels). In contrast, vacuoles were absent in neurons with endogenous amounts of TMEM106 (double arrowheads), which showed punctate LAMP1 staining. Scale bar, 10 μm. (B) The vacuolar phenotype (single arrowheads) was readily observed in two neighboring neurons by bright-field imaging. (C) Western blot of TMEM106B levels in the absence (1×) and presence (2×, 5×, and 20×) of various TMEM106B expression constructs transfected into HeLa cells. The bands at ∼75 and ∼40 kDa represent dimeric and monomeric forms of TMEM106B, respectively. A non-specific band is indicated by the asterisk. Quantification was performed for blots from six independent experiments (±SEM), demonstrating reliable expression levels of each construct. (D) Representative bright-field images demonstrate a dose-dependent vacuolar phenotype in cells. Yellow arrowheads indicate cells exhibiting the phenotype. (E and F) Quantification of the number of cells exhibiting (E) the vacuolar phenotype and (F) cell death is shown for each expression paradigm across three independent experiments. Asterisks denote statistical significance (p < 0.001 by ANOVA).
Figure 4
Figure 4
Prioritization of Putative CREs Harboring Candidate Functional Variants (A) The 84 variants from the eQTL fine-mapping (left) were prioritized on the basis of overlap with predicted CREs in LCLs (red boxes and text), neuronal and glial cell lines (green), or all three (blue) according to ENCODE and Roadmap EpiGenome data (see flow chart on the right). This analysis yielded seven SNPs in three potential CREs as candidate causal variants. Only one CRE—an intergenic CTCF-binding site (CTCF motif represented as a yellow rectangle)—was predicted to be active in brain-relevant cell lines; this CTCF-binding CRE contains three SNPs in complete LD, including the GWAS sentinel SNP, rs1990622. (B) A UCSC Genome Browser snapshot of the CTCF-binding region shows the ENCODE DHS track and CTCF ChIP-seq peaks and signals in LCLs and all brain-relevant cell lines. The three candidate causal variants are indicated with red arrows, and the location of rs1990620 in motifs for the TFs NFYA, PU.1, and SPIB are indicated by the black box. In each case, the protective (G) allele disrupts the motifs.
Figure 5
Figure 5
The Risk Allele of rs1990620 Preferentially Recruits CTCF in LCLs and Brain (A) Schematic of the approach to determining allelic bias in CTCF ChIP-seq and DNase DGF experiments. The rs1990620 SNP (48 bp from the CTCF core motif) was analyzed for the number of reads containing the risk or protective allele in heterozygous samples showing a CTCF ChIP-seq or DNase DGF peak at this region. (B) The risk allele of rs1990620 increased CTCF binding and DHS at this region, according to data from 20 and 6 cell types heterozygous at this locus, respectively (Tables S3 and S4). In the DGF paradigm, higher read counts correspond to higher density of DNase cleavage sites. (C and D) A 5′ biotinylated probe (P) containing the rs1990620 risk allele was incubated with nuclear extract (NE) from LCLs (C) and human brain (D). In both extracts, the shifted probe-protein complexes (red arrowheads) were more efficiently competed with an unlabeled competitor oligonucleotide (at 10×, 50×, 200×, or 1,000× [1K×] the concentration of the labeled probe) containing the risk allele instead of the protective allele, indicating preferential binding of a nuclear factor or complex to the risk allele. (E) The addition of an anti-CTCF antibody (lane labeled “CTCF”) diminished both LCL shifts and one of the two brain shifts (red arrowheads), corresponding in molecular weight to the higher LCL shift. Moreover, in brain extracts, an even-higher-molecular-weight supershift (double arrowheads) appeared after the addition of anti-CTCF antibody. (F) The addition of anti-CTCF antibody, but not anti-NFY or anti-PU.1 antibody (indicated below lane), affected the EMSA shifts (red arrowheads) produced with both the risk and protective allele probes in brain extract. As seen in (E), the addition of the CTCF antibody also produced a supershift to a higher molecular weight (double arrowheads), indicating the presence of CTCF in the shifted complex.
Figure 6
Figure 6
Haplotype-Specific Long-Range Chromatin Interactions at the TMEM106B Locus (A) Schematic representation of the TMEM106B sub-TAD and interactions among distal regulatory elements according to published LCL Hi-C data. The black CTCF site is located at the TMEM106B promoter, the blue CTCF site contains rs1990620, and the gold rectangle labeled “E” represents a transcriptionally active enhancer. Note that the CTCF motifs present at the sub-TAD boundaries (12.107 and 12.362) follow the convergent orientation (arrows indicate direction and strand) most commonly reported for interacting CTCF sites., Blue lines at the bottom indicate Hi-C interactions between CTCF sites; darker blue lines indicate interactions between CTCF sites in convergent orientation. (B) Model illustrating how allele-specific CTCF binding at rs1990620 might affect sub-TAD structure and long-range interactions at this locus. More contact among distal regulatory elements occurs on the risk-associated haplotype. (C and D) Capture-C experimental data for representative Jurkat and LCL samples; raw read coverage is shown on the y axis for interactions captured by probes for (C) the TMEM106B promoter and (D) the rs1990620-containing CTCF site. Significant interactions within the sub-TAD for each cell line and replicate (three cell lines with two technical replicates each) are indicated with red bars below the coverage plots; darker shades of red indicate higher-confidence interactions. Yellow circles marked “V” indicate viewpoints (capture sites). Red arrows indicate interactions between the promoter, the rs1990620 CTCF site, and enhancer. (E) Allelic bias in long-range interactions involving the TMEM106B promoter across all of chromosome 7 (left), the 1 Mb TAD (middle), and the 250 kb sub-TAD (right) containing TMEM106B. Read-count proportions from capture experiments containing either the risk (blue) or protective (orange) allele of a marker SNP are shown; in each case, more interactions with the TMEM106B promoter involve the risk haplotype. p < 0.05; ∗∗p < 0.01; ∗∗∗p < 0.001; n.s. = non-significant.
Figure 7
Figure 7
Risk SNPs for Neurodegenerative Disease Are Enriched in Brain-Specific CTCF-Binding Sites (A) Using the GWAS Catalog, we identified 191 risk SNPs for neurodegenerative disease and 174 risk SNPs for lymphoma and leukemia. We then determined the overlap between disease risk SNPs, as well as their LD proxies, and CTCF-binding sites either in disease-relevant cell lines (“matched” analyses, indicated by blue arrows) or in disease-irrelevant cell lines (“unmatched” analyses, indicated by red arrows). (B) To perform the “unmatched” analyses, we identified a set of CTCF-binding sites that were brain specific (i.e., found in brain-relevant cell types but absent in leukocyte-relevant cell types) and a set of CTCF-binding sites that were leukocyte specific (i.e., found in leukocyte-relevant cell types but absent in brain-relevant cell types). Whereas brain-specific CTCF-binding sites represented 14%–34% of total brain CTCF-binding sites, only 2%–4% of total leukocyte CTCF-binding sites were specific to leukocytes. (C) Neurodegenerative risk SNPs were significantly enriched in CTCF-binding sites in all seven brain-relevant cell lines (left), and lymphoma and leukemia risk SNPs were significantly enriched in CTCF-binding sites in the leukocytic GM12878 and K562 cell lines (right). (D) When we constrained our analysis to only the brain-specific CTCF-binding sites, risk SNPs for neurodegenerative disease (Neuro; blue bars) remained significantly enriched in CTCF-binding sites in five of seven brain-relevant cell lines. However, leukemia and lymphoma risk SNPs (LEU/LYM; red and orange bars) were not significantly enriched in brain-specific CTCF-binding sites. p < 0.05; ∗∗p < 0.01; ∗∗∗p < 0.001; n.s., non-significant.
Figure 8
Figure 8
Working Model of the Molecular Mechanism Underlying the 7p21 Association with Neurodegeneration The risk-associated allele of the causal variant (rs1990620) preferentially recruited CTCF, resulting in haplotype-specific effects on long-range chromatin interactions with downstream effects of increased TMEM106B expression. Increased TMEM106B expression led to increased cytotoxicity and corresponding risk of neurodegeneration.

References

    1. Chen S., Zheng J.C. Translational Neurodegeneration, a platform to share knowledge and experience in translational study of neurodegenerative diseases. Transl. Neurodegener. 2012;1:1. - PMC - PubMed
    1. Welter D., MacArthur J., Morales J., Burdett T., Hall P., Junkins H., Klemm A., Flicek P., Manolio T., Hindorff L., Parkinson H. The NHGRI GWAS Catalog, a curated resource of SNP-trait associations. Nucleic Acids Res. 2014;42:D1001–D1006. - PMC - PubMed
    1. Abraham G., Inouye M. Genomic risk prediction of complex human disease and its clinical application. Curr. Opin. Genet. Dev. 2015;33:10–16. - PubMed
    1. Nalls M.A., Pankratz N., Lill C.M., Do C.B., Hernandez D.G., Saad M., DeStefano A.L., Kara E., Bras J., Sharma M., International Parkinson’s Disease Genomics Consortium (IPDGC) Parkinson’s Study Group (PSG) Parkinson’s Research: The Organized GENetics Initiative (PROGENI) 23andMe. GenePD. NeuroGenetics Research Consortium (NGRC) Hussman Institute of Human Genomics (HIHG) Ashkenazi Jewish Dataset Investigator. Cohorts for Health and Aging Research in Genetic Epidemiology (CHARGE) North American Brain Expression Consortium (NABEC) United Kingdom Brain Expression Consortium (UKBEC) Greek Parkinson’s Disease Consortium. Alzheimer Genetic Analysis Group Large-scale meta-analysis of genome-wide association data identifies six new risk loci for Parkinson’s disease. Nat. Genet. 2014;46:989–993. - PMC - PubMed
    1. Ramanan V.K., Saykin A.J. Pathways to neurodegeneration: mechanistic insights from GWAS in Alzheimer’s disease, Parkinson’s disease, and related disorders. Am. J. Neurodegener. Dis. 2013;2:145–175. - PMC - PubMed

MeSH terms