. 2017 Nov 14;9(5):1642-1659.
doi: 10.1016/j.stemcr.2017.09.019. Epub 2017 Oct 19.

Functional Antagonism between OTX2 and NANOG Specifies a Spectrum of Heterogeneous Identities in Embryonic Stem Cells

Affiliations

Functional Antagonism between OTX2 and NANOG Specifies a Spectrum of Heterogeneous Identities in Embryonic Stem Cells

Dario Acampora et al. Stem Cell Reports. .

Abstract

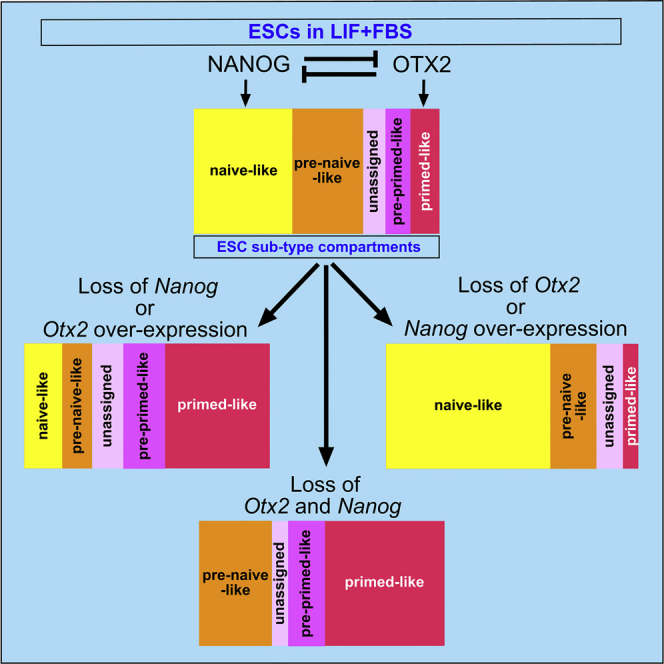
Embryonic stem cells (ESCs) cultured in leukemia inhibitory factor (LIF) plus fetal bovine serum (FBS) exhibit heterogeneity in the expression of naive and primed transcription factors. This heterogeneity reflects the dynamic condition of ESCs and their versatility to promptly respond to signaling effectors promoting naive or primed pluripotency. Here, we report that ESCs lacking Nanog or overexpressing Otx2 exhibit an early primed identity in LIF + FBS and fail to convert into 2i-induced naive state. Conversely, Otx2-null ESCs possess naive identity features in LIF + FBS similar to Nanog-overexpressing ESCs and convert poorly into FGF-induced early primed state. When both Nanog and Otx2 are inactivated, ESCs cultured in LIF + FBS exhibit primed identity and weakened ability to convert into naive state. These data suggest that, through mutual antagonism, NANOG and OTX2 specify the heterogeneous identity of ESCs cultured in LIF + FBS and individually predispose them for optimal response to naive or primed inducing factors.

Keywords: LIF signaling; NANOG; OTX2; embryonic stem cell heterogeneity; pluripotency.


Figures

None
Graphical abstract
Figure 1
Figure 1
NanogKOS ESCs Exhibit Partial Recovery of Naive-like and Pre-naive-like ESC Sub-types (A) Flow cytometry plot of NanogKO ESCs showing CH+ cells versus side scatter (SSC). (B) Number of WT and NanogKOS colonies uniformly ALP+. Data are the means ± SD from four independent experiments. (C) Representative images of WT and P4 NanogKOS ESCs immunostained with OCT4 and KLF4 and with CDX2, GATA4, and OCT4. Scale bar, 100 μm. (D) RT-PCR assays with Oct4 and PE (Gata6, Gata4, Sox17, Foxa2, and Igf2) markers on WT and NanogKOS RNAs normalized by β-Actin (n = 3 independent experiments). (E) Representative images of WT and NanogKOS ESCs immunostained with OCT4 and OCT6, with NANOG or CH, OTX2, and OCT4 and with NANOG or CH, OTX2, and OCT6; ESCs are also stained with DAPI. Scale bar, 100 μm. (F–I) Cell-counting analysis showing in WT and NanogKOS ESCs the percentage of total cells expressing OCT4 (F), the percentage of OCT4+ cells expressing NANOG or CH, KLF4, OCT6, and OTX2 (G), the percentage of total cell sub-types showing naive-like, pre-naive-like, unassigned, pre-primed-like, and primed-like identity (H), and the percentage of total cells expressing the sum of all cell sub-types (I). Data are reported as means ± SD from four independent experiments. ∗∗∗p ≪ 0.001; ∗∗p < 0.001; p value is between 0.005 and 0.001. (J) RT-PCR assays showing the expression of Nanog, Ch, Otx2, Fgf5, Oct6, Fgf4 Rex1, and Esrrb in WT, NanogKO, and NanogKOS RNAs normalized by Oct4 (n = 3 independent experiments). (K) Schematic representation of ESC sub-type compartments showing that NanogKOS ESCs exhibit a reduction of the naive-like compartment and moderate expansion of the unassigned, pre-primed-like, and primed-like compartments. A color code of the different compartments is also shown. See also Figures S1–S4 and Table S1.
Figure 2
Figure 2
NANOG and OTX2 Antagonism Controls the Identity and Size of ESC Sub-type Compartments and Influences Self-Renewal (A and B) Number of DKO colonies with efficient self-renewal (A) and number of ESC colonies uniformly stained with ALP in WT and mutant ESCs (B). Data are reported as means ± SD of four independent experiments. ∗∗∗p ≪ 0.001. (C) Representative images showing that DHet and DKO trypsinized ESCs exhibit mirror distribution of GFP+ and CH+ cells. Scale bar, 100 μm. (D) Representative immunohistochemistry assays performed in WT, DHet, DKO, and Otx2KO ESCs with OTX2 or GFP and OCT4, with NANOG or CH, OTX2 or GFP and OCT6, and with NANOG or CH, KLF4 and OCT6; ESCs are also stained with DAPI. Scale bar, 100 μm. (E and F) Western blots (E) and RT-PCR assays (F) performed on WT, DHet, Otx2KO, and DKO ESCs to assess the expression level of p-STAT3, STAT3, p-ERK1,2, ERK1,2, activated-βCAT and p-βCAT (E) as well as Ch, Gfp, Esrrb, Klf4, Rex1, and T (F). β-Actin is used as quantitative internal standard (n = 3 independent experiments). See also Figures S1 and S4.
Figure 3
Figure 3
Cell-Counting Analysis of Mutant ESC Sub-type Compartments (A–C) Cell-counting data showing for WT, DHet, DKO, and Otx2KO ESCs the percentage of total cells expressing OCT4 (A), the percentage of OCT4+ cells expressing NANOG or CH, KLF4, OCT6 and OTX2 or GFP (B), and the percentage of total cells (OCT4+), corresponding to the naive-like, pre-naive-like, unassigned, pre-primed-like, primed-like compartments (C); note that DKO ESCs show a new small sub-type (CH+-GFP+-OCT6+) (C). Data are reported as the means ± SD from four independent experiments. ∗∗∗p ≪ 0.001; ∗∗p < 0.001; p value is between 0.005 and 0.001. (D) Schematic representation of ESC compartments showing that Otx2KO ESCs exhibit a relevant expansion of the naive-like compartment counterbalanced by a significant contraction of the pre-naive-like and loss of the pre-primed-like compartments; and DKO ESCs show loss of the naive-like compartment and expansion of primed-like and pre-primed-like compartments. See also Figure S3 and Table S2.
Figure 4
Figure 4
Analysis of DKO and Otx2KO Transcriptomes (A–H) Venn diagrams showing the different categories of gene transcripts (boxes from (a) to (o) in each Venn diagram) up- or downregulated in DKO (A–D) and Otx2KO (E–H) ESCs in LIF + FBS when compared with WT ESCs (LIF + FBS) or WT ESCs (LIF + 2i) or WT EpiLCs (44 hr); this analysis allows us to identify DKO (LIF + FBS) gene transcripts shared with those up- or downregulated specifically in WT EpiLCs (44 hr) or WT ESCs (LIF + FBS) (red circle in box [j] in A–D); the same analysis was performed to identify Otx2KO ESCs (LIF + FBS) transcripts shared with those specifically expressed in WT ESCs (LIF + FBS) and WT ESCs (LIF + 2i) (red circle in box [j] in E–H). (I–L) RT-PCR assays of selected genes up- or downregulated specifically in DKO (LIF + FBS) and WT EpiLCs (44 hr) (I), or in DKO (LIF + FBS) and WT ESCs (LIF + FBS) (J), or in Otx2KO (LIF + FBS) and WT ESCs (LIF + FBS) (K), or in Otx2KO (LIF + FBS) and WT ESCs (LIF + 2i) (L). The selected genes belong to the box (j) highlighted with red circles in the Venn diagrams (n = 3 independent experiments). See also Figure S5 and Table S3. Up- and Downregulated Gene Transcripts Detected in All Comparisons, Related to Figures 4 and S5, Table S4. List of Up- and Downregulated Transcripts as They Appear within Each Box of the Venn Diagrams Shown in Figures 4 and S5M-P, Related to Figures 4 and S5M–S5P, Table S5. List of Up and Downregulated Gene Transcripts Reported in Box (j) of Each Venn Diagram Shown in Figures 4 and S5M-P, Related to Figures 4 and S5M–S5P.
Figure 5
Figure 5
Abnormalities of Mutant ESCs in Chimeric Blastocysts (A) Graphic representation showing that, compared with DHet and Otx2KO, DKO ESCs exhibit reduced efficiency of integration into host embryos. Data are the means ± SD from n = 10 blastocysts for each ESC line; ∗∗∗p ≪ 0.005. (B–D) Cell counting showing the percentage of ER+ donor cells expressing NANOG, OTX2, CH, GFP, KLF4, OCT6, GATA4, and CDX2 (B) or the percentage of total cells (DAPI+) expressing NANOG, OTX2, or KLF4 in the donor (ER+) (C) or in the host cells (ER) (D). Data are the means ± SD from n = 7 blastocysts for each combination of antibodies reported in (E) and for each ESC line. p < 0.05; ∗∗p < 0.01; ∗∗∗p < 0.005. (E) Representative confocal images of embryos injected at E2.5 with DHet, DKO, and Otx2KO ESCs and immunostained at E4.75 with ER plus NANOG and OTX2, or CH and GFP, or KLF4 and OCT6, or GATA4, or CDX2. Note that the externalmost plane of acquisition is removed to allow a better view of the inner cell mass. DAPI staining is also shown. Scale bar, 30 μm. See also Figure S6 and Table S6.
Figure 6
Figure 6
Otx2 Overexpression Is Sufficient to Prime ESCs in LIF-Containing Medium and without FGF2 Contribution (A) Representative images of pPyCAGOtx2-ER ESCs administered or not with Tx and WT ESCs primed with FGF2 immunostained with NANOG, OTX2, and OCT6 and with NANOG, OCT4, and KLF4. Scale bar, 100 μm. (B) Representative RT-PCR assays show that in WT and pPyCAGOtx2-ER ESCs, FGF2 treatment and Tx-induced nuclear translocation of OTX2-ER downregulate Nanog, Klf4, Esrrb, and Rex1 and upregulate endogenous Otx2, Fgf5, T, and Foxa2 (n = 3 independent experiments). (C–E) Cell counting showing for WT ESCs (LIF + FBS), Tx-treated pPyCAGOtx2-ER in LIF + FBS, and WT ESCs in KSR plus FGF2 the percentage of total cells expressing OCT4 (C), the percentage of OCT4+ cells expressing NANOG or KLF4 or OCT6 or OTX2 (D), and the percentage of total cells (OCT4+) expressing the different sub-types identified by the combinatorial analysis of NANOG, OCT6, and OTX2 (E). Data are presented as means ± SD from four independent experiments. ∗∗∗p ≪ 0.001; ∗∗p < 0.001; p value is between 0.005 and 0.001. (F) Cell-counting data show that nuclear translocation of OTX2-ER is sufficient to induce a re-organization of sub-type compartments similar to that induced by FGF2 in WT ESCs. See also Figures S4 and S7 and Table S2.
Figure 7
Figure 7
Conversion of Mutant ESC Lines into Naive-like and Primed-like Pluripotent States (A) Representative immunohistochemistry assays with OTX2 or GFP and NANOG or CH, OCT4 and KLF4, and with GATA4 and CDX2 performed at passage (P) 1, P2, and P5 in WT, Otx2KO, and DKO ESCs cultured in LIF + 2i show that DKO ESC colonies acquire a domed morphology, ubiquitous expression of OCT4, KLF4, and CH and stop generating OCT4 cells. Scale bars, 100 μm. (B) RT-PCR assays show that in DKO ESCs, the expression of naive, PE, and TE markers progressively recovers a profile similar to that of WT ESCs (n = 3 independent experiments). (C) Western blots show that at P5 also the level of p-STAT3, p-ERK1,2, act-βCAT, and p-βCAT is similar in WT and DKO ESCs (n = 3 independent experiments). (D) Representative immunohistochemistry assays with OTX2 and NANOG, OCT4 and KLF4, and SOX1 and TUJ1 on pPyCAGOtx2-ER ESCs cultured in LIF + 2i up to P3 without Tx or cultured up to P2 without Tx and for an additional passage (P3) with Tx. (E) RT-PCR assays of Tx-treated pPyCAGOtx2-ER ESCs show reduced expression of Esrrb, Fgf4, and Rex1 and Sox1 upregulation; expression of PE, TE, and primed markers appear unaffected (n = 3 independent experiments). (F) Representative immunohistochemistry assays with OTX2 and NANOG or CH, OCT4, and KLF4 and with GATA4 and CDX2 show that NanogKOS ESCs cultured in LIF + 2i exhibit small and rare OCT4+ colonies, abundant differentiation of PE-like cells expressing KLF4 and GATA4, and do not recover a naive-like phenotype at P5. (G) RT-PCR assays performed on WT and NanogKOS ESCs cultured in LIF + 2i show that naive markers are downregulated, PE markers are stably upregulated, TE markers are transiently upregulated, and primed markers are unaffected (n = 3 independent experiments). See also Figure S4.

References

    1. Acampora D., Di Giovannantonio L.G., Simeone A. Otx2 is an intrinsic determinant of the embryonic stem cell state and is required for transition to a stable epiblast stem cell condition. Development. 2013;140:43–55. - PubMed
    1. Acampora D., Omodei D., Petrosino G., Garofalo A., Savarese M., Nigro V., Di Giovannantonio L.G., Simeone A. Loss of the Otx2-binding site in the Nanog promoter affects the integrity of embryonic stem cell subtypes and specification of inner cell mass-derived epiblast. Cell Rep. 2016;15:2651–2664. - PubMed
    1. Brons I.G., Smithers L.E., Trotter M.W., Rugg-Gunn P., Sun B., Chuva de Sousa Lopes S.M., Howlett S.K., Clarkson A., Ahrlund-Richter L., Pedersen R.A. Derivation of pluripotent epiblast stem cells from mammalian embryos. Nature. 2007;448:191–195. - PubMed
    1. Buecker C., Srinivasan R., Wu Z., Calo E., Acampora D., Faial T., Simeone A., Tan M., Swigut T., Wysocka J. Reorganization of enhancer patterns in transition from naive to primed pluripotency. Cell Stem Cell. 2014;14:838–853. - PMC - PubMed
    1. Cahan P., Daley G.Q. Origins and implications of pluripotent stem cell variability and heterogeneity. Nat. Rev. Mol. Cell Biol. 2013;14:357–368. - PMC - PubMed

Publication types

MeSH terms