. 2017 Nov 16;171(5):1151-1164.e16.
doi: 10.1016/j.cell.2017.09.047. Epub 2017 Oct 19.

Early-Life Gene Expression in Neurons Modulates Lasting Epigenetic States

Affiliations

Early-Life Gene Expression in Neurons Modulates Lasting Epigenetic States

Hume Stroud et al. Cell. .

Abstract

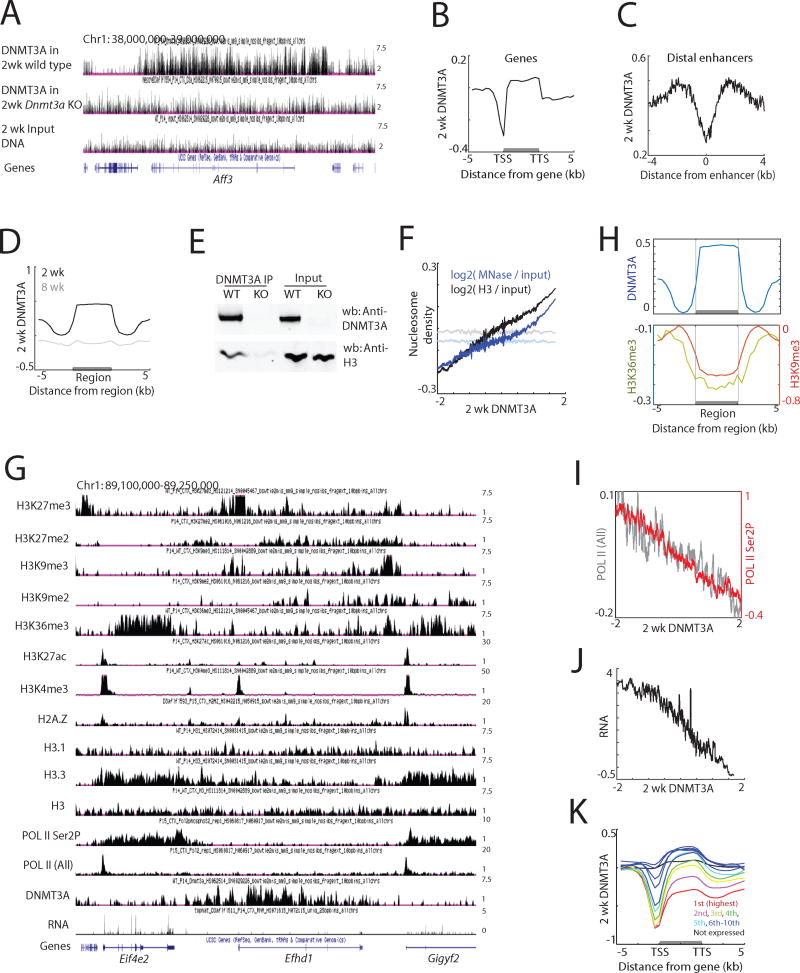
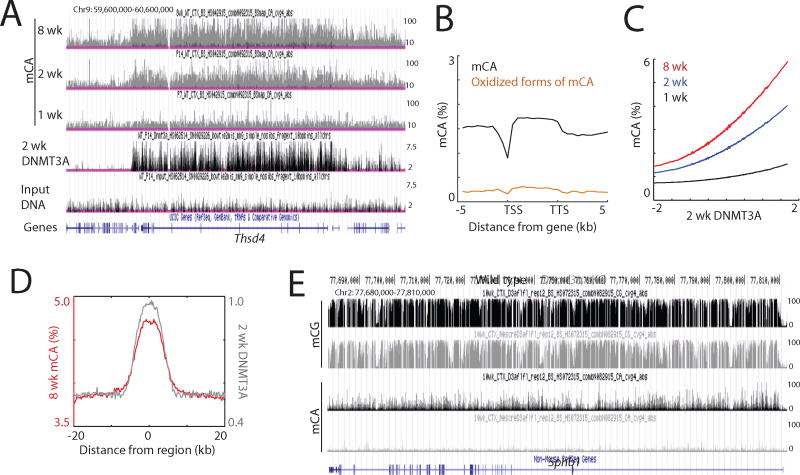
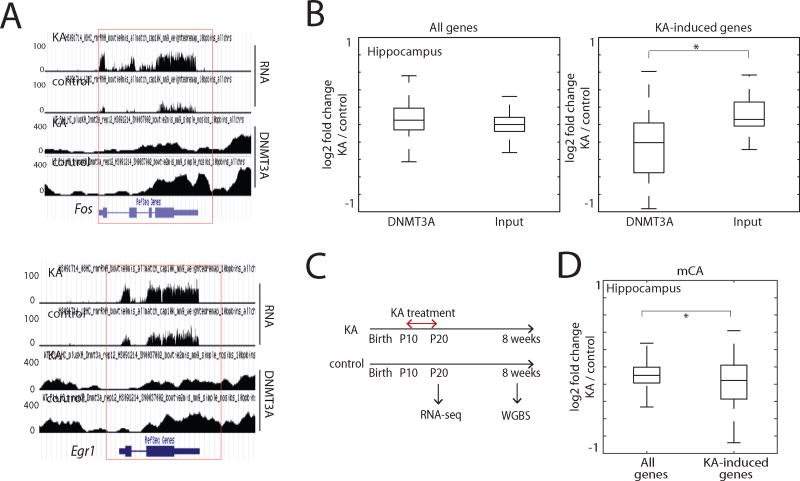
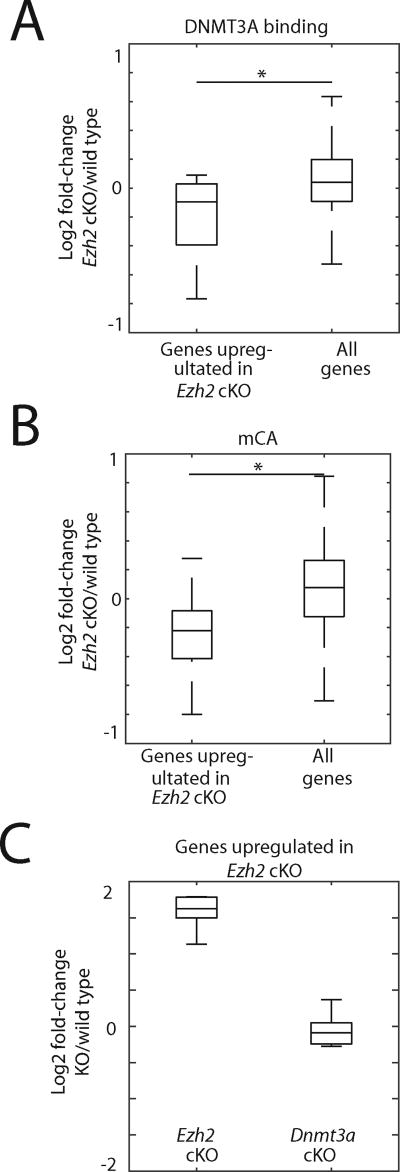
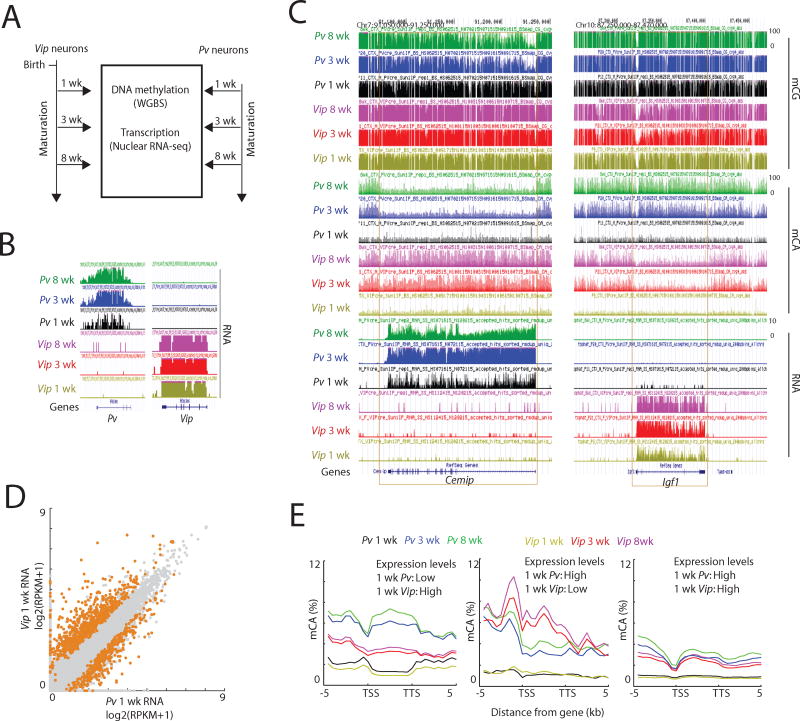
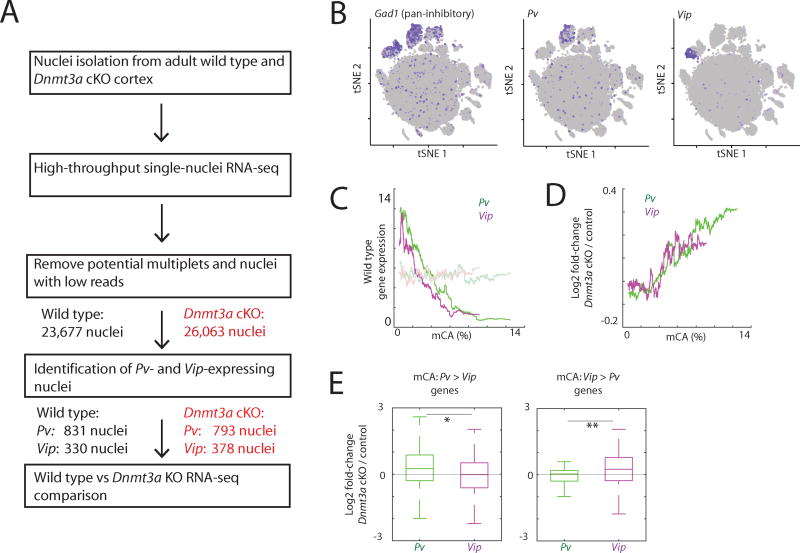
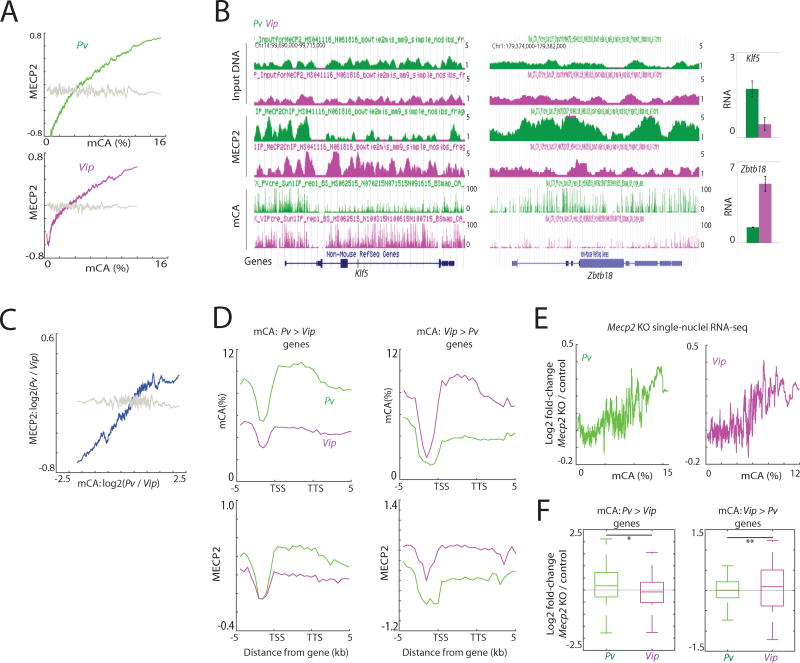
In mammals, the environment plays a critical role in promoting the final steps in neuronal development during the early postnatal period. While epigenetic factors are thought to contribute to this process, the underlying molecular mechanisms remain poorly understood. Here, we show that in the brain during early life, the DNA methyltransferase DNMT3A transiently binds across transcribed regions of lowly expressed genes, and its binding specifies the pattern of DNA methylation at CA sequences (mCA) within these genes. We find that DNMT3A occupancy and mCA deposition within the transcribed regions of genes is negatively regulated by gene transcription and may be modified by early-life experience. Once deposited, mCA is bound by the methyl-DNA-binding protein MECP2 and functions in a rheostat-like manner to fine-tune the cell-type-specific transcription of genes that are critical for brain function.


Figures

Figure 1
Figure 1. Genomic binding of DNMT3A in the brain during early life
(A) Genome browser views of DNMT3A ChIP-seq data in wild type and Dnmt3a cKO cortex. (B) Average DNMT3A distribution across all genes. DNMT3A signal was normalized to input DNA. TSS, transcription start site. TTS, transcription termination site. (C) Average DNMT3A distribution across putative distal enhancers. H3K27ac data from the forebrain over multiple developmental points was used (Nord et al., 2013), and H3K27ac peaks more than one kilobase apart from annotated TSS were analyzed (N=38,620). (D) Average distribution of 2-week and 8-week DNMT3A across DNMT3A-enriched regions in 2-week cortex (N=22,223). (E) Immunoprecipitation of DNMT3A under non-denaturing conditions from 2-week cortical extracts from wild type and Dnmt3a cKO (KO) mice. (F) DNMT3A binding and nucleosome density in two-week cortex across the genome in 5 kilobase tiles. Both MNase-seq and H3 ChIP-seq reads were normalized to sonicated input DNA (log2 ratio). The average nucleosome density was binned according to DNMT3A enrichment relative to input DNA. Nucleosome densities after random grouping of genomic tiles are shown as controls in faded lines (P<0.001, permutation test). (G) Genome browser view of ChIP-seq data in the two-week cortex. (H) Average distribution of H3K9me3 and H3K36me3 across defined DNMT3A-enriched regions. (I) Correlation between DNMT3A binding and RNA POL II occupancy across gene bodies in the two-week cortex. The average POL II (all) or POL II (Ser2P) across gene bodies were binned according to DNMT3A density. Promoter regions were excluded from the analyses. (J) Correlation between DNMT3A binding and gene expression in the two-week cortex. The average gene expression level was binned according to DNMT3A density. (K) Average DNMT3A distribution over genes of different expression levels in the wild type cortex. See also Figure S1.
Figure 2
Figure 2. DNMT3A binding specifies mCA patterns
(A) Genome browser view of mCA and DNMT3A ChIP-seq data. (B) Average distribution of mCA and oxidized forms of mCA over genes. (C) Correlation between two-week DNMT3A binding and mCA in the cortex. mCA was binned according to DNMT3A densities within 5 kilobase tiles across the genome. (D) Average distribution of 8-week mCA levels over 2-week DNMT3A-enriched regions. Distribution of DNMT3A is also shown. (E) Genome browser view of DNA methylation in wild type and Dnmt3a cKO cortex. See also Figure S2.
Figure 3
Figure 3. Experience-driven gene transcriptional induction disrupts local DNMT3A binding
(A) Genome browser views of DNMT3A binding and gene expression data in kainic acid-treated (KA) and PBS-treated (control) two-week hippocampi. (B) Effect of KA treatment on DNMT3A binding over all genes and KA-induced genes (N=51). DNMT3A ChIP-seq and input DNA read densities of two-week hippocampi within gene bodies were calculated, and log2 ratios between KA and control samples are shown. *P<0.0001, Wilcoxon rank-sum test. (C) Scheme illustrating the KA treatment from P10 to P20. (D) Boxplots of the difference between 10-week mCA in KA treated and control hippocampi within all genes and KA-induced genes. *P<0.05, Wilcoxon rank-sum test. See also Figure S3.
Figure 4
Figure 4. Genetic mutation-driven gene transcriptional induction disrupts local DNMT3A binding
(A) Effect Ezh2 mutation on DNMT3A binding over all genes and genes up-regulated by at least 2-fold in Ezh2 cKO (N=11). DNMT3A and H3 ChIP-seq read densities of two-week corticies within gene bodies were calculated, and log2 ratios between Ezh2 cKO and wild type control samples are shown. *P<0.05, Wilcoxon rank-sum test. (B) Boxplots of the difference between two-week mCA in Ezh2 cKO and wild type control corticies within all genes and genes up-regulated in Ezh2 cKO. *P<0.05, Wilcoxon rank-sum test. (C) Gene expression levels of genes defined as genes up-regulated in Ezh2 cKO. RNA-seq data for two-week Dnmt3a cKO and respective littermate wild type controls are also shown. See also Figure S4.
Figure 5
Figure 5. Cell type-specific transcription during early life shapes mCA patterns across genes
(A) The scheme of experimental design. (B) Genome browser views confirming specific enrichment of Pv and Vip transcripts in INTACT-isolated Pv and Vip nuclei, respectively. (C) Genome browser views of DNA methylation and transcription in cortical Pv and Vip neurons at the indicated developmental time points. (D) Scatterplot comparing 1 wk Pv and Vip transcript levels across all genes. Genes with differential gene expression (FDR<0.05) are highlighted in orange. Pv > Vip genes: N=363; Vip > Pv genes: N=698. (E) Average distribution of mCA over genes that were classified as lowly transcribed in one cell type and highly transcribed in the other, as well as genes classified as highly expressed in both cell types (see STAR Methods). See also Figure S5.
Figure 6
Figure 6. Single-nuclei sequencing reveals cell type-specific gene expression fine-tuning by mCA
(A) The scheme of experimental and analysis design. (B) Seurat t-SNE plots of all nuclei in samples. Nuclei expressing indicated marker genes are depicted in purple. (C) Correlation between wild type mCA densities within the gene bodies and the expression levels determined by single-nuclei RNA-seq. Gene expression levels after random grouping of genes are shown as controls in faded lines. (D) Correlation between wild type mCA densities within the gene bodies and transcriptional defects in Dnmt3a cKO cortex. (E) Cell type-specific gene repression defects in Dnmt3a KO neurons. Genes were separated based on the mCA densities within the gene bodies in Pv and Vip neurons. *P=3.6e-4, **P=0.001, Kolmogorov-Smirnov test. See also Figure S6.
Figure 7
Figure 7. Cell type-specific mCA directs MECP2-mediated gene repression
(A) Correlation between mCA and MECP2 binding in Pv and Vip neurons in the 8-week cortex within genes. The average MECP2 density relative to input DNA was binned according to mCA density within genes. MECP2 densities after random grouping of genes are shown as controls in grey (P<0.001, permutation test). (B) Genome browser views of mCA and MECP2 profiles in Pv and Vip neurons. Gene expression level determined by INTACT-purified RNA-seq is shown on right. Error bars represent s.d. between two biological replicates. (C) Correlation between the difference in mCA between Pv and Vip neurons, and MECP2 binding. MECP2 densities after random grouping of genes are shown as controls in grey (P<0.001, permutation test). (D) Average distribution of MECP2 over genes differentially CA-methylated. (mCA Pv > Vip genes: N=872; Vip > Pv genes: N=84). Distributions of mCA over the genes are also shown. (E) Correlation between mCA densities within the gene bodies and transcriptional defects in Mecp2 KO cortex (P<0.001 for Pv and P=0.001 for Vip, permutation test). (F) Cell type-specific gene repression defects in Mecp2 KO neurons. Genes were separated based on the mCA densities within the gene bodies in Pv and Vip neurons. *P=3.6e-5, **P=0.04, Kolmogorov-Smirnov test. See also Figure S7.

Comment in

  • Epigenetics: Leaving a lasting mark.
    Whalley K. Whalley K. Nat Rev Neurosci. 2017 Dec;18(12):710. doi: 10.1038/nrn.2017.144. Epub 2017 Nov 9. Nat Rev Neurosci. 2017. PMID: 29118448 No abstract available.

References

    1. Anders S, Pyl PT, Huber W. HTSeq--a Python framework to work with high-throughput sequencing data. Bioinformatics. 2015;31:166–169. - PMC - PubMed
    1. Baubec T, Colombo DF, Wirbelauer C, Schmidt J, Burger L, Krebs AR, Akalin A, Schubeler D. Genomic profiling of DNA methyltransferases reveals a role for DNMT3B in genic methylation. Nature 2015 - PubMed
    1. Baubec T, Ivanek R, Lienert F, Schubeler D. Methylation-dependent and -independent genomic targeting principles of the MBD protein family. Cell. 2013;153:480–492. - PubMed
    1. Bird A. DNA methylation patterns and epigenetic memory. Genes Dev. 2002;16:6–21. - PubMed
    1. Bloodgood BL, Sharma N, Browne HA, Trepman AZ, Greenberg ME. The activity-dependent transcription factor NPAS4 regulates domain-specific inhibition. Nature. 2013;503:121–125. - PMC - PubMed

Substances