. 2017 Nov 16;171(5):1015-1028.e13.
doi: 10.1016/j.cell.2017.09.016. Epub 2017 Oct 19.

Wild Mouse Gut Microbiota Promotes Host Fitness and Improves Disease Resistance

Affiliations

Wild Mouse Gut Microbiota Promotes Host Fitness and Improves Disease Resistance

Stephan P Rosshart et al. Cell. .

Abstract

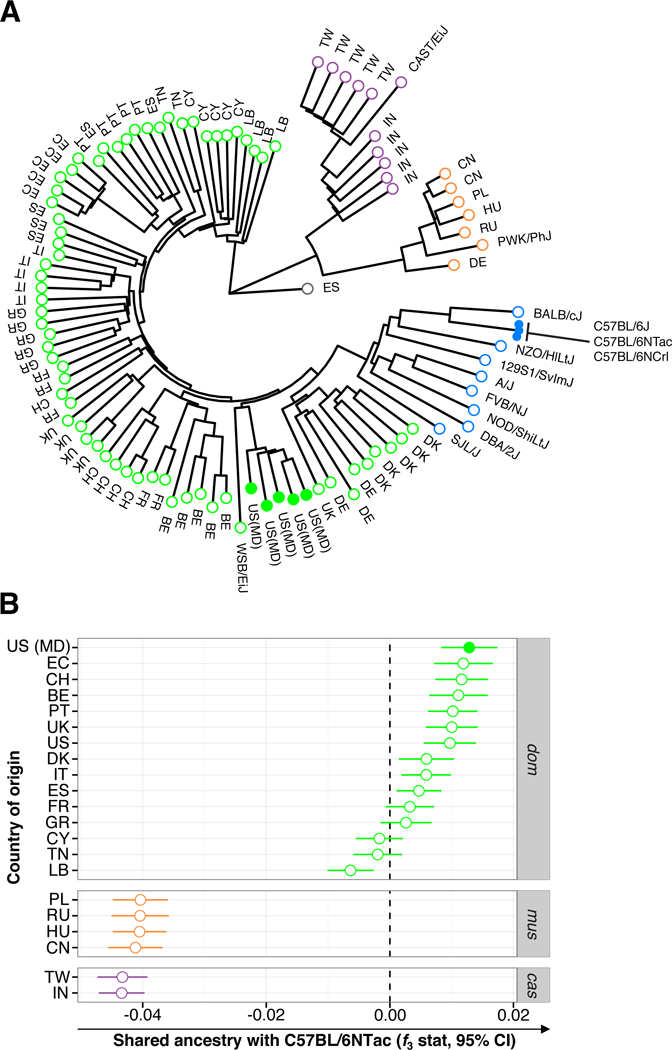
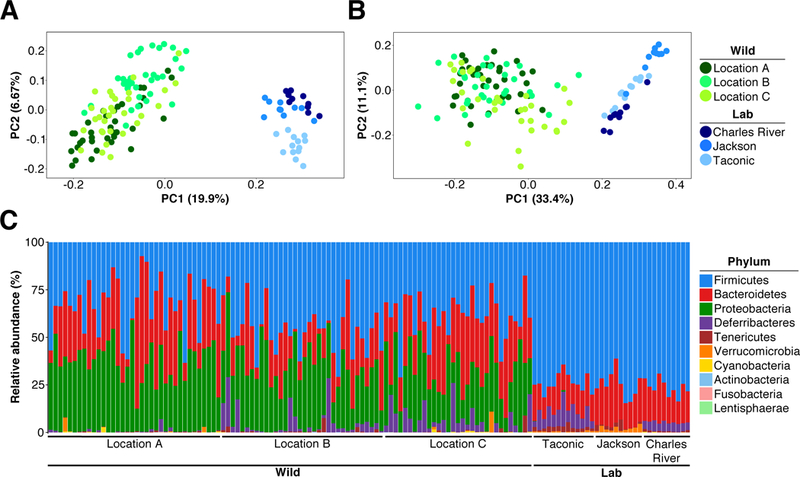
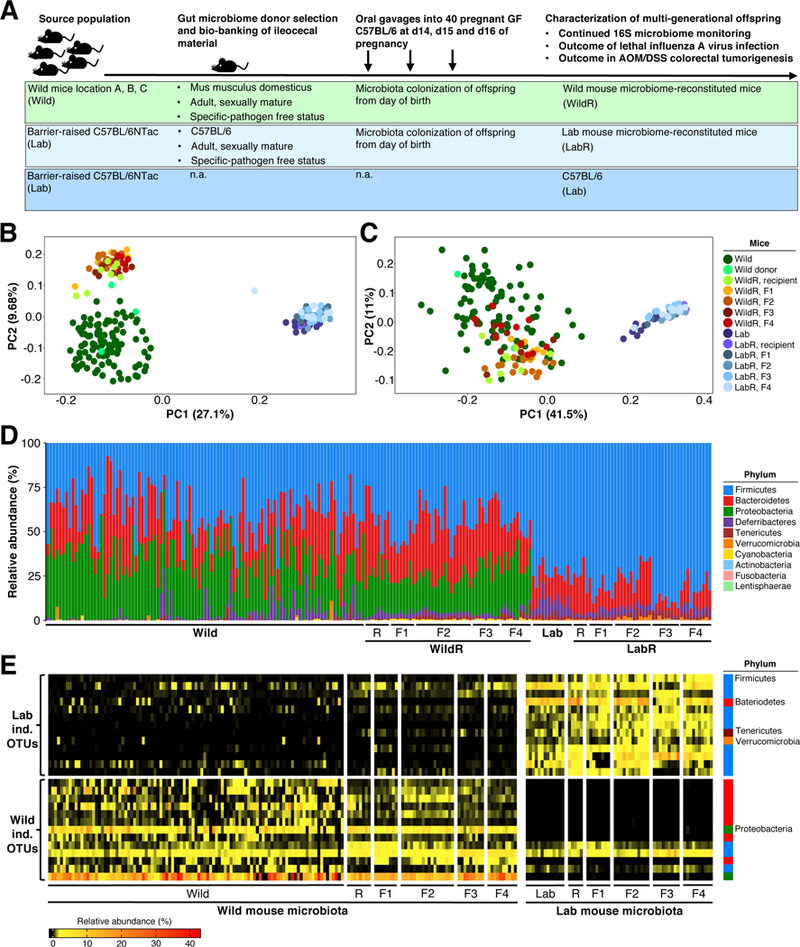
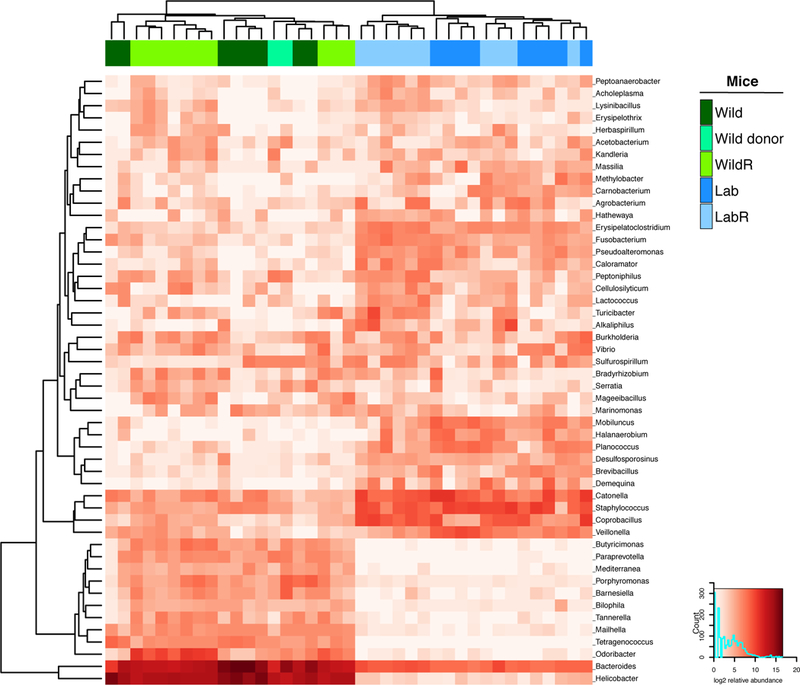
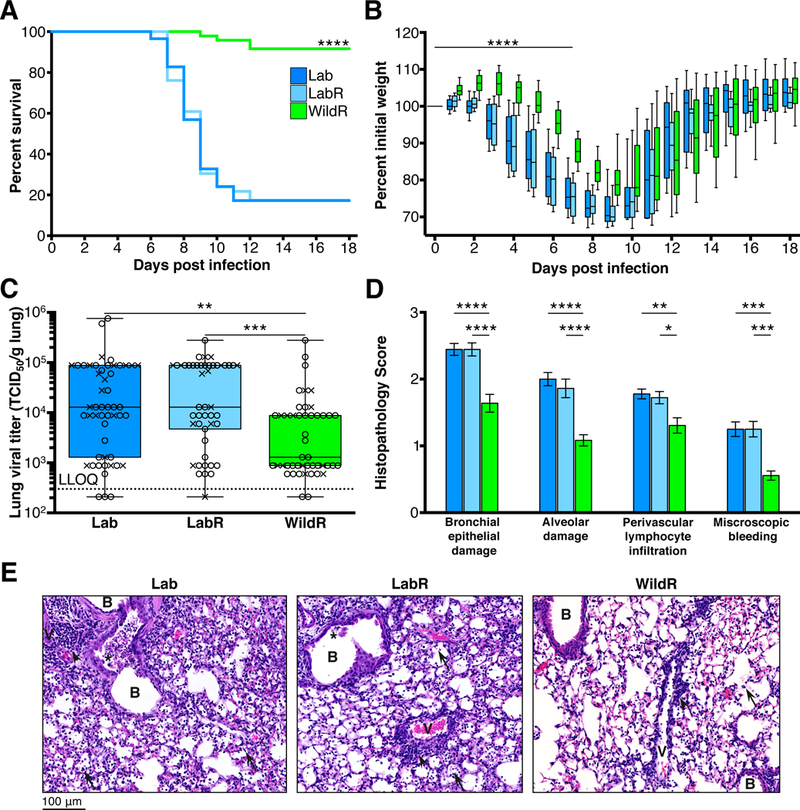
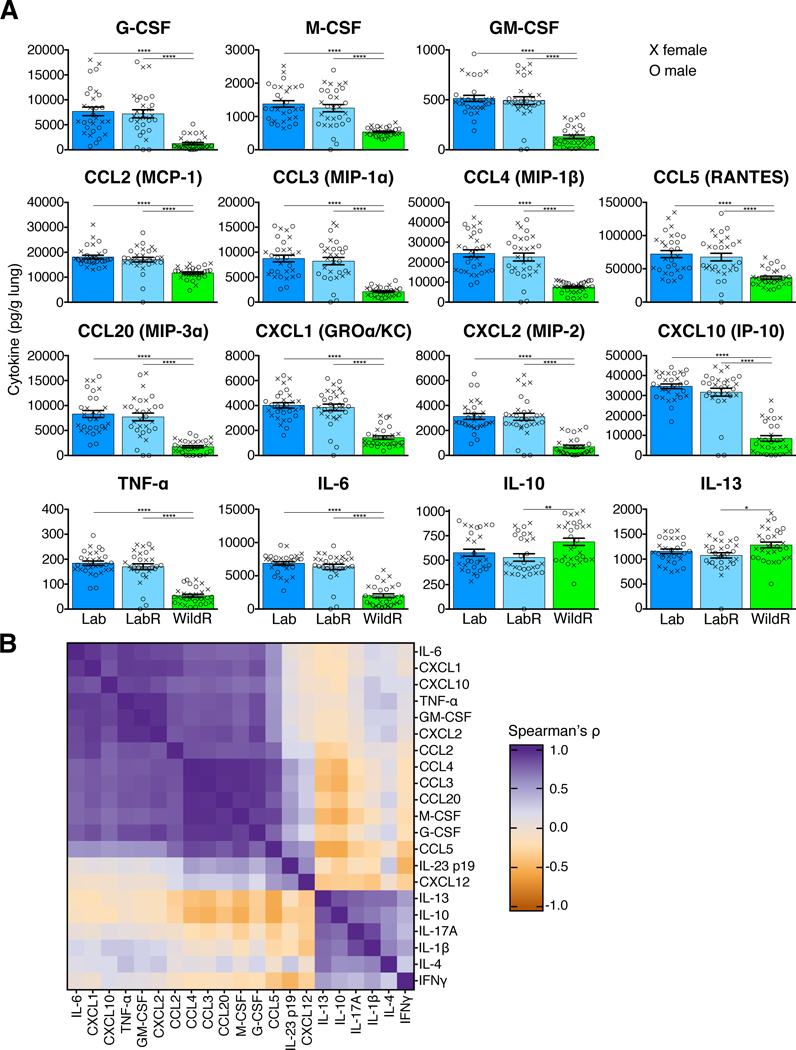
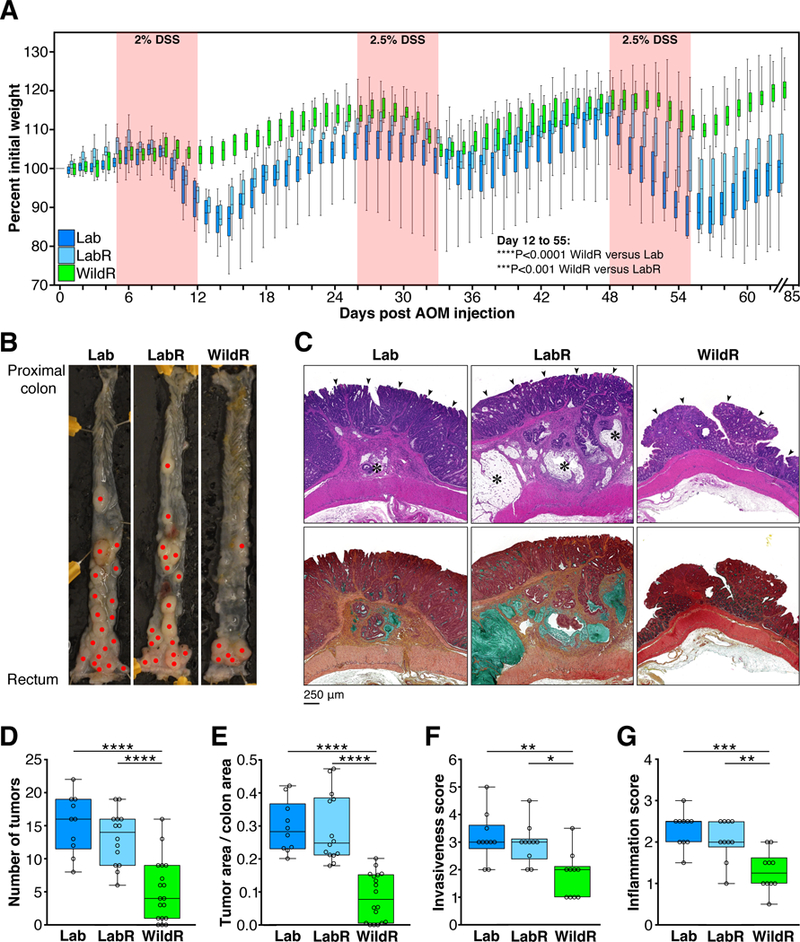
Laboratory mice, while paramount for understanding basic biological phenomena, are limited in modeling complex diseases of humans and other free-living mammals. Because the microbiome is a major factor in mammalian physiology, we aimed to identify a naturally evolved reference microbiome to better recapitulate physiological phenomena relevant in the natural world outside the laboratory. Among 21 distinct mouse populations worldwide, we identified a closely related wild relative to standard laboratory mouse strains. Its bacterial gut microbiome differed significantly from its laboratory mouse counterpart and was transferred to and maintained in laboratory mice over several generations. Laboratory mice reconstituted with natural microbiota exhibited reduced inflammation and increased survival following influenza virus infection and improved resistance against mutagen/inflammation-induced colorectal tumorigenesis. By demonstrating the host fitness-promoting traits of natural microbiota, our findings should enable the discovery of protective mechanisms relevant in the natural world and improve the modeling of complex diseases of free-living mammals. VIDEO ABSTRACT.

Keywords: bacteria; colorectal cancer; cytokine; gut; inflammation; influenza; innate; microbiome; virus; wild mouse.


Figures

Figure 1.
Figure 1.. Wild Mus musculus domesticus from Maryland, USA are close Relatives to Standard Laboratory Mouse Strains in Particular C57BL/6 Mice from Commercial Vendors
(A)Phylogenetic tree of wild mice from Maryland, USA (closed green circles) compared to other Mus musculus domesticus (open green circles; wild mice from countries with indicated 2-letter code, plus inbred strain WSB/EiJ), Mus musculus musculus (open orange circles; wild mice from countries with indicated 2-letter code, plus inbred strain PWK/PhJ), Mus musculus castaneus (open purple circles; wild mice from countries with indicated 2-letter code, plus inbred strain CAST/EiJ) and standard laboratory strains (blue). Each branch represents a single mouse. The tree is based on SNP genotypes and rooted using a single Mus spretus individual from Spain (grey circle labeled “ES”) as the outgroup. Outgroup f3 statistic; higher values indicate more shared ancestry between wild Mus musculus (dom, domesticus; mus, musculus and cas, castaneus) and C57BL/6 substrains (C57BL/6NTac, Taconic Biosciences; C57BL/6NCrl, Charles River; C57BL/6J, the Jackson Laboratory). Labels and colors as in panel A. CI, confidence interval.
Figure 2.
Figure 2.. The Laboratory Mouse Bacterial Gut Microbiome from Commercial Vendors is Significantly Different from that of their Wild Living Kin
16S rRNA gene profiling data comparing the gut microbiome of Mus musculus domesticus from locations A, B and C in Maryland, USA (Wild) to that of C57BL/6 mice from Taconic Biosciences, Charles River and the Jackson Laboratory (Lab). (A) Unweighted UniFrac PCoA. (B) Weighted UniFrac PCoA. (C) Relative abundance at the rank of phylum.See also Figure S2, Figure S4 and statistics within Tables S2 and S3.
Figure 3.
Figure 3.. The Mus musculus domesticus Bacterial Gut Microbiome can be Transferred to Pregnant GF C57BL/6 Mice and Maintained in their Multigenerational Offspring
(A) Experimental strategy. (B – E) 16S rRNA gene profiling data comparing the gut microbiome of Mus musculus domesticus (Wild) or C57BL/6NTac (Lab), the recipient mice (WildR and LabR recipients [R]), and their subsequent generations (WildR F1, F2, F3, F4 and LabR F1, F2, F3, F4). (B) Unweighted UniFrac PCoA. (C) Weighted UniFrac PCoA. (D) Relative abundance at the rank of phylum. (E) Indicator species analysis identified bacterial OTUs of the investigated Wild and Lab gut microbiomes. Heatmap shows the relative abundances of Wild indicative and Lab indicative OTUs from all sampled generations.See also Figures S5, Figure S6 and Table S6.
Figure 4.
Figure 4.. The Mus musculus domesticus Bacterial Gut Microbiome can be Transferred to Pregnant GF C57BL/6 Mice
Analysis of whole shotgun metagenomic data comparing the gut microbiome of Mus musculus domesticus (Wild), C57BL/6NTac (Lab), WildR and LabR mice. The heatmap shows the top 50 genera with greatest variance between sample groups of log2 transformed relative abundance.
Figure 5.
Figure 5.. The Mus musculus domesticus Gut Microbiome Confers a Survival Advantage after Lethal IAV Infection
Female mice were inoculated with 400 TCID50 and male mice with 600 TCID50 of PR8. (A and B) Mice were monitored daily for 18 days and mice that lost 30% or more of their body weight were euthanized (Lab,n=58; LabR, n=46; WildR, n=48). (A) Kaplan Meier survival curves, ****P<0.0001 comparing WildR with either LabR or Lab by log rank (Mantel-Cox) analysis. (B) Weight loss curves, ****P<0.0001 comparing the slope of the weight loss (day 0 to day 7) of WildR to that of LabR or Lab in a linear regression analysis. Weight loss of LabR did not significantly differ from that of Lab. Median and IQR are presented. (C) Lung viral titer 3 days post IAV infection assessed via MDCK monolayers in 96-well plates using an antibody-based assay. Lab, n=51; LabR, n=49; WildR, n=48. Median and IQR are presented. (D) Histopathological scores 7 days post IAV infection. B: Bronchi; V: Vessels; arrows: lymphocytes and/or red blood cells in alveoli; arrowheads: perivascular lymphocyte infiltration; asterisks: bronchial epithelial cell death. Mean and SEM are presented. (E) Representative lung histology 7 days post IAV infection (original magnification 40x). Lab, n=18; LabR, n=18; WildR, n=18. *P<0.05, **P<0.01, ***P<0.001, ****P<0.0001. Significance was determined using parametric One-Way ANOVA with Tukey multiple comparison test with 95% confidence interval (Gaussian model), or Kruskal-Wallis with Dunn’s multiple comparison test. All data shown are from three independent experiments using both female (X) and male (O) mice.See also Figure S7.
Figure 6.
Figure 6.. The Mus musculus domesticus Gut Microbiome Affects the Cytokine Profile of Mice after Lethal IAV Infection
Female mice were inoculated with 400 TCID50 and male mice with 600 TCID50 of PR8. Cytokines, chemokines and growth factors were quantified in lung tissue at day 4 post IAV infection using a multiplex Luminex assay. (A) Univariate analysis of the 15 of 21 cytokines that were differentially expressed in WildR as compared to LabR and Lab. Mean and SEM are presented. (B) Correlation matrix (using Spearman’s rank-correlation) between measurements of all 21 cytokines, hierarchically clustered and rendered as a heatmap. Lab, n=29; LabR, n=30; WildR, n=30. *P<0.05, **P<0.01, ****P<0.0001. Significance was determined using parametric One-Way ANOVA with Tukey multiple comparison test with 95% confidence interval (Gaussian model), or Kruskal-Wallis with Dunn’s multiple comparison test. All data shown are from three independent experiments using both female (X) and male (O) mice.
Figure 7.
Figure 7.. The Mus musculus domesticus Gut Microbiome Confers Protection from Colitis-Associated Tumorigenesis
Clinical data from male mice that received a single intraperitoneal injection of AOM (10 mg/kg of body weight), followed by three 7 day cycles of 2–2.5% DSS in drinking water. Mice were monitored for weight loss throughout the time-course of the experiment and euthanized on day 85 to assess tumor burden. (A) Weight loss curves following AOM/DSS treatment. Lab, n=18; LabR, n=16; WildR, n=19. WildR vs. Lab, ****P<0.0001, and WildR vs. LabR, ***P<0.001 (repeated measures mixed model linear regression). Weight loss of LabR did not significantly differ from that of Lab. (B) Representative images of dissected colons (red dots indicate tumors). (C) Representative colon histology (original magnification 10x). Upper panel: HandE staining of longitudinal colon tumor sections; arrowheads: well differentiated adenocarcinoma in mucosa. LabR and Lab tumors invade the submucosa and muscular layers with moderate to severe inflammation; asterisks: mucinous nodules. Lower panel: Movat’s staining of serial sections of the same tumors as in the upper row images. Mucinous nodules (mucin stained in green) containing mucinous carcinoma cells and tubular adenocarcinoma lining are found in submucosa and muscle layers of LabR and Lab tumors. Lab, n=10; LabR, n=10; WildR, n=10. (D) Number of tumors. (E) Fraction of total colon area covered in tumors. Tumor burden was assessed using ImageJ software. (F) Invasiveness scores based on tumor location. (G) Inflammation score based on inflammatory cell infiltration. Median and IQR are presented. *P<0.5, **P<0.01, ***P<0.001, ****P<0.0001. Significance was determined using parametric One-Way ANOVA with Tukey multiple comparison test with 95% confidence interval (Gaussian model). All data shown are from three independent experiments.

Comment in

References

    1. Abt MC, Osborne LC, Monticelli LA, Doering TA, Alenghat T, Sonnenberg GF, Paley MA, Antenus M, Williams KL, Erikson J, et al. (2012). Commensal bacteria calibrate the activation threshold of innate antiviral immunity. Immunity 37, 158–170. - PMC - PubMed
    1. Ackerman AL, and Underhill DM (2017). The mycobiome of the human urinary tract: potential roles for fungi in urology. Ann Transl Med 5, 31. - PMC - PubMed
    1. Beck JA, Lloyd S, Hafezparast M, Lennon-Pierce M, Eppig JT, Festing MF, and Fisher EM (2000). Genealogies of mouse inbred strains. Nat Genet 24, 23–25. - PubMed
    1. Benjamini, and Hochberg (1995). Controlling the false discovery rate: a practical and powerful approach to multiple testing. J R Stat Soc Series B 57 289–300.
    1. Beura LK, Hamilton SE, Bi K, Schenkel JM, Odumade OA, Casey KA, Thompson EA, Fraser KA, Rosato PC, Filali-Mouhim A, et al. (2016). Normalizing the environment recapitulates adult human immune traits in laboratory mice. Nature 532, 512–516. - PMC - PubMed