. 2017 Nov 2;171(4):795-808.e12.
doi: 10.1016/j.cell.2017.09.052. Epub 2017 Oct 19.

ILC1 Confer Early Host Protection at Initial Sites of Viral Infection

Affiliations

ILC1 Confer Early Host Protection at Initial Sites of Viral Infection

Orr-El Weizman et al. Cell. .

Abstract

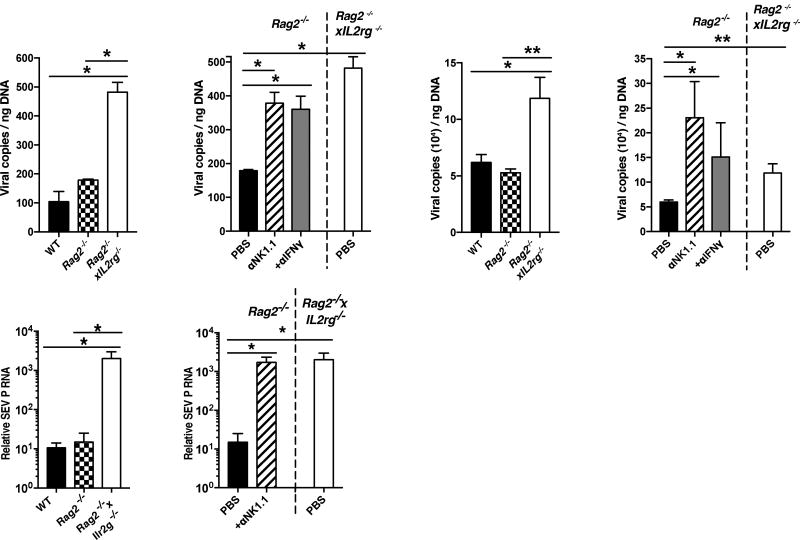
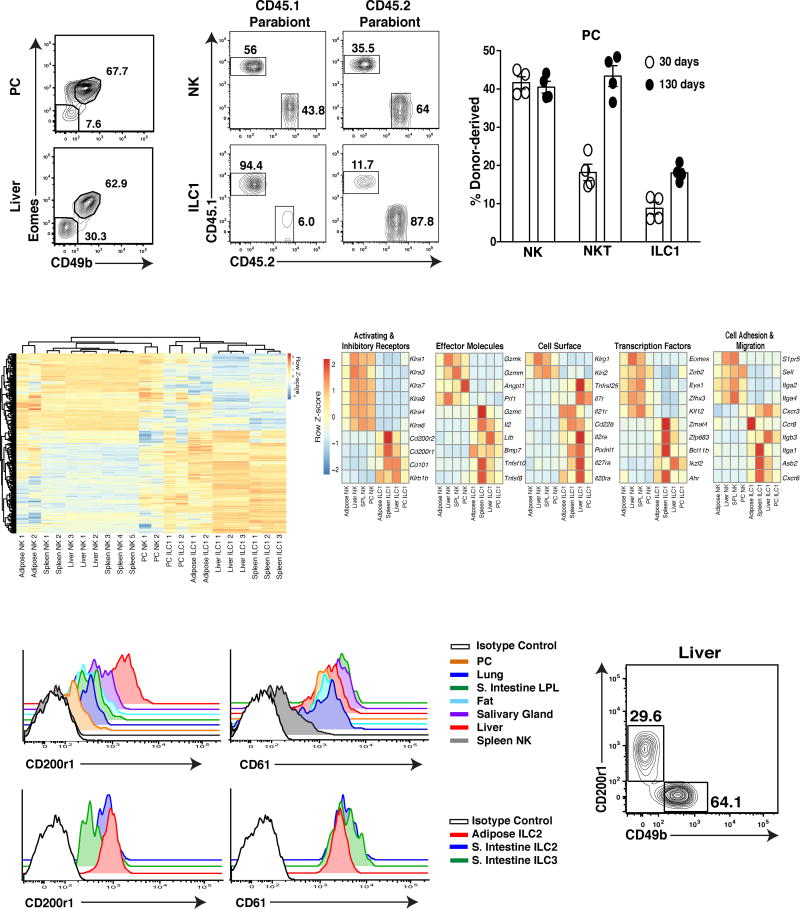
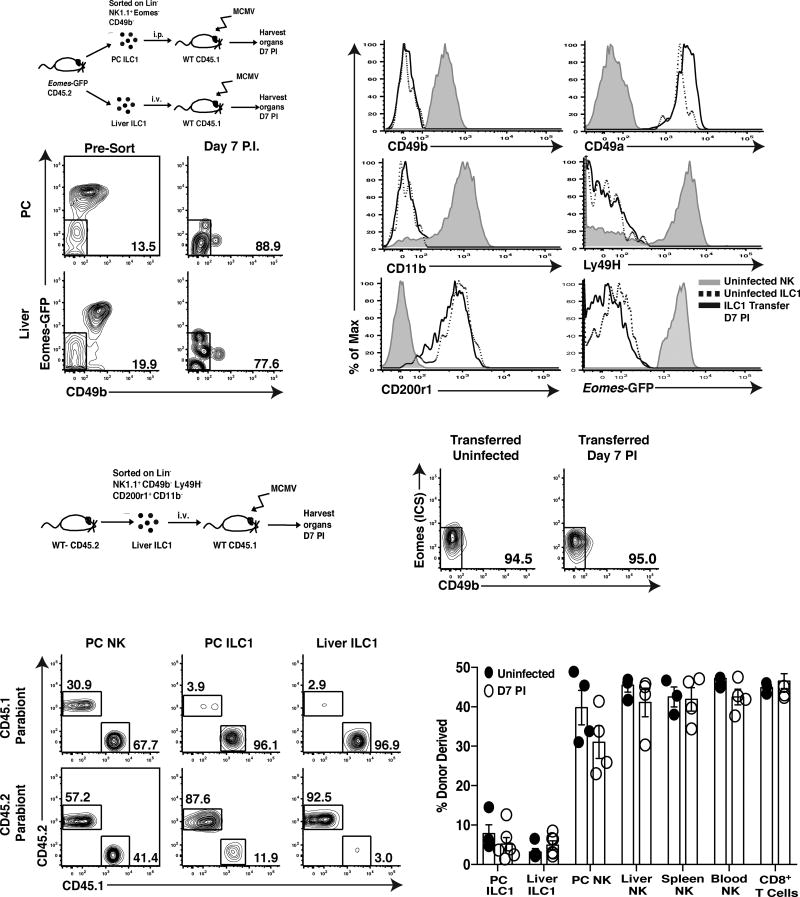
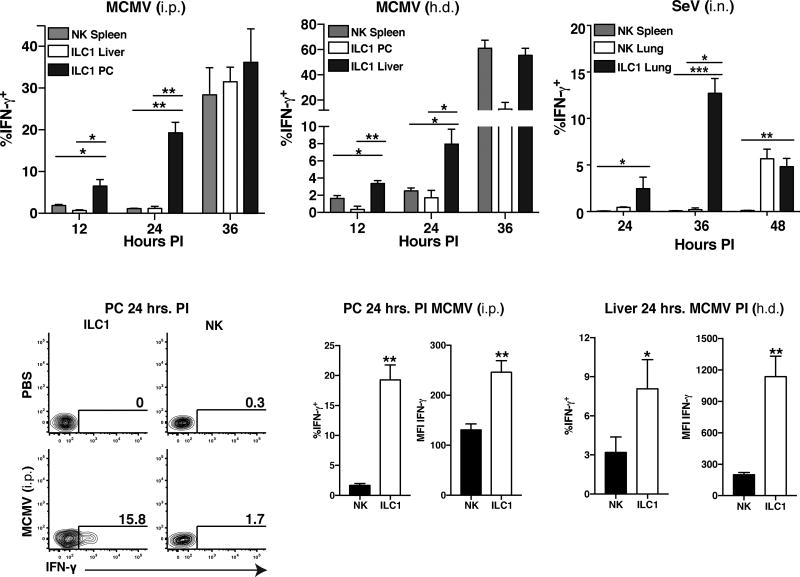
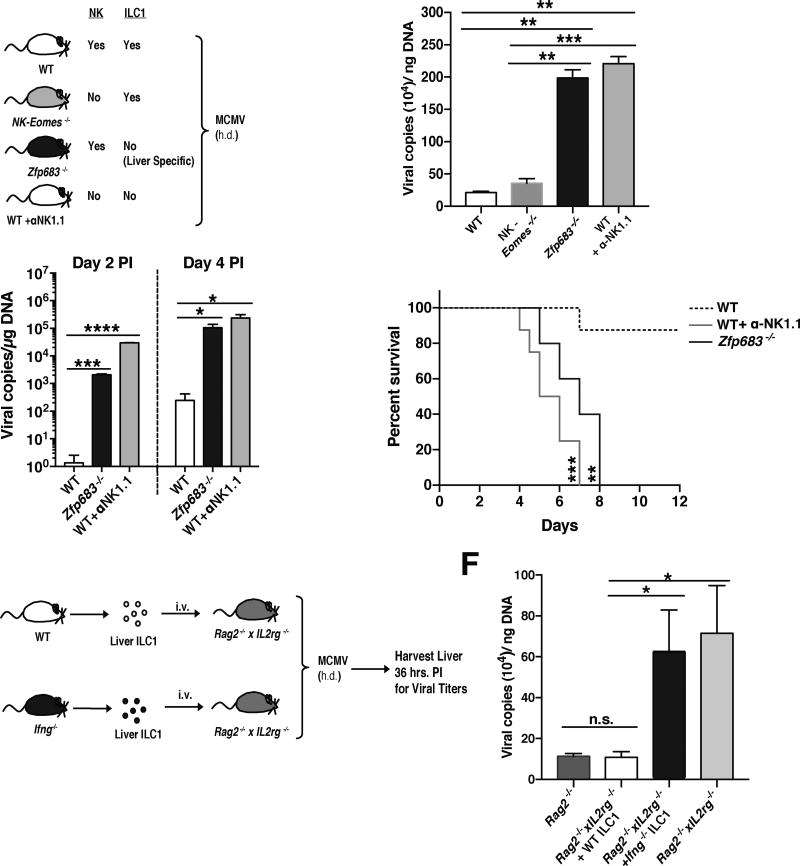
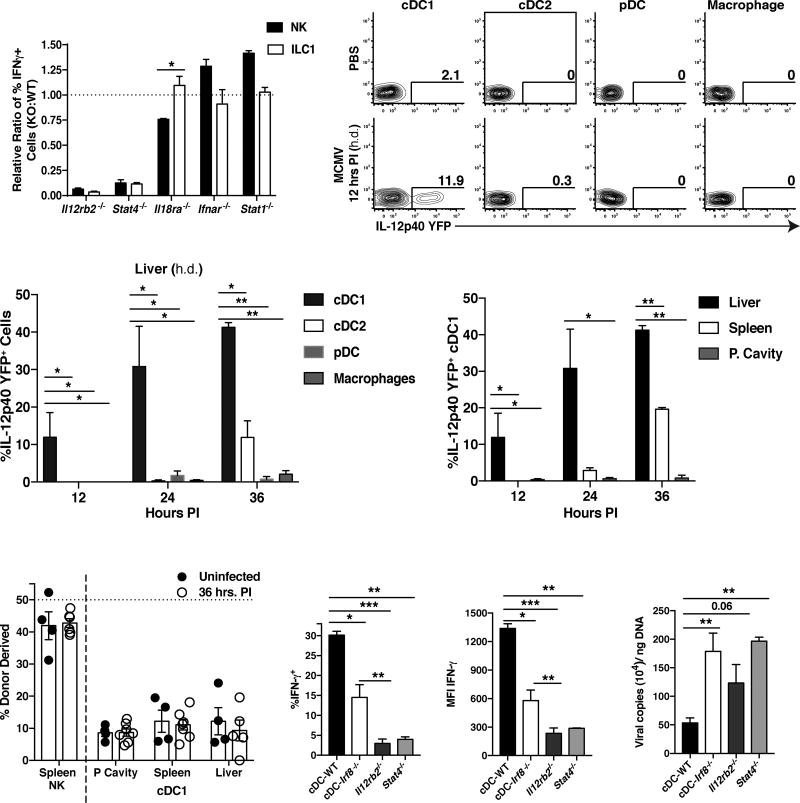
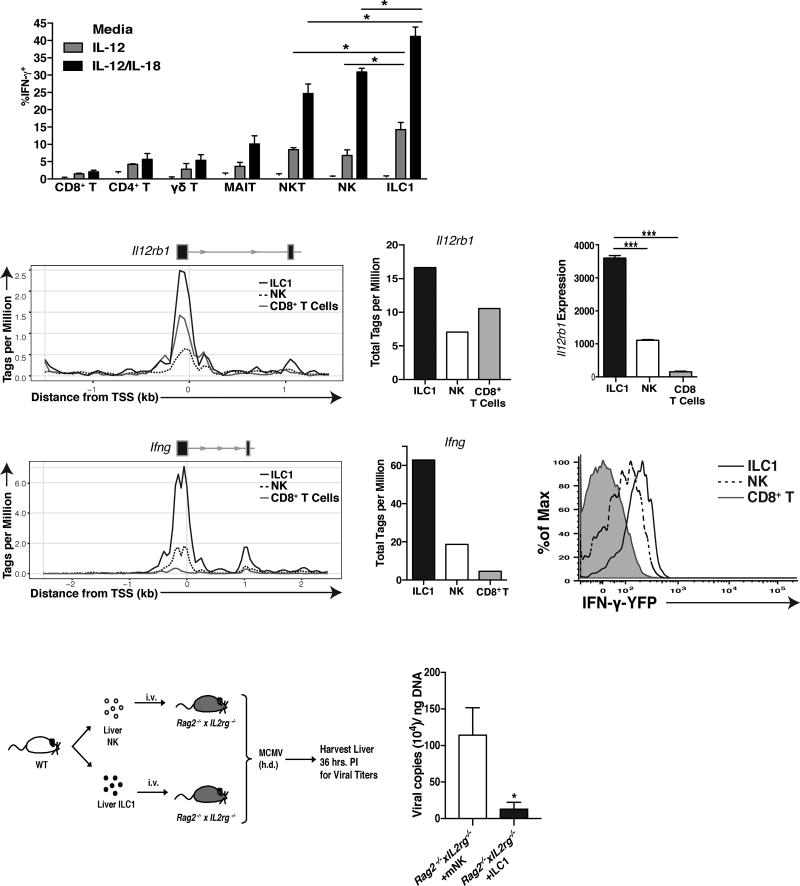
Infection is restrained by the concerted activation of tissue-resident and circulating immune cells. Whether tissue-resident lymphocytes confer early antiviral immunity at local sites of primary infection prior to the initiation of circulating responses is not well understood. Furthermore, the kinetics of initial antiviral responses at sites of infection remain unclear. Here, we show that tissue-resident type 1 innate lymphoid cells (ILC1) serve an essential early role in host immunity through rapid production of interferon (IFN)-γ following viral infection. Ablation of Zfp683-dependent liver ILC1 lead to increased viral load in the presence of intact adaptive and innate immune cells critical for mouse cytomegalovirus (MCMV) clearance. Swift production of interleukin (IL)-12 by tissue-resident XCR1+ conventional dendritic cells (cDC1) promoted ILC1 production of IFN-γ in a STAT4-dependent manner to limit early viral burden. Thus, ILC1 contribute an essential role in viral immunosurveillance at sites of initial infection in response to local cDC1-derived proinflammatory cytokines.

Keywords: ILC1; MCMV; cDC1; infection; influenza; innate immunity; sendai virus; tissue-resident.


Conflict of interest statement

The authors declare no financial conflicts of interest.

Figures

Figure 1
Figure 1. Group 1 ILCs and IFN-γ confer early viral control at local sites of infection
(A–B) (A) WT, Rag2−/−, Rag2−/− x IL2rg−/− mice and (B) Rag2−/− mice treated with PBS, α-NK1.1 or α-IFN-γ, were infected with MCMV intraperitoneally (i.p.). Viral titers were measured in the peritoneal cavity (PC) at 36 hrs post-infection (PI). (C–D) (C) WT, Rag2−/−, Rag2−/−xIL2rg−/− mice and (D) Rag2−/− mice treated with PBS, α-NK1.1 or α-IFN-γ, were infected with MCMV hydrodynamically (h.d.). Viral titers were measured in the liver at 36 hrs PI. (E–F) (E) WT, Rag2−/−, Rag2−/− x IL2rg−/− mice and (F) Rag2−/− mice treated with PBS or α -NK1.1 were infected with SeV intranasally (i.n.). Viral load was measured in the lung at 48 hrs post-infection (PI) by RTqPCR. Data are representative of 2 independent experiments of 4–6 mice per group. Samples were compared using an unpaired, two-tailed Student’s t test, and data are presented as the mean ± SEM (*p<0.05, **p<0.01).
Figure 2
Figure 2. PC and liver-resident ILC1 are distinct from circulating NK cells
(A) Representative plots are gated on total Group 1 ILCs (LinNKp46+NK1.1+Tbet+) and show Eomes and CD49b expression in the PC and liver of WT mice. (Lin=CD3ε+TCRβ+CD19+F4/80+). (B–C) Parabiotic mice were generated by surgically connecting CD45.1+ and CD45.2+ mice for 30 and 130 days. (B) Representative plots show host and donor derived NK cells (CD49b+Eomes+) and ILC1 (CD49bEomes) and (C) percentage of donor derived populations in the PC. (NKT = CD45+CD19F4/80TCRβ+CD3ε+NK1.1+). (D–E) RNA-sequencing reveals gene expression signature of the indicated cell populations sorted purified from Eomes-GFP mice. (D) Differential gene expression across all samples for all genes with FDR-adjusted p-value less than 10−5 (713 total). (E) Gene expression signature of all samples indicated by a manually curated representative subset from part D. Heat map shows data pooled from biological replicates (see methods). (F) Histograms show CD200r1 and CD61 expression on resting splenic NK cells and ILC1 from indicated tissues (upper panels), and on resting NK cells, ILC1, ILC2 and ILC3 from the small intestine lamina propria of WT mice (bottom panels). (G) Representative plot shows CD200r1 and CD49b expression on LinNKp46+NK1.1+Tbet+ cells in the liver of WT mice. Data are representative of 2 to 3 independent experiments with (A, F–G) n=5 mice, (B–C), n= 3–4 parabiotic pairs and (D–E) n= 40–50 mice per group.
Figure 3
Figure 3. ILC1s represent a stable lineage during viral infection
(A) Schematic of experiment. Briefly, 1×10⁴ PC ILC1 and 3.5×10⁴ liver ILC1 (CD45.2+LinNK1.1+EomesCD49b) were sorted from Eomes-GFP mice and adoptively transferred into separate CD45.1+ WT mice, i.p. or i.v., respectively. Mice were subsequently infected with MCMV and analyzed at 7 days PI. (B) Plots show ILC1 from the PC and livers of uninfected Eomes-GFP mice (left plots) and following transfer and MCMV infection (day 7 PI, right plots). (C) Histograms show indicated cell surface markers on liver ILC1 and NK cells from uninfected Eomes-GFP mice, and adoptively transferred liver ILC1 at 7 days PI. (D) Schematic of experiment. 4×10⁴ liver ILC1 (LinNK1.1+CD49a+CD49bCD200r1+CD11b Ly49h) were sorted from CD45.2+ mice, adoptively transferred i.v. into CD45.1+ WT mice, and subsequently infected with MCMV. (E) Representative plots show CD49b and intracellular Eomes staining of adoptively transferred ILC1 recovered in the liver at 7 days PI. (F–G) Parabiotic mice were generated and both parabionts infected with MCMV i.p. Organs were analyzed at day 7 PI for chimerism of indicated lymphocyte populations. (F) Representative plots and (G) percentage of donor derived NK cells and ILC1 shown for indicated organs. Data are representative of 3 independent experiments with (A–E) n=3–4 mice and (F–G) n=3–4 parabiotic pairs per group.
Figure 4
Figure 4. ILC1 rapidly produce IFN-γ early during host anti-viral responses at initial sites of infection in naïve hosts
WT mice were infected with MCMV either i.p. or h.d. or SEV i.n., and peripheral tissues were harvested and analyzed for intracellular IFN-γ staining. (A–B) Quantification of intracellular IFN-γ staining of indicated group 1 ILC populations at various time points following either MCMV (i.p. or h.d.). (C) Quantification of intracellular IFN-γ staining of indicated group 1 ILC populations at various time points following SeV (i.n.) infection in i.v. unlabeled fraction of indicated organ. (D) Flow plots show intracellular IFN-γ staining of NK cells and ILC1 in PC at 24 hrs PI (MCMV, i.p.). (E–F) Quantification of intracellular IFN-γ staining by percentage and MFI of NK cells and ILC1 in (E) PC (MCMV, i.p.) or (F) liver (MCMV, h.d.) at 24 hrs PI. Data are representative of 3–4 independent experiments with n=5–7 mice per group. Samples were compared using an unpaired, two-tailed Student’s t test, and data are presented as the mean ± SEM (*p<0.05, **p<0.01,***p<0.001).
Figure 5
Figure 5. Production of IFN-γ by ILC1 confers early host anti-viral protection at initial sites of infection
(A–D) (A) Schematic of experiment. WT, NK-Eomes−/−, Zfp683−/− (Hobit-deficient), and WT mice treated with α-NK1.1 were infected with MCMV by h.d. injection. Viral titers of each indicated cohort are shown for (B) the liver at 36 hrs PI and (C) the peripheral blood at day 2 and 4 PI. (D) Kaplan-Meier survival curves of each indicated cohort. (E) Schematic of experiment. 4×10⁴ liver ILC1 from either WT or Ifng−/− were adoptively transferred i.v. into separate Rag2−/− x IL2rg−/− recipients and subsequently infected with MCMV by h.d. injection. (F) Viral titers of each indicated cohort are shown for liver at 36 hrs PI. Data are representative of 3–4 independent experiments with n=5–7 mice per group. Samples were compared using an unpaired, two-tailed Student’s t test, and data are presented as the mean ± SEM (*p<0.05, **p<0.01, ***p<0.001, ****p<0.0001).
Figure 6
Figure 6. Tissue-resident cDC1 rapidly produce IL-12 during viral infection to drive optimal IFN-γ production by ILC1
(A) Mixed bone marrow chimeras (mBMC) harboring WT (CD45.1+) and selected proinflammatory cytokine receptors- or STAT molecule-deficient (CD45.2+) bone marrow were infected at 8 weeks following reconstitution with MCMV (i.p. injection). Intracellular IFN-γ production was assessed at 36 hrs PI in the PC, and data is represented as the relative ratio of IFN-γ production of KO to WT cells within each infected chimeric mouse. (B–D) Il-12p40-YFP reporter mice were infected with MCMV by h.d. injection and peripheral tissues were harvested and analyzed for YFP+ cells at various time points PI (cDC1 = CD45+LinCD64MHCIIhiCD11chiCD11bXCR1+, cDC2 = CD45+LinCD64MHCIIhiCD11chiXCR1CD11b+, pDC = CD45+LinCD64+MHCII+CD11c+CD11bXCR1B220+, Macrophage = CD45+LinCD64+MHCII+CD11b+). (B) Flow plots and (C) graphs show percentages of YFP+ cells in different liver populations at 12, 24, and 36 hours PI. (D) Quantification of YFP+ cDC1 in peripheral tissues at 12, 24, and 36 hours PI. (E) Parabiotic mice were generated and both parabionts were infected with MCMV i.p. Percentage of donor derived spleen NK cells and cDC1 in indicated organs at 36 hours PI. (F–H) WT, cDC-Irf8−/−, Il12rb2−/−, and Stat4−/− mice were infected with MCMV by h.d. injection and analyzed at 36 hours PI. Graphs show (F) percentage and (G) MFI of IFN-γ-expressing liver ILC1, and (H) viral titers in the liver within each group. Data are representative of 2 independent experiments with (A–E) n=3–4 and (F–G) n=5–7 mice per group. Samples were compared using an unpaired, two-tailed Student’s t test, and data are presented as the mean ± SEM (*p<0.05, **p<0.01, ***p<0.001,).
Figure 7
Figure 7. ILC1 are the most responsive to IL-12 amongst IFN-γ producing lymphocytes
(A) Graph shows percentage of IFN-γ+ cells within indicated liver populations following stimulation with either media alone, IL-12, or IL-12 plus IL-18. (CD8+ T = TCRb+CD3+CD8a+ MR-1, CD4+ T = TCRb+CD3+CD4+ MR-1, γδ T = CD3+TCRγ/δ+, MAIT = CD3+MR-1+) (B) ATAC-seq peaks and (C) quantification of peaks, mapping to Il12rb1 promoter (1.5 kb upstream and downstream of the transcriptional start site) in resting ILC1, NK cells, and CD8+ T cells. Il12rb1 exons are shown as black boxes with black arrows denoting the origin and directionally of transcription. (D) RNA-seq reads mapping to Il12rb1 in the indicated populations. (E) ATAC-seq peaks and (F) quantification of peaks, mapping to Ifng promoter (2.5 kb upstream and downstream of the transcriptional start site) in resting ILC1, NK cells, and CD8+ T cells. (G) Histogram shows percentage of YFP+ cells within liver NK cells, ILC1, and CD8+ T cells from Ifng-YFP reporter (GREAT) mice. (H) Schematic of experiment. 3×10⁴ liver ILC1 and 6×10⁴ liver NK cells were adoptively transferred into Rag2−/−xIL2rg−/− recipients and at 7 days post-transfer (when equal numbers of ILC1 and NK cell can be recovered in the liver), recipient mice were challenged with MCMV by h.d. injection. (I) Graph shows the viral titers within the liver of each group at 36 hours PI. ATAC-seq data represents 1 experiment of 15 pooled mice per population, and the rest of the data is representative of 2–3 experiments of 4–6 mice per group. Samples were compared using an unpaired, two-tailed Student’s t test, and data are presented as the mean ± SEM (*p<0.05, ***p<0.001)

References

    1. Abt MC, Lewis BB, Caballero S, Xiong H, Carter RA, Susac B, Ling L, Leiner I, Pamer EG. Innate Immune Defenses Mediated by Two ILC Subsets Are Critical for Protection against Acute Clostridium difficile Infection. Cell host & microbe. 2015;18:27–37. - PMC - PubMed
    1. Alexandre YO, Cocita CD, Ghilas S, Dalod M. Deciphering the role of DC subsets in MCMV infection to better understand immune protection against viral infections. Frontiers in microbiology. 2014;5:378. - PMC - PubMed
    1. Ariotti S, Hogenbirk MA, Dijkgraaf FE, Visser LL, Hoekstra ME, Song JY, Jacobs H, Haanen JB, Schumacher TN. T cell memory. Skin-resident memory CD8(+) T cells trigger a state of tissue-wide pathogen alert. Science. 2014;346:101–105. - PubMed
    1. Artis D, Spits H. The biology of innate lymphoid cells. Nature. 2015;517:293–301. - PubMed
    1. Biron CA, Tarrio ML. Immunoregulatory cytokine networks: 60 years of learning from murine cytomegalovirus. Medical microbiology and immunology. 2015;204:345–354. - PMC - PubMed

Substances

LinkOut - more resources