. 2017 Nov 16;171(5):1042-1056.e10.
doi: 10.1016/j.cell.2017.09.048. Epub 2017 Oct 19.

Comprehensive Analysis of Hypermutation in Human Cancer

Affiliations

Comprehensive Analysis of Hypermutation in Human Cancer

Brittany B Campbell et al. Cell. .

Abstract

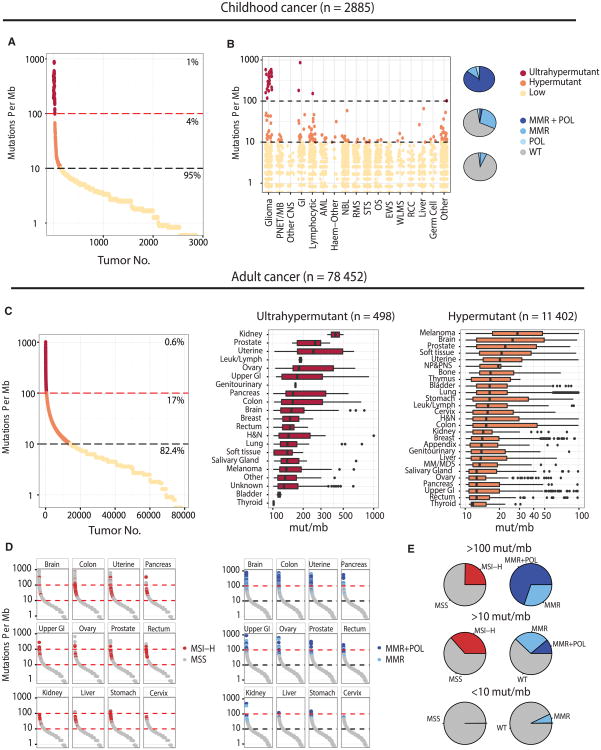
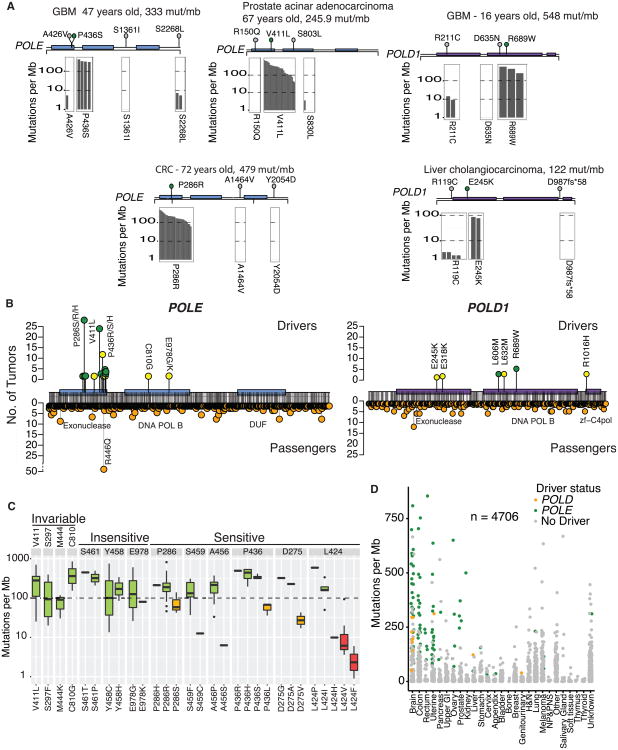
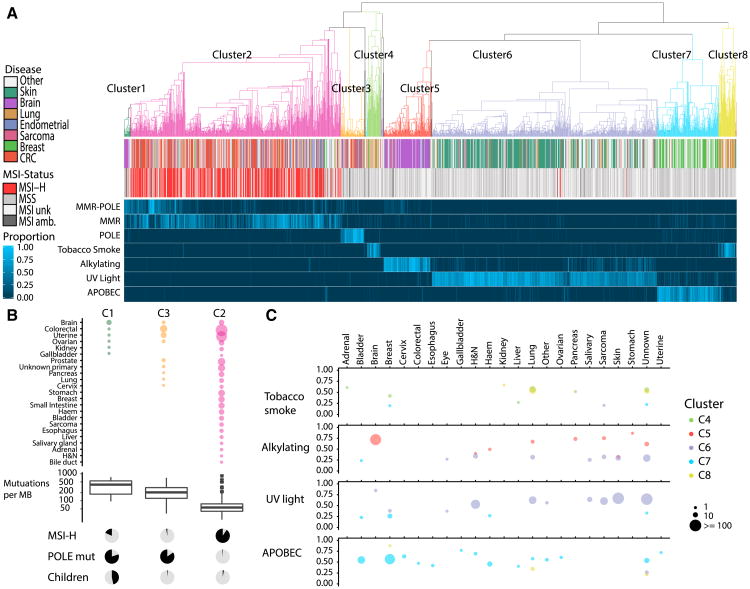
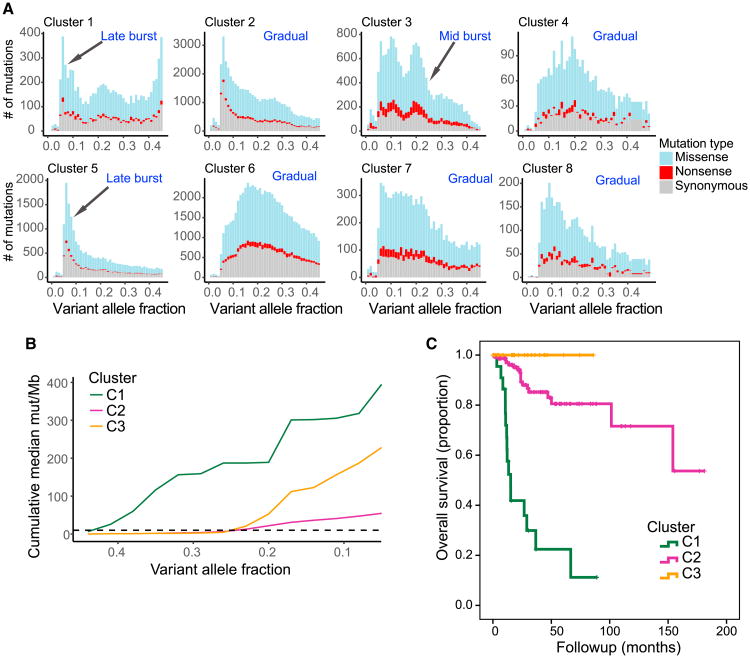
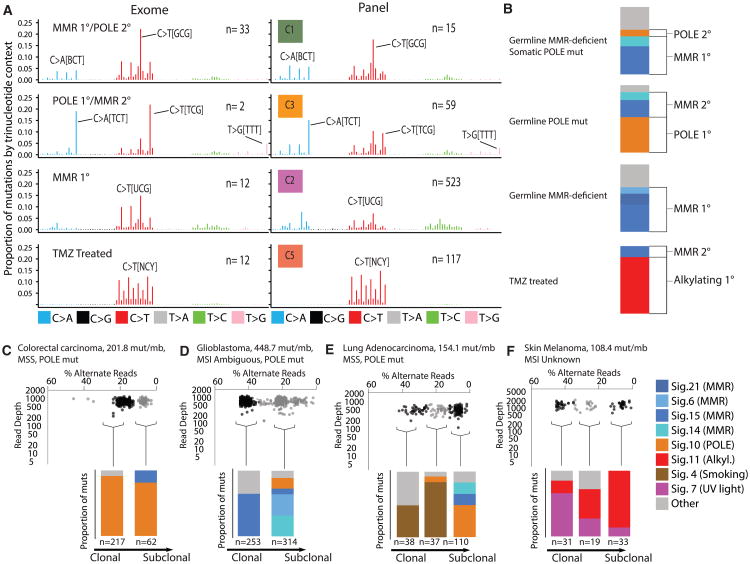
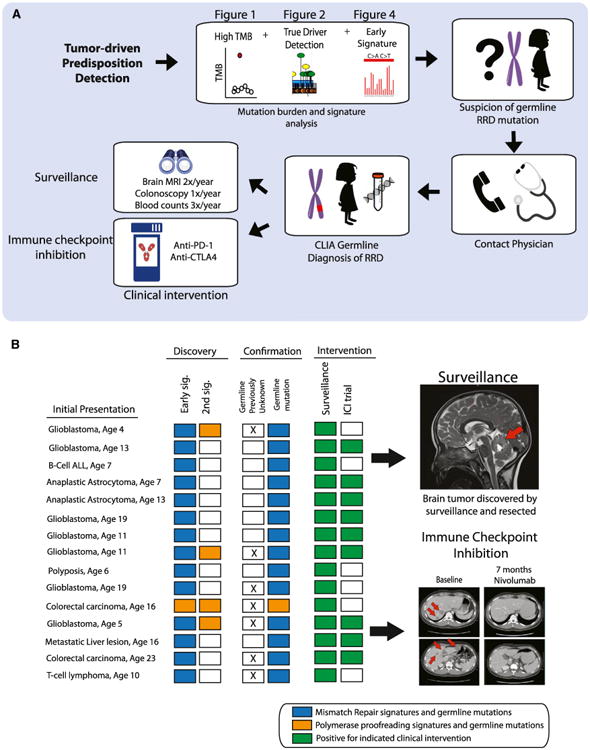
We present an extensive assessment of mutation burden through sequencing analysis of >81,000 tumors from pediatric and adult patients, including tumors with hypermutation caused by chemotherapy, carcinogens, or germline alterations. Hypermutation was detected in tumor types not previously associated with high mutation burden. Replication repair deficiency was a major contributing factor. We uncovered new driver mutations in the replication-repair-associated DNA polymerases and a distinct impact of microsatellite instability and replication repair deficiency on the scale of mutation load. Unbiased clustering, based on mutational context, revealed clinically relevant subgroups regardless of the tumors' tissue of origin, highlighting similarities in evolutionary dynamics leading to hypermutation. Mutagens, such as UV light, were implicated in unexpected cancers, including sarcomas and lung tumors. The order of mutational signatures identified previous treatment and germline replication repair deficiency, which improved management of patients and families. These data will inform tumor classification, genetic testing, and clinical trial design.

Keywords: DNA repair; DNA replication; cancer genomics; cancer predisposition; hypermutation; immune checkpoint inhibitors; mismatch repair; mutator.


Figures

Figure 1
Figure 1. The Landscape of Hypermutation across 81,337 Pediatric and Adult Cancers
(A) Mutation burden for 2,885 pediatric cancers. ≥ 10 mut/Mb = hypermutant; ≥ 100 mut/Mb = ultra-hypermutant. (B) Hypermutation pediatric cohort by tumor type. The pie chart depicts the proportion of tumors with mutations in replication repair genes (MSH2, MLH1, MSH6, PMS2 POLE, and POLD1). (C) Mutation burden range for 78,452 adult tumors with breakdown by tumor type. (D) Tumor types that show enrichment for MSI-MSI-H tumors cluster in the 10–100 Mut/Mb range, while tumors with mismatch repair and polymerase proofreading in the same types are ultrahypermutant. (E) Proportion of ultra-hypermutant, hypermutant, and lowly mutated tumors, and their correlation with MSI-H and MMR/POL mutations. GI, gastrointestinal; AML, acute myeloid leukemia; NBL, neuroblastoma; RMS, rhabdomyosarcoma; STS, soft tissue sarcoma; OS, osteosarcoma; EWS, Ewing sarcoma; WLMS, Wilm's tumor; RCC, renal cell carcinoma; NP&PNS, nasopharynx and paranasal sinuses undifferentiated carcinoma; and MM&MDS, mutiple myeloma and myelodysplastic syndrome. See also Figures S1 and S2 and Table S1.
Figure 2
Figure 2. Characterization of Known and Novel POLE and POLD1 Drivers
(A) Examples of tumors with three or more POLE/POLD1 mutations. Other tumors found in the entire dataset harboring the same mutations shown below (gray bars represent individual tumors and their burden is shown on the y axis). No bars indicate no other tumors identified with this mutation. One clear driver emerges in each tumor. (B) Landscape of drivers (top) and passengers (bottom) in POLE and POLD1. Green circles, previously known drivers; yellow circles, novel drivers, first described here. (C) Codons in POLE with driver mutations, indicating whether they are sensitive to amino acid changes. Invariable codons are those at which only one amino acid change was detected. Insensitive codons are those in which the mutation burden was high, regardless of amino acid change. Sensitive codons are those in which certain amino acid changes would abrogate the mutator effect. Green, yellow, and red bars represent strong, moderate, and weak mutation burden phenotypes, respectively. (D) All tumors harboring POLE and POLD1 mutations by tumor type. Green, POLE driver; yellow, POLD1 driver; and gray, passenger mutation. See also Figure S3 and Tables S2 and S3.
Figure 3
Figure 3. Unsupervised Clustering by Trinucleotide Context Reveals Mutational Etiology of Hypermutant Tumors
(A) Top: Hierarchical clustering of 1,521 tumors by trinucleotide context reveals 8 major clusters. Middle: Disease type, MSI status. Bottom: Heatmap colored by proportion of mutations from each class of mutational signatures. (B) Top: Range of tumors types found in clusters C1, C2, and C3, size of circle indicates number of tumors. Middle: Boxplots displaying mutation burden. Bottom: Proportion of tumors in each cluster that are MSI-high, POLE mutant, and arising in children, respectively. (C) Average proportion of mutations attributed by 4 mutational signature classes, tobacco smoke (signature 4), alkylating agents (signature 11), UV Light (signature 7), and APOBEC (signatures 2 and 13). Color of circles indicates the cluster that tumors belong to; size indicates the number of tumors in this cluster and tumor type; and the y axis indicates the average proportion of mutations attributed to each signature. See also Figure S4 and Table S4.
Figure 4
Figure 4. Clustering Identifies Tumors with Differences in Evolutionary Dynamics and Survival
(A) Histograms with number of single-nucleotide variants (SNVs) by variant allele fraction (VAF) in each of the 8 major clusters (Figure 3). Colors indicate the functional impact of a SNV. (B) VAF versus median cumulative mutation burden plotted for each of the 3 replication repair clusters. C1 tumors exhibit an early burst of mutations (∼0.4 VAF) with a second burst of mutations later in tumor evolution (∼0.2 VAF). C3 tumors display a single burst of mutations ∼0.2 VAF, and C2 tumors exhibit a more gradual accumulation of mutations throughout their evolution. (C) Kaplan-Meier plot of overall survival for tumors with mutational signatures consistent with clusters 1, 2, or 3. Cluster 3, n = 27. Cluster 2, n = 168. Cluster 1, n = 22. p < 0.0001.
Figure 5
Figure 5. Mutational Context in Hypermutant Tumors Determined by Timing and Etiology of Mutation
(A) Left: Average proportion of mutations by trinucleotide context in exomes with known germline status/treatment history. Right: Same, but from panel sequencing. Germline status and treatment history unknown. N indicates the number of tumor samples. (B) Example mutational signatures in exomes from tumors with known germline status/treatment history. (C–F) Examples of subclonal mutational signatures determined from allelic read depth on panel sequencing data. (C) Subclonal mutational signatures in an adult colorectal carcinoma with somatic POLE mutation. (D) Subclonal mutational signatures in a pediatric glioblastoma. (E) Mutational signatures present in subclonal clusters of mutations in a lung adenocarcinoma. (F) Mutational signatures present in 3 subclonal clusters of mutations in skin melanoma. See also Table S5.
Figure 6
Figure 6. Confirmation of Cancer Predisposition Syndrome and Clinical Interventions following Tumor-Only Panel Sequencing
(A) Procedure for diagnosing cancer predisposition syndrome via tumor-only panel sequencing. Sequencing results with high-tumor-mutation burden, a driver mutation in a replication repair gene, and signatures of replication repair deficiency are specific for CMMRD. Clinical interventions include surveillance and immune checkpoint inhibition therapy for active tumors. (B) Left: 15 patients for which only panel sequencing was performed prior to confirmation of predisposition syndrome diagnosis. Blue squares, signatures of MMR and the subsequent identification of a germline mutation in an MMR gene. Orange, same for POLE. Right: Example of a brain tumor found via surveillance. Bottom right: Colorectal cancer responding to anti-PD1 therapy after confirmation of germline MMR mutation. See also Figure S5.

Comment in

References

    1. Akbani R, Akdemir KC, Aksoy BA, Albert M, Ally A, Amin SB, Arachchi H, Arora A, Auman JT, Ayala B, et al. Cancer Genome Atlas Network. Genomic classification classification of cutaneous melanoma. Cell. 2015;161:1681–1696. - PMC - PubMed
    1. Albertson TM, Ogawa M, Bugni JM, Hays LE, Chen Y, Wang Y, Treuting PM, Heddle JA, Goldsby RE, Preston BD. DNA polymerase epsilon and delta proofreading suppress discrete mutator and cancer phenotypes in mice. Proc Natl Acad Sci USA. 2009;106:17101–17104. - PMC - PubMed
    1. Alexandrov LB, Nik-Zainal S, Wedge DC, Aparicio SA, Behjati S, Biankin AV, Bignell GR, Bolli N, Borg A, Børresen-Dale AL, et al. Australian Pancreatic Cancer Genome Initiative; ICGC Breast Cancer Consortium; ICGC MMML-Seq Consortium; ICGC PedBrain. Signatures of mutational processes in human cancer. Nature. 2013;500:415–421. - PMC - PubMed
    1. Amayiri N, Tabori U, Campbell B, Bakry D, Aronson M, Durno C, Rakopoulos P, Malkin D, Qaddoumi I, Musharbash A, et al. BMMRD Consortium. High frequency of mismatch repair deficiency among pediatric high grade gliomas in Jordan. Int J Cancer. 2016;138:380–385. - PubMed
    1. Bouffet E, Larouche V, Campbell BB, Merico D, de Borja R, Aronson M, Durno C, Krueger J, Cabric V, Ramaswamy V, et al. Immune checkpoint inhibition for hypermutant glioblastoma multiforme resulting from germline biallelic mismatch repair deficiency. J Clin Oncol. 2016;34:2206–2211. - PubMed