. 2017 Nov 16;171(5):1029-1041.e21.
doi: 10.1016/j.cell.2017.09.042. Epub 2017 Oct 19.

Universal Patterns of Selection in Cancer and Somatic Tissues

Affiliations

Universal Patterns of Selection in Cancer and Somatic Tissues

Iñigo Martincorena et al. Cell. .

Erratum in

  • Universal Patterns of Selection in Cancer and Somatic Tissues.
    Martincorena I, Raine KM, Gerstung M, Dawson KJ, Haase K, Van Loo P, Davies H, Stratton MR, Campbell PJ. Martincorena I, et al. Cell. 2018 Jun 14;173(7):1823. doi: 10.1016/j.cell.2018.06.001. Cell. 2018. PMID: 29906452 Free PMC article. No abstract available.

Abstract

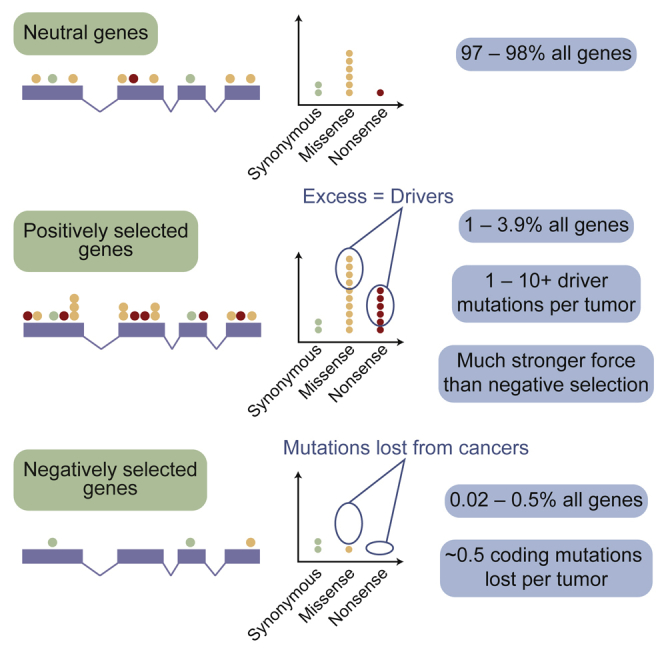
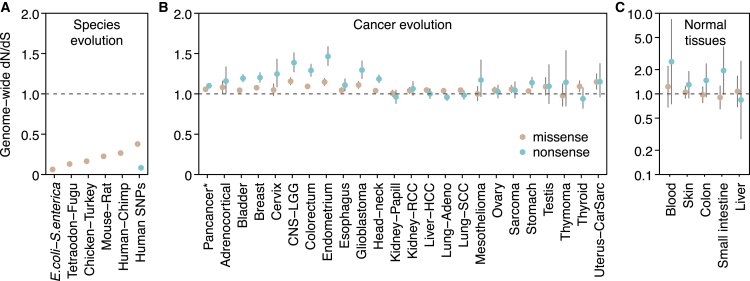
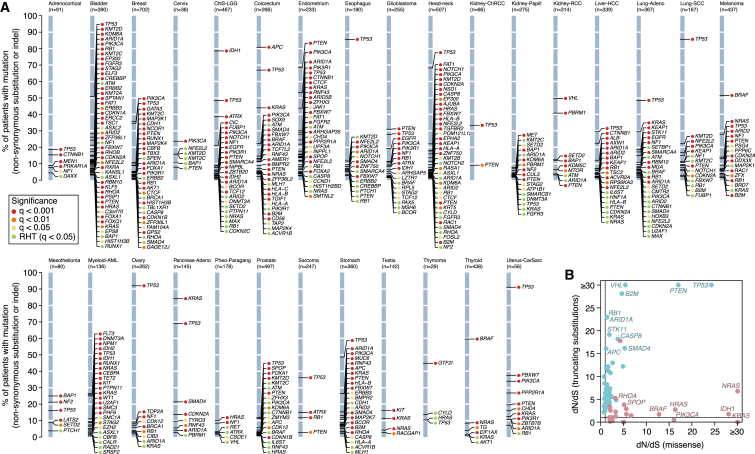
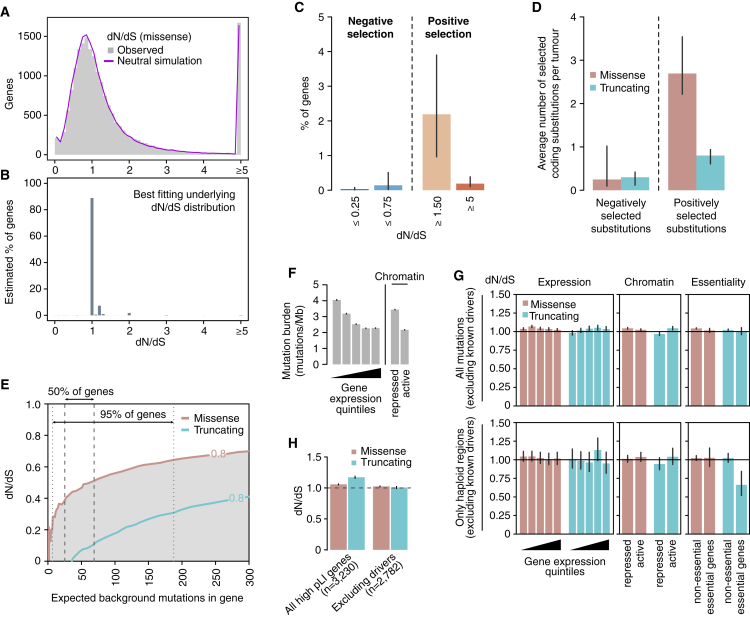
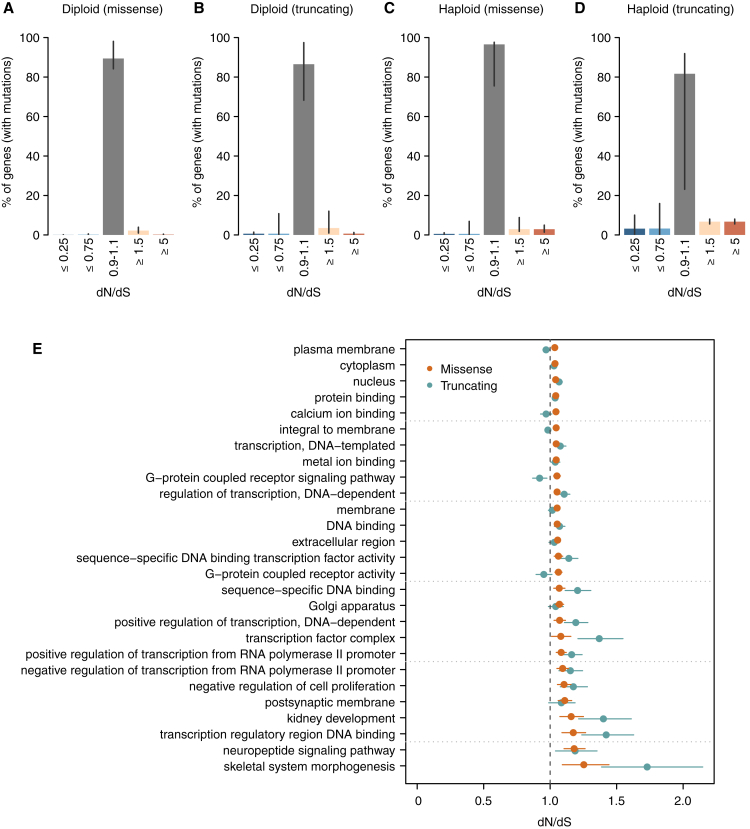
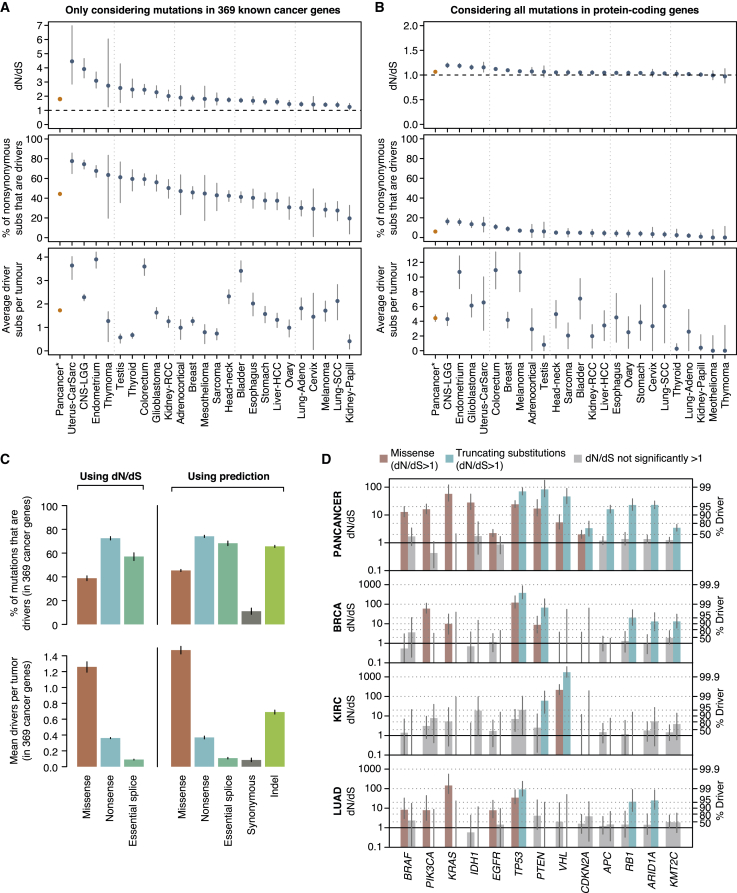
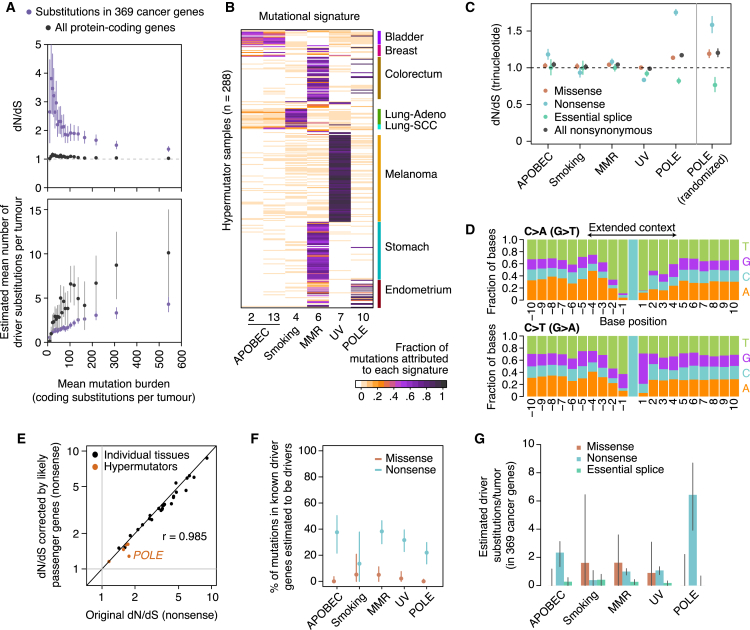
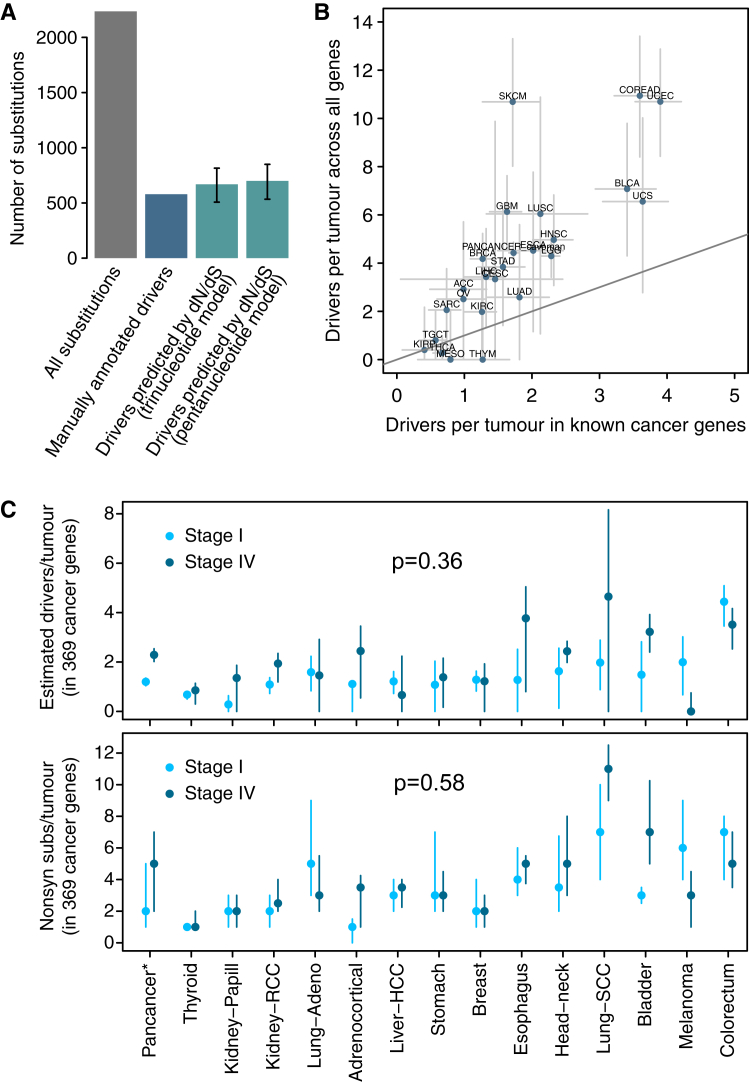
Cancer develops as a result of somatic mutation and clonal selection, but quantitative measures of selection in cancer evolution are lacking. We adapted methods from molecular evolution and applied them to 7,664 tumors across 29 cancer types. Unlike species evolution, positive selection outweighs negative selection during cancer development. On average, <1 coding base substitution/tumor is lost through negative selection, with purifying selection almost absent outside homozygous loss of essential genes. This allows exome-wide enumeration of all driver coding mutations, including outside known cancer genes. On average, tumors carry ∼4 coding substitutions under positive selection, ranging from <1/tumor in thyroid and testicular cancers to >10/tumor in endometrial and colorectal cancers. Half of driver substitutions occur in yet-to-be-discovered cancer genes. With increasing mutation burden, numbers of driver mutations increase, but not linearly. We systematically catalog cancer genes and show that genes vary extensively in what proportion of mutations are drivers versus passengers.

Keywords: cancer; evolution; genomics; mutations; selection.


Figures

None
Graphical abstract
Figure S1
Figure S1
Impact of Different Confounding Factors on Analyses of Selection, Related to Figures 1–5 This includes simplistic substitution models, SNP contamination, SNP filtering and inadequate background models of the variation of the mutation rate. (A) Impact of simplistic mutation models on the accuracy of dN/dS in different scenarios. Each boxplot represents the dN/dS ratios estimated from 100 neutral simulations of 10,000 random coding substitutions. To exemplify the impact on dN/dS of different mutational spectra, we simulated neutral datasets using the trinucleotide spectra observed in the three different cohorts of samples (pancancer, melanoma and lung adenocarcinoma). Different panels depict dN/dS ratios for missense (ωmis) or nonsense (ωnon) mutations. (B) Simulations of the impact on dN/dS of germline SNP contamination and SNP over-filtering in catalogs of somatic mutations. 10 neutral datasets were generated by local randomization of 607 cancer whole-genomes (Alexandrov et al., 2013). Datasets with varying degrees of germline SNP contamination were simulated by adding 5% or 10% of germline common SNPs (minor allele frequency > = 5%) from 1000 genomes phase 3 (Auton et al., 2015) to the neutral simulations. Datasets with varying levels of SNP over-filtering were simulated by removing any mutation from the neutral datasets that overlapped a polymorphic site in dbSNP build 146 (either using common sites or all sites) (Sherry et al., 2001). (C) Percentage of mutations from the public TCGA catalogs of somatic calls that overlap a common dbSNP site. Based on simulations, an overlap of 1%–3% might be expected depending on the dominant mutational signatures present in a dataset, but several public TCGA catalogs show a much higher overlap suggesting extensive germline SNP contamination. As predicted from (B), this leads to an artifactual signal of negative selection in these datasets (STAR Methods). (D) Consistency between genome-wide dN/dS estimates using the trinucleotide and pentanucleotide substitution models across cancer types. Green dots represent genome-wide dN/dS estimates for each cancer type separately, and the orange dot depicts the pancancer estimates (using the 24 cancer types with CaVEMan mutation calls). (E) Corresponding estimates of the average number of driver coding substitutions per tumor. For the purpose of estimating the excess of mutations from dN/dS ratios, dN/dS values below 1 are set to 1. Error bars depict 95% CIs. (F) Simulations demonstrating the validity of estimating dN/dS at a cohort level, in heterogeneous cohorts of samples without patient-specific substitution models. The three scenarios simulated include extreme examples of heterogeneous mixtures of samples with variable signatures, numbers of mutations and selection. In each scenario, the correct fraction of mutations removed by negative selection across samples is shown as a blue horizontal line (right y axis). Estimated dN/dS values from five simulations of each scenario are shown as dots with CIs (left y axis).
Figure S2
Figure S2
Evaluation of the Relative Performance of the Three Different dN/dS Models for the Detection of Positive Selection at Gene Level, Related to Figure 2 (A) QQ-plots for the different dN/dS models on a neutral dataset obtained by randomization of 107 melanoma whole-genomes from ICGC (STAR Methods). The dNdSunif model shows a great inflation of low P-values, leading to a large number of false positives after multiple testing correction (368 genes with q-value < 0.05), and should be generally avoided. In contrast, both dNdSloc and dNdScv behave as expected for a neutral dataset, yielding no significant hits after multiple testing correction. (B) Sensitivity of dNdScv and dNdSloc. The bar plot depicts the number of significant genes (q-value < 0.05) identified by both methods in the 29 TCGA datasets. Bars colored in a lighter shade show the number of significant genes that are present in the Cancer Gene Census version 73 (Forbes et al., 2015). dNdScv shows good specificity and sensitivity under all tested conditions (STAR Methods). (C) Comparison of the number of significant genes found by dNdScv (top) and the indel model (bottom) in their default configuration (unique-sites model for indels) when including and excluding MSI samples. (D–G) Gamma distributions and log-likelihood surfaces of dNdScv on a number of genes and datasets. (D,F) Density functions of the Gamma distributions for substitutions and indels inferred by the negative binomial regression in dNdScv for two datasets (Lung-SCC and Pancancer). The Gamma distributions shown have a mean = 1, showing the spread around the mean observed across genes in each dataset. This reflects the extent of the variation of the mutation rate across genes that remains unexplained by sequence composition, signatures and covariates. (E,G) Log-likelihood ratio values for the number of missense mutations in three genes (PTEN, CDKN2A and MUC16) in the Lung-SCC (n = 167 samples) and Pancancer datasets (n = 7,664) under dNdSloc and dNdScv. The real observed number of missense mutations in each gene and dataset is shown as a vertical green line. The figures show how in small genes and/or small datasets, dNdScv has much narrower curves and much more significant P-values for cancer genes thanks to the Gamma constraint, while dNdScv and dNdSloc converge when the local number of synonymous mutations is sufficiently high. This adaptive behavior of dNdScv results from the joint likelihood equation.
Figure 1
Figure 1
Genome-wide dN/dS Ratios Show a Distinct Pattern of Selection Universally Shared across Cancer Types (A) Species evolution: median dN/dS ratios across genes for missense mutations (data from Martincorena et al. [2012] and Ensembl). Data on germline human SNPs are from the 1,000 genomes phase 3 (Auton et al., 2015), restricted to SNPs with minor allele frequency ≥5%. (B) Cancer evolution: genome-wide dN/dS values for missense and nonsense mutations across 23 cancer types. (C) Somatic mutations in normal tissues (data from Blokzijl et al., 2016, Martincorena et al., 2015, Welch et al., 2012). Error bars depict 95% CIs. See also Figure S1 and Table S1.
Figure 2
Figure 2
Positively Selected Genes (Drivers) in Cancer Genomes (A) List of genes detected under significant positive selection (dN/dS >1) in each of the 29 cancer types. Y axes show the percentage of patients carrying a non-synonymous substitution or an indel in each gene. The color of the dot reflects the significance of each gene. RHT, restricted hypothesis testing on known cancer genes (Table S2). (B) Pancancer dN/dS values for missense and nonsense mutations for genes with significant positive selection on missense mutations (depicted in red) and/or truncating substitutions. See also Figures S1 and S2.
Figure 3
Figure 3
Negative Selection in Cancer (A) Distributions of dN/dS values per gene for missense mutations in non-LOH regions. The real distribution is shown in gray and the distribution observed in a neutral simulation is shown in purple. (B) Underlying distribution of dN/dS values across genes inferred from the observed distribution. (C) Estimated percentage of genes under different levels of positive and negative selection based on the inferred dN/dS distribution in (B). (D) Average number of selected mutations per tumor based on the inferred distributions of dN/dS across genes, combining missense and truncating mutations from all copy number regions. Error bars depict 95% CIs. (E) Power calculation for the statistical detection of negative selection (dN/dS <1) as a function of the extent of selection (dN/dS) and the neutrally-expected number of mutations in a gene in a cohort. Shaded areas under the curves reflect power >80%. Vertical lines indicate the range in which the middle 50% and 95% of genes are in the dataset of 7,664 tumors. (F) Average mutation burden in genes grouped according to gene expression quintile and chromatin state. (G) Average dN/dS values for genes grouped according to gene expression quintile, chromatin state, and essentiality. (H) Average dN/dS values for all mutations in genes found to be haploinsufficient in the human germline, including and excluding putative driver genes. Haploinsufficient genes are defined as those having a pLI score >0.9 in the ExAC database (Lek et al., 2016). See also Figures S1 and S3.
Figure S3
Figure S3
Supplementary Analyses on Negative Selection, Related to Figure 3 (A–D) dN/dS distributions inferred for different mutation types and copy number states. These distributions, obtained as described for Figure 3C, represent the percentage of genes estimated to be under a certain selection regime. The four distributions correspond to: missense (A) and truncating (B) substitutions in regions without loss of heterozygosity, and missense and truncating substitutions in haploid regions (C and D, respectively). Note that (A) is an extension of Figure 3C, with an added middle bar for genes with dN/dS very close to 1 (0.9-1.1), which can be considered to evolve largely neutrally. Only samples with CaVEMan mutation calls, excluding melanoma samples, were considered for this analysis for the reasons explained in the Methods. For each figure, all mutations with the appropriate ploidy were included in the analysis and only genes with at least one mutation (either synonymous or non-synonymous) participate in the fitting of dN/dS distributions. Hence, the percentages of genes shown in the y-axes are relative to the total number of genes with at least one mutation in regions with the ploidy considered in each figure. Error bars depict 95% CIs. (E) Gene ontology groups deviating significantly from neutrality after removing known cancer genes. 27 gene ontology classes are found to be under significant positive selection after comprehensively removing 987 known putative cancer genes. This suggests the presence of undiscovered cancer genes in these functional groups. No gene ontology class was found to be under significant negative selection. Error bars depict 95% CIs.
Figure 4
Figure 4
Average Number of Driver Mutations in Tumors with <500 Coding Mutations (A) Top: Global dN/dS values obtained for 369 known cancer genes (Table S3). This analysis uses a single dN/dS ratio for all non-synonymous substitutions (missense, nonsense, and essential splice site). Middle: Percentage of non-synonymous mutations that are drivers assuming negligible negative selection. Bottom: Average number of driver coding substitutions per tumor. Pancancer refers to the 24 cancer types with in-house mutation calls. (B) Same panels as (A) but including all genes in the genome. (A) and (B) were generated under the pentanucleotide substitution model for maximum accuracy. (C) Percentage (top) and mean absolute number (bottom) of driver mutations per tumor in 369 known cancer genes, using two different approaches: (1) dN/dS, and (2) fitting a Poisson regression model with covariates on putative passenger genes and using this to measure the excess of mutations in known cancer genes. This allows estimating the driver contribution of indels and synonymous mutations. (D) Left y axis: dN/dS values for missense and truncating substitutions for a series of driver genes and for different datasets. Right y axis: Corresponding estimates of the fraction of driver mutations. Grey bars depict dN/dS ratios not significantly different from one. Error bars depict 95% CIs. Generated using all samples with <3,000 coding mutations, as Figure 2. See also Figures S1 and S4.
Figure 5
Figure 5
Selection in Hypermutator Tumors (A) dN/dS and estimated number of driver mutations per tumor grouping samples in 20 equal-sized bins according to mutation burden. This analysis excludes melanoma samples and uses a pentanucleotide substitution model to minimize mutational biases. (B) Heatmap depicting the fraction of mutations in 288 hypermutator samples (>1,000 mutations/exome) attributed to different mutational signatures (Alexandrov et al., 2013). (C) Left: dN/dS ratios (trinucleotide model) for each class of hypermutators. Right: dN/dS ratios from a neutral simulated dataset of POLE mutations. This neutral dataset was generated by randomizing all non-coding substitutions from five POLE hypermutator whole-genomes to a different site with an identical 9-nucleotide context, within 1-megabase of its original position. (D) Stacked bar plot showing the frequency of each base around C > A and C > T substitutions in POLE hypermutator tumors. (E–G) Conservative estimation of the fraction (F) and absolute number (G) of driver coding substitutions in known cancer genes. To obtain these estimates, dN/dS ratios for known cancer genes were normalized by those from putative passenger genes, to conservatively remove mutational biases from dN/dS. Application of this approach to our tissue-specific estimates in Figure 4A yields analogous results (E).
Figure S4
Figure S4
Supplementary Analyses on the Number of Coding Driver Substitutions per Tumor, Related to Figure 4 (A) Comparison of the number of coding driver substitutions estimated by dN/dS and the number estimated by manual annotation of driver mutations across 560 breast cancers. The figure depicts the total number of coding substitutions (gray bar) and the estimated number of driver substitutions in a list of 723 putative cancer genes across 560 breast cancer whole-genomes. A total of 2,786 coding substitutions are found in these genes across the 560 patients (data from Nik-Zainal et al., 2016). Of these, 579 were annotated as likely driver mutations by a careful and conservative manual curation in the original publication (Nik-Zainal et al., 2016) (blue bar). Using the trinucleotide dN/dS model on this dataset, restricted to these 723 genes, yielded a global dN/dS for all non-synonymous substitutions of 1.42 (CI95%: 1.29, 1.58). Reassuringly, this led to an estimated number of drivers consistent with the manual annotation: 668.9 (CI95%: 507.5, 815.3). Error bars depict 95% CIs. (B) Scatterplot of the estimated average number of coding driver substitutions per tumor in 369 known cancer genes and in all genes of the genome. This is a scatterplot representation of the bottom panels of Figures 4A and 4B, to emphasize the extent of coding driver substitutions occurring outside of the list of 369 cancer genes. Error bars depict 95% CIs. Note that the two cancer types whose estimates appear under the diagonal (mesothelioma –MESO- and thymoma –THYM-) have CIs extending above the diagonal, as expected. (C) Number of driver coding substitutions per tumor by clinical stage (see STAR Methods for details and interpretation). The panels compare stage I and stage IV tumors for the datasets with available clinical annotation, using either dN/dS-based estimates of the numbers of drivers per tumor (top panel) or raw counts of non-synonymous mutations in known cancer genes (bottom panel). Briefly, no consistent and statistically significant differences were observed.

Comment in

Similar articles

Cited by

References

    1. Alexandrov L.B., Nik-Zainal S., Wedge D.C., Aparicio S.A., Behjati S., Biankin A.V., Bignell G.R., Bolli N., Borg A., Børresen-Dale A.L., Australian Pancreatic Cancer Genome Initiative. ICGC Breast Cancer Consortium. ICGC MMML-Seq Consortium. ICGC PedBrain Signatures of mutational processes in human cancer. Nature. 2013;500:415–421. - PMC - PubMed
    1. Armitage P., Doll R. The age distribution of cancer and a multi-stage theory of carcinogenesis. Br. J. Cancer. 1954;8:1–12. - PMC - PubMed
    1. Auton A., Brooks L.D., Durbin R.M., Garrison E.P., Kang H.M., Korbel J.O., Marchini J.L., McCarthy S., McVean G.A., Abecasis G.R., 1000 Genomes Project Consortium A global reference for human genetic variation. Nature. 2015;526:68–74. - PMC - PubMed
    1. Beckman R.A., Loeb L.A. Negative clonal selection in tumor evolution. Genetics. 2005;171:2123–2131. - PMC - PubMed
    1. Blokzijl F., de Ligt J., Jager M., Sasselli V., Roerink S., Sasaki N., Huch M., Boymans S., Kuijk E., Prins P. Tissue-specific mutation accumulation in human adult stem cells during life. Nature. 2016;538:260–264. - PMC - PubMed