. 2017 Nov 8;22(5):615-626.e8.
doi: 10.1016/j.chom.2017.09.008. Epub 2017 Oct 19.

A Highly Pathogenic Avian H7N9 Influenza Virus Isolated from A Human Is Lethal in Some Ferrets Infected via Respiratory Droplets

Affiliations

A Highly Pathogenic Avian H7N9 Influenza Virus Isolated from A Human Is Lethal in Some Ferrets Infected via Respiratory Droplets

Masaki Imai et al. Cell Host Microbe. .

Abstract

Low pathogenic H7N9 influenza viruses have recently evolved to become highly pathogenic, raising concerns of a pandemic, particularly if these viruses acquire efficient human-to-human transmissibility. We compared a low pathogenic H7N9 virus with a highly pathogenic isolate, and two of its variants that represent neuraminidase inhibitor-sensitive and -resistant subpopulations detected within the isolate. The highly pathogenic H7N9 viruses replicated efficiently in mice, ferrets, and/or nonhuman primates, and were more pathogenic in mice and ferrets than the low pathogenic H7N9 virus, with the exception of the neuraminidase inhibitor-resistant virus, which showed mild-to-moderate attenuation. All viruses transmitted among ferrets via respiratory droplets, and the neuraminidase-sensitive variant killed several of the infected and exposed animals. Neuraminidase inhibitors showed limited effectiveness against these viruses in vivo, but the viruses were susceptible to a polymerase inhibitor. These results suggest that the highly pathogenic H7N9 virus has pandemic potential and should be closely monitored.

Keywords: antiviral sensitivity; ferrets; highly pathogenic avian influenza H7N9 viruses; mice; nonhuman primates; pathogenicity; receptor-binding specificity; replication capacity; transmissibility.


Figures

Figure 1
Figure 1. Growth kinetics of viruses in differentiated NHBE cells
NHBE cells were infected with GD/3 (blue), rGD/3-NA294R (red), rGD/3-NA294K (green), or Anhui/1 (gray) at an MOI of 0.001. The supernatants of the infected cells were harvested at the indicated times, and virus titers were determined by means of plaque assays in MDCK cells. Error bars indicate standard deviations from three independent experiments. The lower limit of detection is indicated by the horizontal dashed line.
Figure 2
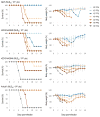
Figure 2. Virulence in mice
Four mice per group were intranasally inoculated with 100, 101, 102, 103, 104, 105, or 106 PFU of GD/3, rGD/3-NA294R, rGD/3-NA294K, or Anhui/1. Survival (left panels) and body weight (right panels) were monitored daily. The values for body weights are means ± SD from live mice. See also Table S2.
Figure 3
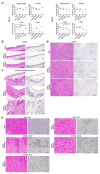
Figure 3. Virus replication and pathological findings in infected ferrets
(A) Ferrets were infected intranasally with 106 PFU of virus. Three ferrets per group were euthanized on days 3 and 6 after infection for virus titration. Virus titers in nasal turbinates, trachea, lung, and brain were determined by use of a plaque assay on MDCK cells. Horizontal bars show the mean (n = 3). Asterisks indicate significant differences in virus titers between compared viruses (*, p < 0.05; **, p < 0.01). (B–E) Shown are representative pathological findings in the (B) tracheae, (C) bronchus and bronchial glands, (D) lungs, (E) olfactory bulb, (E) brain stem, and (E) cerebral cortex of ferrets infected with the indicated viruses at 6 days post-infection with hematoxylin and eosin (HE) staining (left panels) or with immunohistochemistry for influenza viral antigen detection (right panels). Scale bars, 50 μm (trachea, olfactory bulb, brain stem, cerebral cortex), 100 μm (bronchus and bronchial glands, lung). See also Table S3.
Figure 4
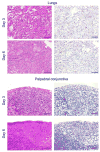
Figure 4. Histopathological examination of the lungs and palpebral conjunctiva of infected cynomolgus macaques
Representative pathological images of GD/3-infected lungs and palpebral conjunctiva on days 3 and 6 after infection. Left panels, HE staining. Right panels, immunohistochemistry for influenza viral antigen detection. Scale bars, 100 μm (lungs), 50 μm (palpebral conjunctiva). See also Figure S1 and Tables S4 and S5.
Figure 5
Figure 5. Respiratory droplet transmission among ferrets and postmortem histopathological examination of brain and respiratory organs from ferrets that died during the transmission study
(A) Ferrets were infected with 5 × 10⁵ PFU of GD/3, rGD/3-NA294R, rGD/3-NA294K, Anhui/1, or CA04 (inoculated ferrets). One day later, four or two naïve ferrets (exposed ferrets) were each placed in a cage adjacent to an infected ferret. Nasal washes were collected from infected ferrets on day 1 after inoculation and from exposed ferrets on day 1 after co-housing, and then every other day (for up to 15 days) for virus titration. (B) Histopathological lesions in the thalamus, brain stem, and cerebellum of ferrets (#10) that died on day 9 after exposure to rGD/3-NA294R. Scale bars, 50 μm. (C) Histopathological lesions in the tracheae, bronchus, and lungs of ferrets (#12) that died on day 6 after exposure to rGD/3-NA294R. Scale bars, 50 μm (Trachea), 100 μm (Bronchus, Lung). Left panels, HE staining. Right panels, immunohistochemistry for influenza viral antigen detection. See also Figure S2 and Tables S1, S6, and S7.
Figure 6
Figure 6. Virus binding to human and avian receptors
(A) The receptor specificities of two recombinant viruses possessing H7N9 virus HAs (GD/3 and Anhui/1) were compared with a representative human (K173) isolate by using a glycan microarray containing a diverse library of α2–3 and α2–6 sialosides. Viruses were applied at 128–256 hemagglutination units/ml for 1 h, and after washing, viruses were detected with monoclonal anti-H7 mouse IgG (for H7N9 viruses) or anti-H1 mouse IgG (for the human K173 virus) and Alexa Fluor-488-labeled anti-mouse IgG secondary antibodies. Error bars represent the standard deviation calculated from 6 replicate spots of each glycan. A complete list of glycans is provided in Table S8. (B) Virus binding to α2,3 and α2,6-linked glycans was determined by biolayer Interferometry. Streptavidin biosensors were immobilized with α2,3-linked (3SLN) or α2,6-linked (6SLN, 6SLNLN, and 6SLNLNLN) sialylglycan receptors and reacted with replication-incompetent virus in the presence of NA inhibitors for 4,000 seconds at 30°C. Blue squares, N-acetylglucosamine; yellow circles, galactose; purple diamonds, sialic acid.
Figure 7
Figure 7. Virus sensitivity to antivirals in mice
Six mice per group were intranasally inoculated with 103 PFU (50 μl) of GD/3, rGD/3-NA294R, rGD/3-NA294K, or Anhui/1. At 2 h after infection, mice were treated with the antiviral compounds shown. (A) Treatment of infected mice with laninamivir (administered once) compared with oseltamivir or favipiravir (administered daily). Mice were treated with: (1) 40 mg per kg per 200 μl of oseltamivir phosphate orally twice daily for 5 days after infection; (2) 60 or 150 mg per kg per 200 μl of favipiravir orally twice daily for 5 days after infection; or (3) 0.75 mg per kg per 50 μl of laninamivir intranasally once on the day of infection. (B) Comparison of the efficacy of daily-administered zaninamivir with that of favipiravir. Mice were treated with: (1) 8 mg per kg per 50 μl of zanamivir intranasally once daily for 5 days after infection; (2) 60 or 150 mg per kg per 200 μl of favipiravir orally twice daily for 5 days after infection. Saline (50 μl) or methylcellulose (200 μl) served as controls for intranasal or oral treatment, respectively. The detailed experimental design is shown in Figure S3. Body weights were monitored daily (left panels). For virological examinations, three mice per group were euthanized at 3 and 6 days post-infection and the virus titers in the lungs were determined by means of plaque assays in MDCK cells (right panels). Statistically significant differences between virus titers of control mice and those of mice treated with antiviral drugs were determined by using one-way ANOVA, followed by Dunnett’s test (*P < 0.05). Error bars denote standard deviations. See also Tables S9 and S10.

References

    1. Baranovich T, Webster RG, Govorkova EA. Fitness of neuraminidase inhibitor-resistant influenza A viruses. Curr Opin Virol. 2011;1:574–581. - PMC - PubMed
    1. Belser JA, Gustin KM, Pearce MB, Maines TR, Zeng H, Pappas C, Sun X, Carney PJ, Villanueva JM, Stevens J, et al. Pathogenesis and transmission of avian influenza A (H7N9) virus in ferrets and mice. Nature. 2013;501:556–559. - PMC - PubMed
    1. Chen LM, Blixt O, Stevens J, Lipatov AS, Davis CT, Collins BE, Cox NJ, Paulson JC, Donis RO. In vitro evolution of H5N1 avian influenza virus toward human-type receptor specificity. Virology. 2012;422:105–113. - PMC - PubMed
    1. Dortmans JC, Dekkers J, Wickramasinghe IN, Verheije MH, Rottier PJ, van Kuppeveld FJ, de Vries E, de Haan CA. Adaptation of novel H7N9 influenza A virus to human receptors. Sci Rep. 2013;3:3058. - PMC - PubMed
    1. Furuse Y, Suzuki A, Kamigaki T, Oshitani H. Evolution of the M gene of the influenza A virus in different host species: large-scale sequence analysis. Virol J. 2009;6:67. - PMC - PubMed

MeSH terms