. 2018 Jan;28(1):90-110.
doi: 10.1038/cr.2017.128. Epub 2017 Oct 20.

PRRT2 deficiency induces paroxysmal kinesigenic dyskinesia by regulating synaptic transmission in cerebellum

Affiliations

PRRT2 deficiency induces paroxysmal kinesigenic dyskinesia by regulating synaptic transmission in cerebellum

Guo-He Tan et al. Cell Res. 2018 Jan.

Abstract

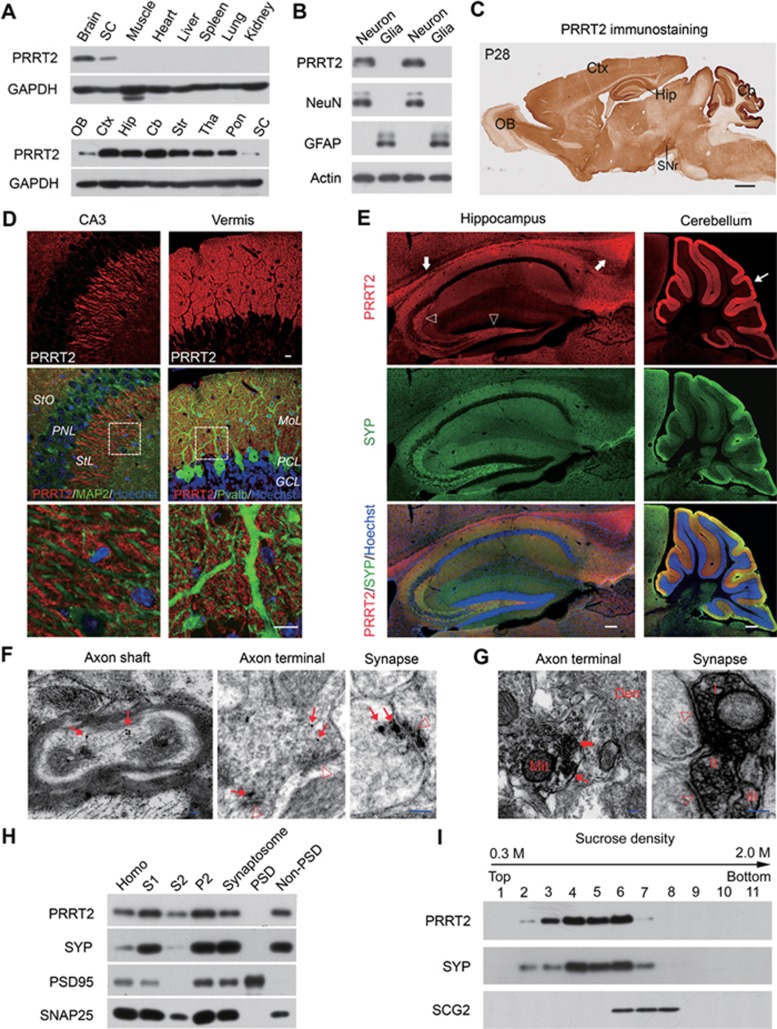
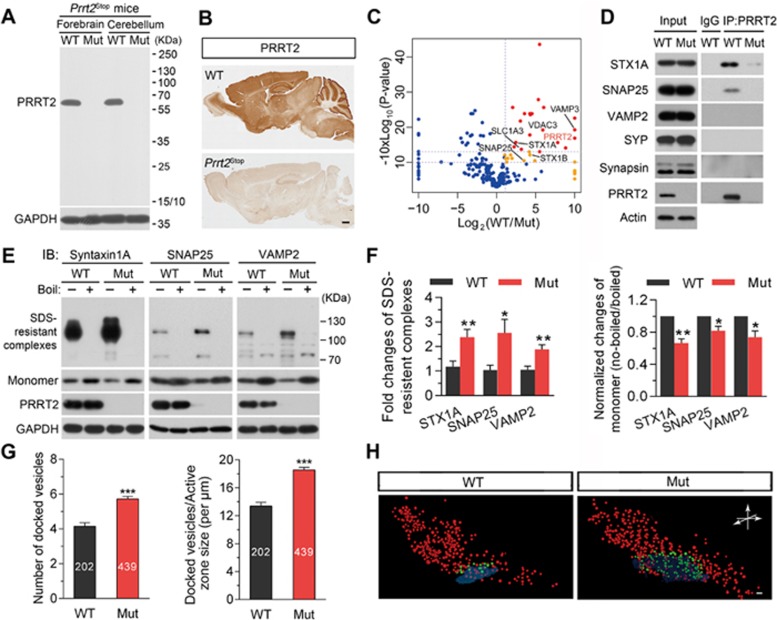
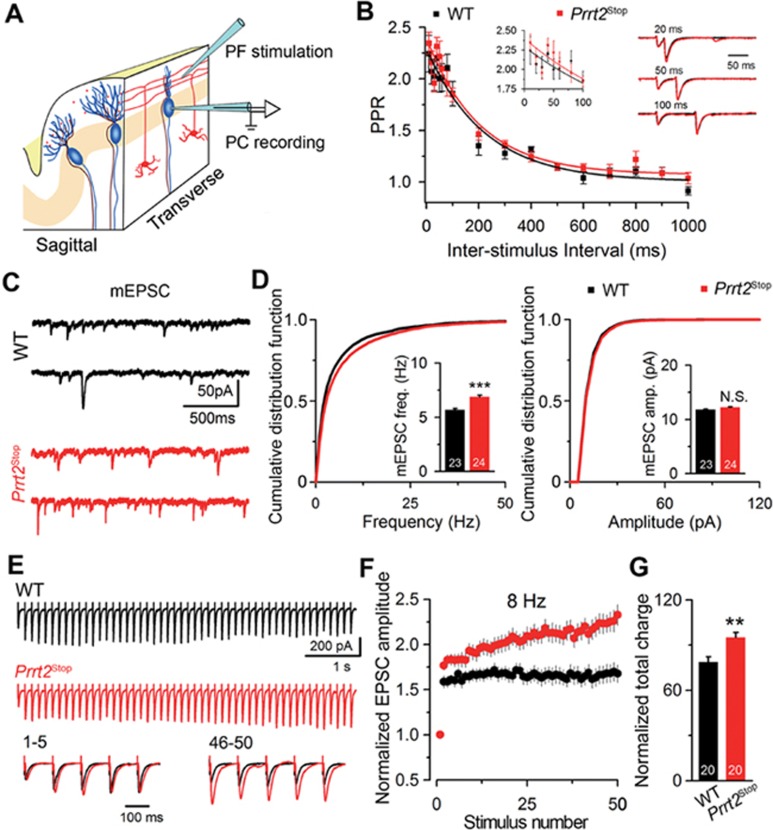
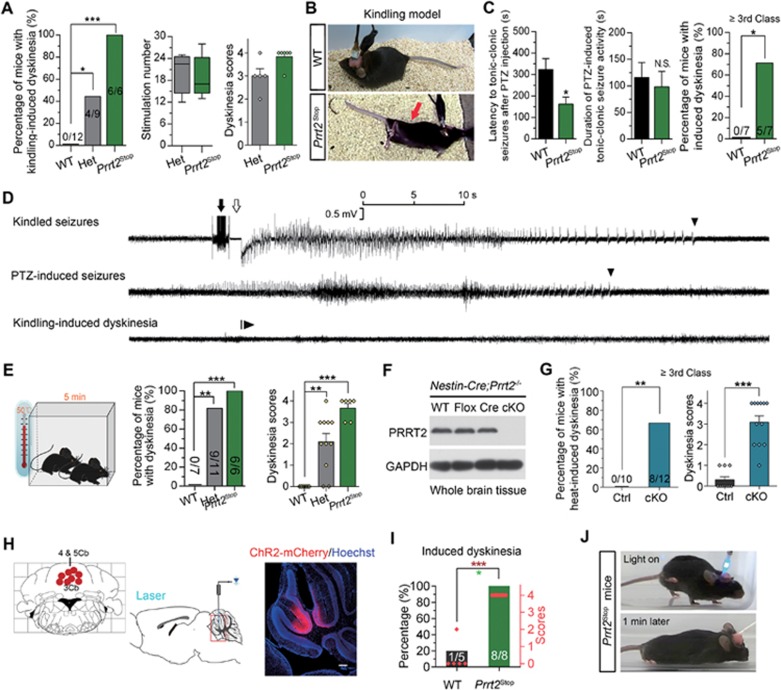
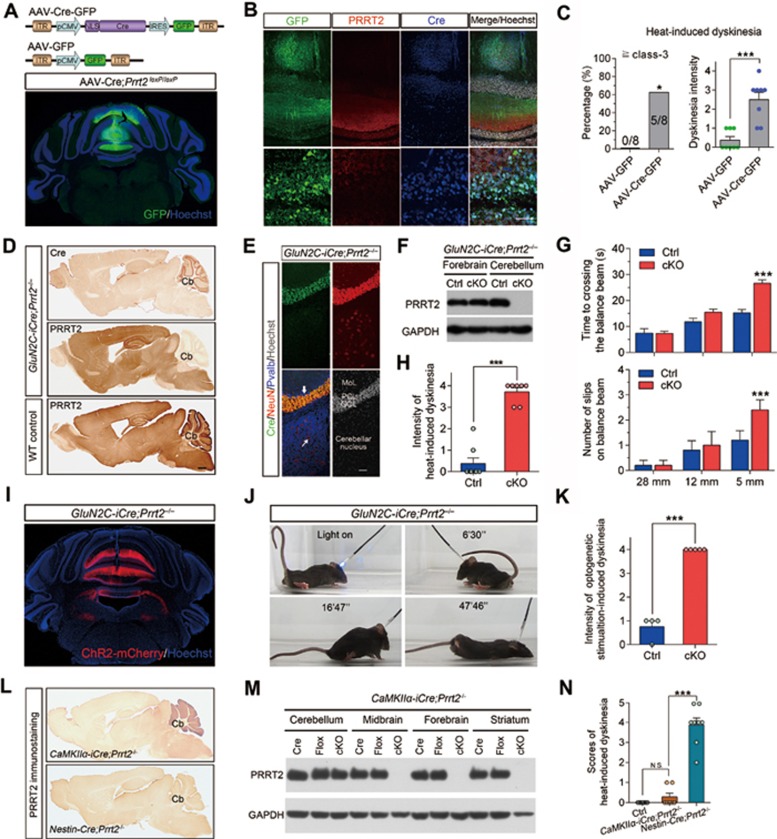
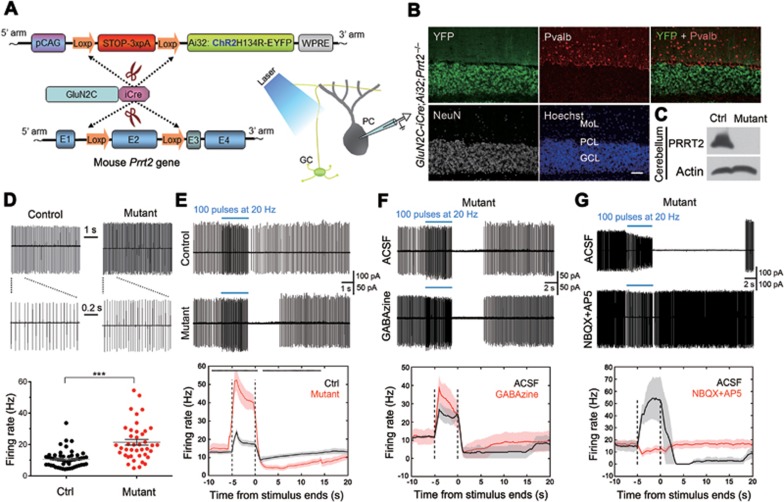
Mutations in the proline-rich transmembrane protein 2 (PRRT2) are associated with paroxysmal kinesigenic dyskinesia (PKD) and several other paroxysmal neurological diseases, but the PRRT2 function and pathogenic mechanisms remain largely obscure. Here we show that PRRT2 is a presynaptic protein that interacts with components of the SNARE complex and downregulates its formation. Loss-of-function mutant mice showed PKD-like phenotypes triggered by generalized seizures, hyperthermia, or optogenetic stimulation of the cerebellum. Mutant mice with specific PRRT2 deletion in cerebellar granule cells (GCs) recapitulate the behavioral phenotypes seen in Prrt2-null mice. Furthermore, recording made in cerebellar slices showed that optogenetic stimulation of GCs results in transient elevation followed by suppression of Purkinje cell firing. The anticonvulsant drug carbamazepine used in PKD treatment also relieved PKD-like behaviors in mutant mice. Together, our findings identify PRRT2 as a novel regulator of the SNARE complex and provide a circuit mechanism underlying the PRRT2-related behaviors.


Figures

Figure 1
Figure 1
Expression pattern and subcellular localization of PRRT2 in mouse brain. (A) Western blotting showing PRRT2 in the nervous system of adult mouse. GAPDH served as an internal control. (B) Western blotting showing the expression of PRRT2 in cultured primary neuronal rather than glial cells. NeuN was used as a marker for neurons, while GFAP was for glia cells. (C) Representative IHC images of PRRT2 in P28 mouse brain. Scale bar, 800 μm. (D) Expression of PRRT2 in mouse brain. MAP2 and Pvalb were used to mark the neuronal dendrites. Boxed areas are showed in high magnification below. Scale bar, 15 μm. (E) Co-immunostaining for PRRT2 and presynaptic protein SYP on brain slices. Marked was the intensive expression of PRRT2 in corpus callosum (arrows) in the hippocampal mossy fibers (hollow arrowhead) and the robust expression of PRRT2 in cerebellar molecular layers (thin arrow). Scale bar, 200 μm. (F) Immunogold labeling of PRRT2 in neuronal axons and axon terminals. Arrows, PRRT2-positive gold particles; hollow arrowhead, postsynaptic density. Scale bar, 50 nm. (G) Pre-embedding immunoperoxidase staining showed that PRRT2 expression was associated with synaptic vesicles in axonal terminals and synapses of the sections that was not counterstained. Thick arrow, labeled small vesicles; thin arrow, labeled presynaptic membrane; hollow arrowheads, postsynaptic density. Roman numerals (I-III) indicate three labeled presynaptic terminals, respectively. Note that there is no labeled signal in postsynaptic membrane and structures. Scale bar, 100 nm. (H) Immunoblots of isolated fractions from P30 mouse brain lysates show that PRRT2 did not exist in postsynaptic density. SYP, SNAP25 and PSD95 were used as protein markers to validate different ultrasynaptic compartments. Homo, total brain lysates. (I) Immunoblots of equal volume aliquots of the supernatant fractions from mouse brain showed that PRRT2 was present mainly in SYP-containing fractions of small synaptic vesicles. Cb, cerebellum; Ctx, cerebral cortex; Den, dendritic shaft; GCL, granule cell layer; Hip, hippocampus; Mit, mitochondrion; MoL, molecular layer; OB, olfactory bulb; PCL, Purkinje cell layer; Pon, pons; PNL, pyramidal neuronal layer; SC, spinal cord; SNr, substantial nigra; StL, strata lucidum; StO, strata oriens; Str, striatum; Tha, thalamus.
Figure 2
Figure 2
PRRT2 regulates SNARE complex formation and vesicle docking. (A) Western blotting did not detect any truncated PRRT2 protein in homozygous Prrt2Stop mouse brains. The mutant mice have incorporation of two stop codons into their endogenous Prrt2 gene to mimic the hotspot nonsense mutation at C649 site of human PRRT2 gene in PKD patients. (B) IHC showed that PRRT2 protein is absent in the brain of a Prrt2Stop mutant mouse. Scale bar, 300 μm. (C) Proteomic analysis of PRRT2-interacting proteins using brain lysates from Prrt2Stop mutants and the WT littermates. Dots: blue, non-specific binders; yellow, medium confident binders; red, highly confident binders. (D) Co-IP analysis using mouse brain tissue lysates showed that PRRT2 interacts with STX1A and SNAP25. (E, F) PRRT2 deficiency resulted in increased formation of SNARE complex within synaptosomes. E, representative immunoblots; F, quantification of western blot results. Error bars, mean ± SEM. n = 5 per group; *P< 0.05 and **P< 0.01 vs WT; Student's t-test. (G) Analysis of vesicle counts in excitatory synapses in cerebellar molecular layer showed significant increase in the number of docked vesicles in mutant mice. Error bars, mean ± SEM. n = 202 synapses from 4 WT mice and n = 439 synapses from 4 mutant mice. ***P < 0.001 vs WT; Student's t-test. (H) Partial reconstruction of synapses from electron tomography data showed 3D distributions of vesicles in typical asymmetric synapses of cerebellar molecular layer from Prrt2-mutant and WT mice. Docked vesicles were labeled in green while others in red. Scale bar, 50 nm. Mut, mutant; WT, wild-type.
Figure 3
Figure 3
PRRT2 deficiency increased short-term facilitation of PF-PC synapses in cerebellum. (A) Illustration of the electrophysiological recording configuration. Electrical stimulation was delivered onto GC-derived PFs and whole-cell voltage-clamp recording was performed on the somata of PCs. (B) PPR at intervals from 10 to 1 000 ms in Prrt2Stop mice and WT littermates. Mono-exponential fits to the data were shown as solid lines. Left inset shows PPR values at very short ISIs (10-100 ms) on an expanded timescale. Right inset shows examples of paired-pulse traces at 20, 50, 100 ms intervals, scaled to the first EPSC in the pair for each interval. Error bars, mean ± SEM. WT, n = 7; mutant, n = 6. (C) Representative recording of mEPSCs in cerebellar slices from Prrt2Stop mice and their WT littermates. (D) Cumulative frequency or amplitude distribution curves of mEPSCs calculated for WT (black) and Prrt2Stop (red) mice. The sample size is indicated in the bottom of each bar. All cumulative curves and mean values were obtained from 200 events recorded from each cell. WT, n = 23; mutant, n = 24. Error bars, mean ± SEM. *P< 0.05 and ***P< 0.001 vs WT; Student's t-test. (E) Representative traces of PF-EPSCs evoked by a stimulus train of 50 pulses at 8 Hz in WT (black) and Prrt2Stop (red) mice. Bottom, the traces of the 1st-5th(left) and 46th-50th (right) PF-EPSCs were peak scaled to the amplitude of the 1st EPSCs. (F) Normalized plot of EPSC amplitudes of each spike during trains of stimulations at 8 Hz. X-axis, stimulation numbers. WT, black; mutant, red. n = 20 per group. (G) Total charge transferred (normalized to that of the 1st EPSC) during the trains of 50 pulses at 8 Hz. Error bars, mean ± SEM. **P< 0.01 vs WT; Student's t-test. The sample size is indicated in the bottom of each column. NS, not significant; PC, Purkinje cells; PF, parallel fibers; PPR, paired-pulse ratio.
Figure 4
Figure 4
Induced dyskinesia in Prrt2-deficient mice. (A) Prrt2Stop mice manifested profound paroxysmal dyskinesia after kindling-induced generalized seizures. Left panel, incidence of generalized seizure-induced dyskinesia; the number of mice in each group is shown in the columns. Middle panel, box-and-whisker plot shows the range of stimulations required to evoke the seizure-induced dyskinesia in mutant mice. Right panel, dyskinesia scores of mutant mice after kindling-induced seizure activity; individual symbols indicate all the cases in each group. *P< 0.05 and ***P < 0.001 vs WT; Fisher's exact test. (B) Representative images of dyskinesia attack in a Prrt2Stop mouse in kindling model. Arrow indicates a rigor and hunched posture. (C) Paroxysmal dyskinesia triggered by PTZ-induced generalized seizures in Prrt2Stop mice. Cases are indicated in the column of each group. *P < 0.05 vs WT; Fisher's exact test. (D) Representative EEG recordings of Prrt2Stop mice during kindled seizures (top), PTZ-evoked seizures (middle) and induced dyskinesia (bottom). Filled arrow, application of electrical stimulation in kindling; open arrow, post-stimulation refractory period; arrowheads, termination point of electrographic seizures. Note there were no obvious abnormalities in EEG recordings during occurrence of induced dyskinesia. (E) 5-min exposure to 50 °C ambient temperature induced paroxysmal dyskinesia in Prrt2Stop mice. **P < 0.01 and ***P < 0.001 vs WT; middle panel, Fisher's exact test; right panel, one-way ANOVA with post hoc Dunnett's test. (F, G) Exposure to 50 °C for 5 min induced dyskinesia in Nestin-Cre;Prrt2−/− mice. Individual symbols indicate all the cases in each group. Nestin-Cre and Prrt2loxP/loxP littermates expressing PRRT2 normally were pooled as controls. *P < 0.05, **P < 0.01 and ***P < 0.001 vs control littermates; Fisher's exact test or Student's t-test. (H) Schematic diagram (left and middle) and representative image of ChR2-mCherry expression (right) for optogenetic manipulation in Prrt2Stop mice. Distribution of the actually implanted sites was indicated using red bulb individually. (I) Optical stimulation in cerebellar vermis sufficiently induced intensive paroxysmal dyskinesia in Prrt2Stop mice, but not in WT mice. Individual symbols indicate all the cases in each group. *P < 0.05 and ***P < 0.001 vs WT; Student's t-test. (J) Representative images of optogenetic stimulation-induced dyskinesia in Prrt2Stop mice. Het, heterozygote.
Figure 5
Figure 5
Cerebellum is a key area mediating PRRT2-related dyskinesia. (A) Schematic diagrams of AAV construct (upper panel) and representative image of AAV injection into the vermis of cerebellum in Prrt2loxP/loxP mice (lower panel). (B) Immunostaining results showing that AAV-mediated Cre expression ablated PRRT2 protein in the infected neurons. Scale bar, 50 μm. (C) Incidence and scores of paroxysmal dyskinesia in AAV-Cre;Prrt2−/− and control mice after exposure to 50 °C ambient temperature. Numbers (upper panel) or symbols (lower panel) in the column indicate the cases in each group. *P < 0.05 and ***P < 0.001 vs GFP controls; upper panel, Fisher's exact test; lower panel, Student's t-test. (D) Generation of GluN2C-iCre;Prrt2−/− mice in which PRRT2 was ablated selectively in cerebellar GCs revealed by IHC staining. Shown are two neighboring sagittal sections of the homozygote brain stained for Cre and PRRT2, respectively. (E) Multiple-label immunostaining showed specific Cre expression in GluN2C-iCre;Prrt2−/− mouse cerebellum. Arrow indicates a typical Purkinje cell that did not express Cre. Thin arrow indicates a neuron in deep nucleus of cerebellum without Cre expression. Scale bar, 100 μm. (F) Western blot analysis of PRRT2 expression in brains from GluN2C-iCre;Prrt2−/− mice and the control littermates. (G) Analysis of GluN2C-iCre;Prrt2−/− mice in beam balance tests. GluN2C-iCre and Prrt2loxP/loxP littermates carrying both alleles of Prrt2 gene were pooled as controls. WT, n = 17; mutant, n = 14. Error bars, mean ± SEM. ***P < 0.001 vs control; two-way ANOVA with post hoc Bonferroni's test. (H) Incidence and scores of heat-induced paroxysmal dyskinesia of GluN2C-iCre;Prrt2−/− mice. Numbers (left panel) or symbols (right panel) in the column indicate the cases in each group. **P< 0.01 and ***P< 0.001 vs control; Fisher's exact test or Student's t-test. (I) Representative images of ChR2-mCherry expression in GluN2C-iCre;Prrt2−/− mouse cerebellum after AAV injection. (J) Representative images of optogenetic stimulation-induced dyskinesia in a GluN2C-iCre;Prrt2−/− mouse at the indicated time points. (K) Statistical analysis of scores of optogenetic stimulation-induced dyskinesia in GluN2C-iCre;Prrt2−/− mice. Individual symbols indicate all the cases in each group. Error bars, mean ± SEM. *P < 0.05 vs control; Student's t-test. (L) Generation of CaMKIIα-iCre;Prrt2−/− mice. IHC results showed normal expression of PRRT2 in the cerebellum of CaMKIIα-iCre;Prrt2−/− mice. Brain sections from Nestin-Cre;Prrt2−/− mice were used as the control. (M) Western blot analysis of PRRT2 expression in distinct brain regions of both CaMKIIα-iCre;Prrt2−/− mice and their littermate controls. (N) Heat-induced dyskinesia scores of CaMKIIα-iCre;Prrt2−/− mice. Individual symbols indicate all the cases in each group. Both Nestin-Cre;Prrt2−/− and WT mice were used as controls.
Figure 6
Figure 6
Abnormal PC firing of Prrt2-deficient mice. (A) Schematic diagrams for the generation of GluN2C-iCre;Ai32;Prrt2−/− mice. (B) IHC results showed specific expression of the ChR2-YFP fusion proteins in all GCs (white) in cerebellar cortex, but not in Pvalb-positive PCs and other GABAergic interneurons (red). Scale bar, 400 μm. (C) Western blotting shows complete depletion of PRRT2 protein in GluN2C-iCre;Ai32;Prrt2−/− mouse cerebellum (−/−). GluN2C-iCre;Ai32;Prrt2+/+ mice were used as the control (+/+). (D) Spontaneous firing activity recorded from PCs on GluN2C-iCre;Ai32;Prrt2+/+ and GluN2C-iCre;Ai32;Prrt2−/− mouse cerebellar slices. Upper: representative traces. The first 1-s segments indicated by lines in the upper panels are shown at higher magnification below. Lower: statistical analysis of average firing rate. Each mark in the scatter plots represents individual average firing properties. Bars indicate mean ± SEM. (E) Spontaneous firing activity of PCs after optogenetic stimulation (blue bar). Upper: representative traces. Lower: summary of spontaneous firing frequency. Black, n = 40 cells from 8 GluN2C-iCre;Ai32;Prrt2+/+ mice. Red, n = 30 cells from 7 GluN2C-iCre;Ai32;Prrt2−/− mice. Black asterisks on the top indicate statistical significance at individual time points. (F) Cell-attached recording of PCs in the absence or presence of GABAa receptor blocker GABAzine. (G) Effect of glutamate receptor blocker NBQX and AP5 on PC firing activity after optogenetic stimulation.

Comment in

References

    1. Bhatia KP. Paroxysmal dyskinesias. Mov Disord 2011; 26:1157–1165. - PubMed
    1. Ebrahimi-Fakhari D, Saffari A, Westenberger A, Klein C. The evolving spectrum of PRRT2-associated paroxysmal diseases. Brain 2015; 138:3476–3495 - PubMed
    1. Chen WJ, Lin Y, Xiong ZQ, et al. Exome sequencing identifies truncating mutations in PRRT2 that cause paroxysmal kinesigenic dyskinesia. Nat Genet 2011; 43:1252–1255. - PubMed
    1. Meneret A, Gaudebout C, Riant F, et al. PRRT2 mutations and paroxysmal disorders. Eur J Neurol 2013; 20:872–878. - PubMed
    1. Schubert J, Paravidino R, Becker F, et al. PRRT2 mutations are the major cause of benign familial infantile seizures. Hum Mutat 2012; 33:1439–1443. - PubMed

Publication types

Supplementary concepts