. 2017 Oct 18;3(10):e1700419.
doi: 10.1126/sciadv.1700419. eCollection 2017 Oct.

Abundance and local-scale processes contribute to multi-phyla gradients in global marine diversity

Affiliations

Abundance and local-scale processes contribute to multi-phyla gradients in global marine diversity

Graham J Edgar et al. Sci Adv. .

Abstract

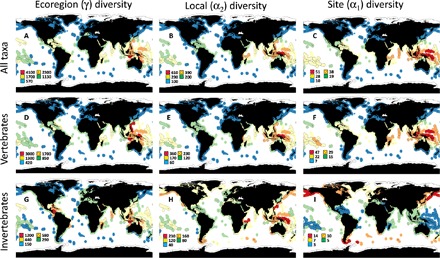
Among the most enduring ecological challenges is an integrated theory explaining the latitudinal biodiversity gradient, including discrepancies observed at different spatial scales. Analysis of Reef Life Survey data for 4127 marine species at 2406 coral and rocky sites worldwide confirms that the total ecoregion richness peaks in low latitudes, near +15°N and -15°S. However, although richness at survey sites is maximal near the equator for vertebrates, it peaks at high latitudes for large mobile invertebrates. Site richness for different groups is dependent on abundance, which is in turn correlated with temperature for fishes and nutrients for macroinvertebrates. We suggest that temperature-mediated fish predation and herbivory have constrained mobile macroinvertebrate diversity at the site scale across the tropics. Conversely, at the ecoregion scale, richness responds positively to coral reef area, highlighting potentially huge global biodiversity losses with coral decline. Improved conservation outcomes require management frameworks, informed by hierarchical monitoring, that cover differing site- and regional-scale processes across diverse taxa, including attention to invertebrate species, which appear disproportionately threatened by warming seas.


Figures

Fig. 1
Fig. 1. Patterns of global marine diversity.
Geographical distribution of ecoregion richness (species richness per ecoregion), local richness (rarefied estimates of total richness for sites <12 km from each other), and site richness (mean species richness per transect) for vertebrates, invertebrates, and all taxa. Legends indicate upper bounds for species richness bins. Ecoregion totals are predictively modeled using random forest procedures, with data trained using observed data from 82 ecoregions and 16 environmental covariates for which data were globally available.
Fig. 2
Fig. 2. Global patterns of site richness per 50-m transect for 10 investigated marine animal classes.
Data are smoothed using random forest predictions. Crustacea includes only species in orders Decapoda and Stomatopoda because other orders did not surpass the 2.5-cm minimum size requirement. Legends indicate the upper bounds for species richness bins.
Fig. 3
Fig. 3. Latitudinal trends in abundance and richness.
Bivariate plots relating ecoregion richness (A to C), local richness (D to F), site richness (G to I), and site abundance (J to L) to absolute latitude for all taxa, vertebrates, and invertebrates. Latitude was calculated as the mean latitude of sites investigated within ecoregion. Abundance y axes are shown as log scale. Best-fit polynomial curves to the third order were assessed using Bayesian information criterion (BIC) and R2 values; order of polynomial is shown in parentheses.
Fig. 4
Fig. 4. Most likely causal network showing hypothesized links between environmental drivers and diversity across scales.
Width of arrows indicates the magnitude of standardized linear coefficients in SEMs. Black arrows are positive coefficients, and red arrows are negative coefficients. Dashed arrow between local and ecoregion richness for all taxa indicates a link at the margins of significance (P = 0.066), albeit with a moderately high linear coefficient value (2.1). Model fit is good in all cases, indicated by nonsignificant χ2 values.
Fig. 5
Fig. 5. Proposed model of global marine diversity.
At the site scale, temperature and nutrients influence abundance, which affects site richness, which in turn strongly influences local richness. Fishes control abundances of large mobile invertebrates through predation, generating a negative relationship between vertebrate and invertebrate richness at the site scale. At the ecoregion scale, species richness is influenced by local richness, the extent of coral reef, and biogeographic factors. [Top and bottom photos by G.J.E. and middle photo by R.D.S.-S. (University of Tasmania)].

References

    1. A. von Humboldt, A. Bonpland, Personal Narrative of Travels to the Equinoctial Regions of America: During the Years 1799–1804 (John Murray, 1814).
    1. C. Darwin, Voyages of the Adventure and Beagle, Volume III – Journal and Remarks (Henry Colburn, 1839).
    1. A. R. Wallace, Travels on the Amazon and Rio Negro (Ward Lock, 1889).
    1. A. R. Wallace, The Malay Archipelago: The Land of the Orang-utan and the Bird of Paradise; a Narrative of Travel, with Studies of Man and Nature (Macmillan, 1869).
    1. H. W. Bates, The Naturalist on the River Amazon: A Record of Adventures, Habits of Animals, Sketches of Brazilian and Indian life, and Aspects of Nature under the Equator During Eleven Years of Travel (John Murray, 1891).

Publication types