. 2017 Oct 20;8(1):1077.
doi: 10.1038/s41467-017-01027-z.

Comprehensive analysis of normal adjacent to tumor transcriptomes

Affiliations

Comprehensive analysis of normal adjacent to tumor transcriptomes

Dvir Aran et al. Nat Commun. .

Abstract

Histologically normal tissue adjacent to the tumor (NAT) is commonly used as a control in cancer studies. However, little is known about the transcriptomic profile of NAT, how it is influenced by the tumor, and how the profile compares with non-tumor-bearing tissues. Here, we integrate data from the Genotype-Tissue Expression project and The Cancer Genome Atlas to comprehensively analyze the transcriptomes of healthy, NAT, and tumor tissues in 6506 samples across eight tissues and corresponding tumor types. Our analysis shows that NAT presents a unique intermediate state between healthy and tumor. Differential gene expression and protein-protein interaction analyses reveal altered pathways shared among NATs across tissue types. We characterize a set of 18 genes that are specifically activated in NATs. By applying pathway and tissue composition analyses, we suggest a pan-cancer mechanism of pro-inflammatory signals from the tumor stimulates an inflammatory response in the adjacent endothelium.


Conflict of interest statement

The authors declare no competing financial interests.

Figures

Fig. 1
Fig. 1
Comparison of healthy tissues, normal, adjacent normal (NAT) tissues, and tumors. a Study design. From GTEx, we collected 1578 RNA-seq raw samples across bladder, breast, colon, liver, lung, prostate, thyroid, and uterus tissues, and matched with corresponding tumor types 428 normal adjacent tumor (NAT) and 4500 tumor samples from TCGA. We performed identical processing of all samples using the protocol presented in Rahman et al., and validated that the data are coherent. We then utilized several techniques to characterize the differences between healthy tissues, NAT, and tumor tissues that are shares across tissue types. Credit for the organs illustrations in this figure: © Alex Oakenman/Shutterstock.com. All rights reserved. These images are not included under the creative commons license for this article. b Pearson correlation between median healthy samples in each tissue site (rows) and each of the 428 NAT samples. In 405 of the NAT samples (94.6%), the maximal correlation coefficient was with the corresponding healthy tissue. c Median log2 expression levels of 553 housekeeping genes in healthy and NAT tissues across tissue types. Spearman coefficient is presented. The size of the point represents the standard deviation (SD) in NAT, and color represents SD in healthy. High concordance in SD is observed between NAT and healthy as well (R = 0.902)
Fig. 2
Fig. 2
Intermediate state of NAT between healthy and tumor tissue. a t-SNE plots for each tissue types. Each group is clustered on its own in all plots. In 6 of 8 plots, the NAT samples (orange) are in between the healthy (green) and tumor (purple) samples. In bladder, there is not sufficient power of non-tumor samples compared with the tumor obstructing the discrimination between the conditions, yet the NAT samples are in between the tumor and the healthy tissue. Colon is an exception because of an issue related to the source of the healthy samples. b Deconvolution analysis of the NAT samples using median expression levels of healthy and tumor as references. The result of the analysis is the fraction of similarity of each NAT sample to the tumor. The small points, normal (green) and tumor (purple) deconvolution fractions, are shown as reference
Fig. 3
Fig. 3
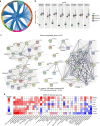
Upregulated genes in NAT compared with healthy. a Overall, 2451 genes were upregulated in NAT compared with healthy across all tissue types. Of those, 660 were found in more than one tissue site, 223 in more than two (x-fold more than expected by random) and 98 in more than three (x-fold). The chord diagram shows the vast amount of shared genes among all tissue types. b Boxplot of the expression levels of ATP5E, an example of a gene that is consistently upregulated in NAT compared with healthy. No significant difference is observed between NAT and tumor. c STRING analysis of protein–protein interactions of the 98 genes, corresponding to 91 proteins, upregulated in NAT compared with healthy in at least four tissue types. A total of 180 edges are found between 57 of the genes (other genes not shown). Only 30 are expected by chance (Poisson approximation p-value < 1 × 10−20). Thickness of edges indicates confidence. We observed four clusters with three or more genes cluster 1: cell division; cluster 2: immune response; cluster 3: cellular stimuli; cluster 4: ATP. d Gene-set enrichment analysis (GSEA) of the hallmark gene sets using NAT vs. healthy differential expression. NES are presented, but only for significant comparisons (FDR < 1%). Otherwise, the color of the cell is white. Only gene sets significant in at least one tissue site are presented. The full data is in Supplementary Data 3. Inflammatory response-related pathways are generally enriched in NAT in most tissue types (red). On the other hand, the NAT tissue tends to not express normal development pathways such as myogenesis and adipogenesis (blue)
Fig. 4
Fig. 4
NAT expression compared with healthy and tumor. a Genes and gene sets expression profiles were divided to nine expression models: each gene/gene set can be upregulated (U), downregulated (D) or not differentially expressed (stable, S) in NAT vs. healthy and tumor vs. NAT. Expression models suggest a NAT-specific activation or repression (UD/DU models), an intermediate state between normal and tumor (UU/DD), resembling healthy (SU/SD) or resembling tumor (US/UD). The null model (SS) is not presented. b Normalized gene-set enrichment score (NES) of hallmark gene sets in NAT compared with healthy (x axis) and compared with the tumor (y axis). Non-significant NES values (FDR < 1%) were nullified. Gene sets were colored according to the expression models in (a) if they fit the expression model in the majority of tissue sites. NES are positive if enrichmed in NAT. Cancer-related pathways (bottom), correspond to the SD model; inflammatory-related pathways (right), correspond to the US model; normal development gene sets (top-left), correspond to the DD model; the TNF-α signaling pathway has a NAT-specific UD activation model. c Average fold change of the number of observed genes in each expression model in each tissue site compared with the expected number of genes by the number DEGs in A:H and in T:H. The NAT-specific UD and DU models are highly enriched compared with null hypothesis. d Validation of UD genes in independent cohorts containing healthy, adjacent, and tumor samples. Top: heatmap of gene expression in colon (GSE44076), where 106 of 119 UD genes are found. In 92 of the genes, the average expression in NAT is higher than in healthy and tumors. Bottom: in four microarray cohorts we classified our tissue type identified UD genes to four categories: higher average in NAT compared with both healthy and tumor (UD); lower average in NAT (DU); average in NAT lower than healthy but higher than tumor (DD); higher average in NAT than healthy but lower than tumor (UU). In all four cohorts, the UD model was highly enriched compared to expected (colon: 86.8% (expected–17.7%); liver: 79.2% (27%); breast: 69% (34.1%); Prostate: 48.4% (18.8%))
Fig. 5
Fig. 5
Shared tumor-adjacent normal (NAT)-specific genes. a Boxplot of the expression levels of EGR1 and FOSB, examples of gene that are upregulated in NAT compared with healthy and downregulated in tumors in most tissue types. b STRING analysis of protein–protein interactions (PPI) of 18 genes specifically activated in NAT in at least three tissue types. Overall, 27 edges are found between 12 of the genes. Only 2 are expected by chance (PPI enrichment p-value < 1 × 10−20). Thickness of edges indicates confidence. c Co-expression analysis of the 18-shared TASA genes in NAT samples. Same as in the PPI analysis, we observe strong co-expression of 12 of the genes, but in addition, we observe that more associations between genes on top of the PPI analysis. d TASA scores (ssGSEA of 18-shared TASA genes) in 11 breast tumors patients and in the adjacent tissue, up to 4 cm from the tumor boundaries (E-TABM-276 study). In each patient, scores are aligned relative to the tumor. In 10 of 11 patients, an increase in TASA score was observed outside of the tumor. The TASA score increases immediately outside the tumor (1 cm) and is maintained across the adjacent tissue. In 4 of the 6 patients with multiple expression profiles, we observed a small decrease in TASA score in 4 cm compared to 1 or 2 cm, possibly suggesting a modest gradient effect as a function of the distance from the tumor. e Top: western blot analysis of FosB protein levels in tumor, NAT and contralateral non-tumor (NCT) mammary gland of three human breast cancer patient-derived xenografts (HCI-002, HCI-009, and HCI-010). In addition, 3 naive mouse mammary glands are shown as reference. Bottom: FosB levels normalized to actin levels. Blue = HCI-002, red = HCI-009, and green = HCI-010. In two of the PDXs (HCI-002 and HCI-009), we observed a marked elevation of FosB levels in both the NAT and NCT compared with the samples from the tumor and non-tumor from naive mice
Fig. 6
Fig. 6
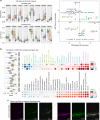
Cell types and pathway analysis of the NAT-specific activation signature. a Left: boxplot of the xCell scores for dendritic cells (DC) and endothelial cells (EC). DCs tend to be low in healthy samples and higher in NAT and tumors. ECs are high in normal samples, tend to be lower in NAT, and even lower in tumors. Right: Scatter plot of the differential number of tissue types where the cell type is significantly enriched between NAT and healthy (x axis), and NAT and tumor (y axis). For example, endothelial cells are significantly diminished in five NAT tissues compared with healthy (breast, colon, lung, and thyroid) and enriched in one tissue type (liver)—thus the x value is −4. Significance analysis was performed using Mann–Whitney test, and a significant difference was defined as Bonferroni corrected p-value < 0.001. b Left: Boxplots of ssGSEA scores of the 18-shared TASA signature. In 7 of 8 tissue types, there is significant enrichment in NAT compared with both healthy and tumor. In colon, there is no enrichment compared with healthy, and can be explained by the differential expression of the TASA genes between sigmoid and transverse colon (Supplementary Fig. 26). Top: median Spearman coefficients across tissue types between TASA scores and xCell scores. Cell types were ordered according to the NAT coefficients. Top correlations are with endothelial cells, suggesting their role in these cells. Down: median Spearman coefficients across tissue types between TASA scores and hallmark gene sets. Gene sets were ordered according to the NAT coefficients. Only top and bottom 15 genes sets are presented. TASA is positively correlated with pathways that induce epithelial–mesenchymal transition. c Immunofluorescent staining for CD31, an endothelial cell marker, and FosB protein in NAT of a human breast tumor excision specimen (two other samples are in Supplementary Fig. 29). Remarkably, both markers are highly colocalized in all three samples (Costes p-value < 1 × 10−6)
Fig. 7
Fig. 7
Comparison of differential expression analysis with healthy tissue or NAT as controls. a Scatter plot of log2 fold-changes in differential expression analyses between tumor and healthy (x axis) or NAT (y axis) as control. Pearson coefficient is presented. b Venn diagram of differentially expressed genes (DEGs) in tumor vs. healthy (T:H) and tumor vs. NAT (T:A) across all tissue types. 63.8% of T:A DEGs are also significant in T:H, 41.1% of T:H DEGs are also significant in T:A

References

    1. Gerweck LE, Seetharaman K. Cellular pH gradient in tumor versus normal tissue: Potential exploitation for the treatment of cancer. Cancer Res. 1996;56:1194–1198. - PubMed
    1. Heaphy CM, et al. Telomere DNA content and allelic imbalance demonstrate field cancerization in histologically normal tissue adjacent to breast tumors. Int. J. Cancer. 2006;119:108–116. doi: 10.1002/ijc.21815. - DOI - PubMed
    1. Trujillo KA, et al. Markers of fibrosis and epithelial to mesenchymal transition demonstrate field cancerization in histologically normal tissue adjacent to breast tumors. Int. J. Cancer. 2011;129:1310–1321. doi: 10.1002/ijc.25788. - DOI - PMC - PubMed
    1. Heaphy CM, Griffith JK, Bisoffi M. Mammary field cancerization: Molecular evidence and clinical importance. Breast Cancer Res. Treat. 2009;118:229–239. doi: 10.1007/s10549-009-0504-0. - DOI - PubMed
    1. Finak G, et al. Gene expression signatures of morphologically normal breast tissue identify basal-like tumors. Breast Cancer Res. 2006;8:R58. doi: 10.1186/bcr1608. - DOI - PMC - PubMed

Publication types

MeSH terms

Substances