. 2017 Oct 20;8(1):1055.
doi: 10.1038/s41467-017-01098-y.

Silencing Nfix rescues muscular dystrophy by delaying muscle regeneration

Affiliations

Silencing Nfix rescues muscular dystrophy by delaying muscle regeneration

Giuliana Rossi et al. Nat Commun. .

Abstract

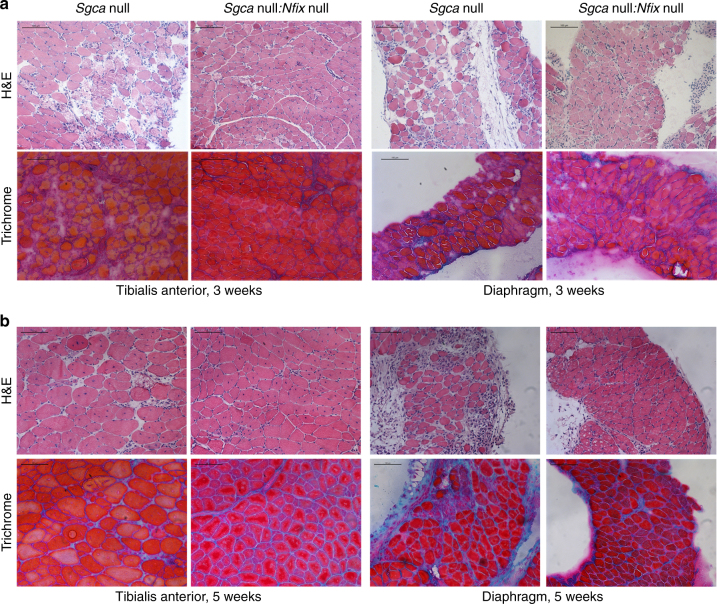
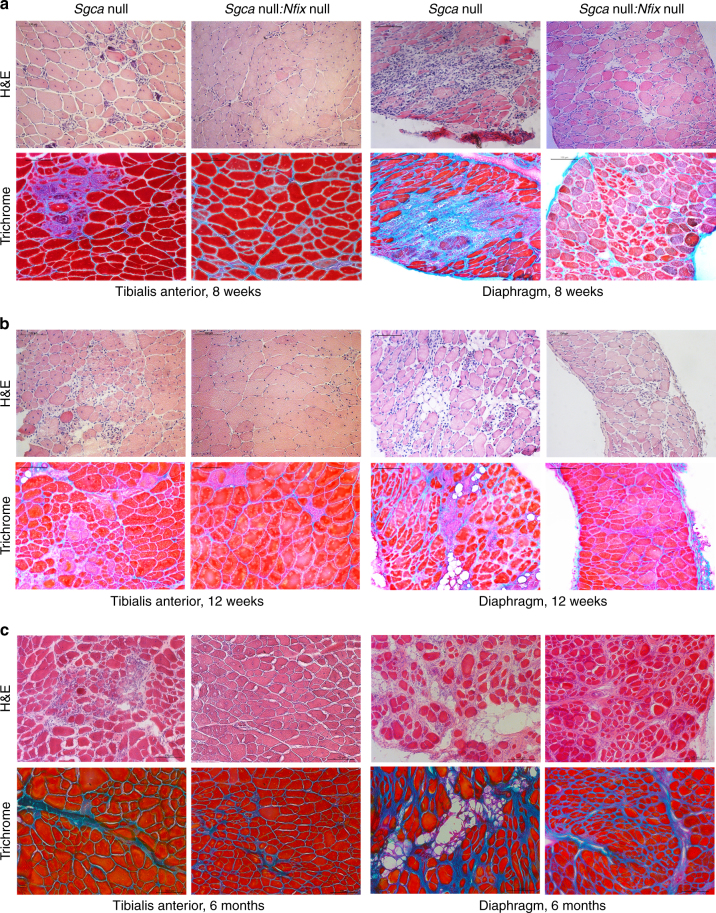
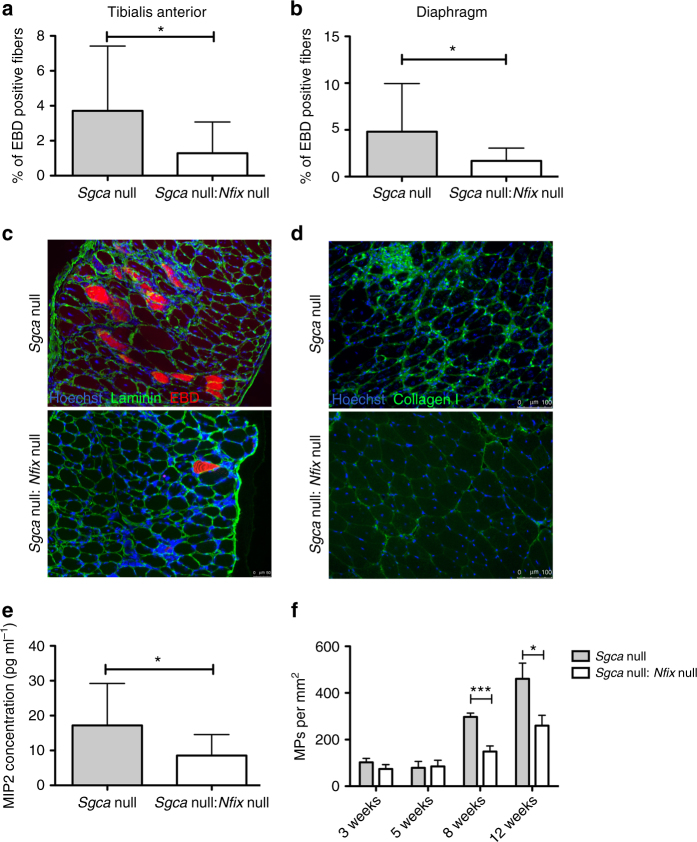
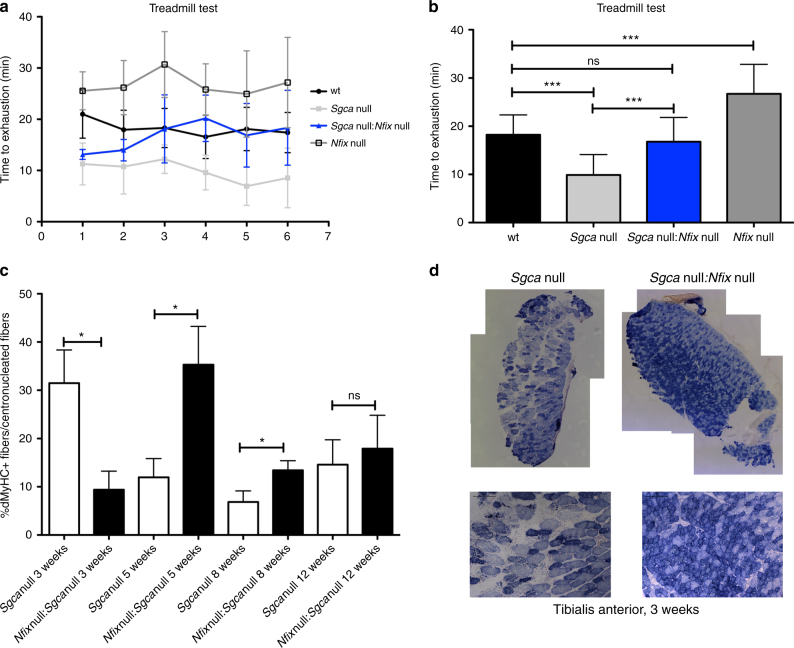
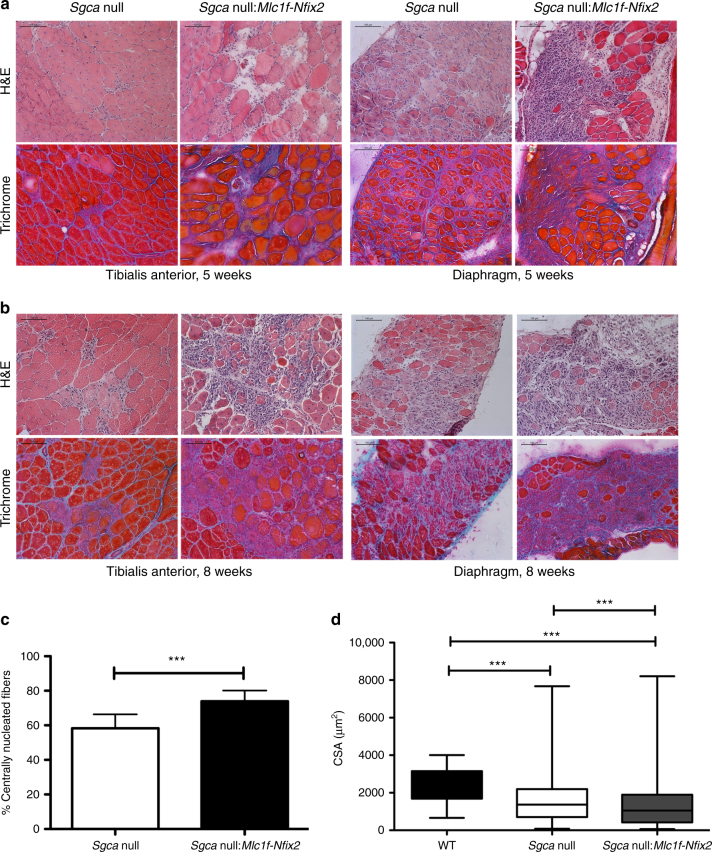
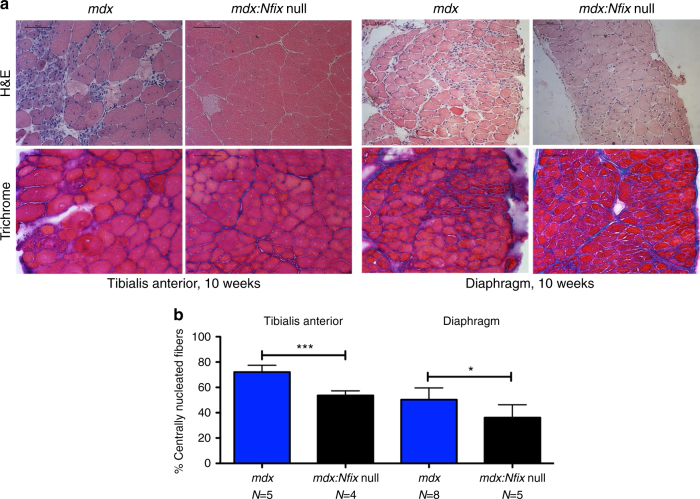
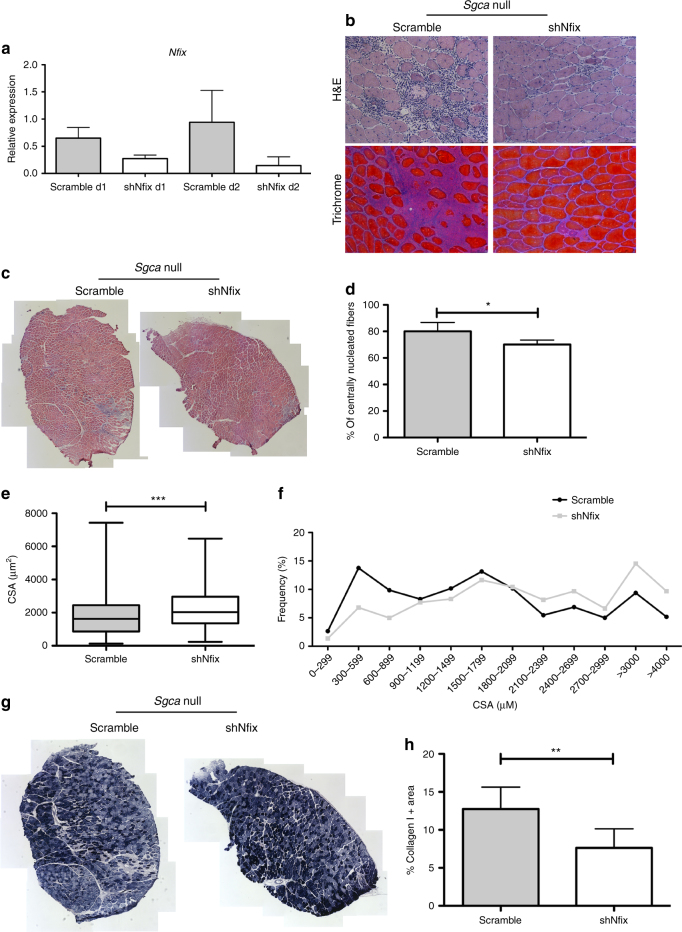
Muscular dystrophies are severe disorders due to mutations in structural genes, and are characterized by skeletal muscle wasting, compromised patient mobility, and respiratory functions. Although previous works suggested enhancing regeneration and muscle mass as therapeutic strategies, these led to no long-term benefits in humans. Mice lacking the transcription factor Nfix have delayed regeneration and a shift toward an oxidative fiber type. Here, we show that ablating or silencing the transcription factor Nfix ameliorates pathology in several forms of muscular dystrophy. Silencing Nfix in postnatal dystrophic mice, when the first signs of the disease already occurred, rescues the pathology and, conversely, Nfix overexpression in dystrophic muscles increases regeneration and markedly exacerbates the pathology. We therefore offer a proof of principle for a novel therapeutic approach for muscular dystrophies based on delaying muscle regeneration.


Conflict of interest statement

The authors declare no competing financial interests.

Figures

Fig. 1
Fig. 1
Lack of Nfix improves signs of muscular dystrophy. a Hematoxylin and eosin (H&E) and Milligan’s trichrome staining of tibialis anterior (left) and diaphragm (right) muscles at 3 weeks of age; N = 12 Sgca null and 6 Sgca null:Nfix null mice. Scale bar 100 μm. b Hematoxylin and eosin (H&E) and Milligan’s trichrome staining of tibialis anterior (left) and diaphragm (right) muscles at 5 weeks of age; N = 5 Sgca null and 5 Sgca null:Nfix null mice. Scale bar 100 μm. See also Supplementary Fig. 1 for the analysis of central nucleation in tibialis anterior and diaphragm muscles at 3 and 5 weeks
Fig. 2
Fig. 2
Muscular dystrophy amelioration in absence of Nfix persists up to 6 months. a Hematoxylin and eosin (H&E) and Milligan’s trichrome staining of tibialis anterior (left) and diaphragm (right) muscles at 8 weeks of age; N = 23 Sgca null and 12 Sgca null:Nfix null mice. Scale bar 100 μm. b Hematoxylin and eosin (H&E) and Milligan’s trichrome staining of tibialis anterior (left) and diaphragm (right) muscles at 12 weeks of age; N = 6 Sgca null and 4 Sgca null:Nfix null mice. Scale bar 100 μm. c Hematoxylin and eosin (H&E) and Milligan’s trichrome staining of tibialis anterior (left) and diaphragm (right) muscles at 6 months of age; N = 4 Sgca null and 4 Sgca null:Nfix null mice. Scale bar 100 μm. See also Supplementary Fig. 1 for the analysis of central nucleation in tibialis anterior and diaphragm muscles at 8 and 12 weeks and for the analysis of CSA at 8 weeks, Supplementary Fig. 2 for full muscle reconstructions, collagen I quantification, histology of gastrocnemius, quadriceps, soleus, and EDL muscles, and PCR analysis of oxidative fiber genes at 8 weeks, and Supplementary Fig. 3 for the analysis of utrophin and myostatin levels at 8 weeks
Fig. 3
Fig. 3
Pathological parameters are rescued in dystrophic mice lacking Nfix. a Percentage of EBD positive myofibers in tibialis anterior muscles at 8 weeks; N = 19 Sgca null and 9 Sgca null:Nfix null mice; mean ± SD; t test, *P < 0.05. b Percentage of EBD positive myofibers in diaphragms at 8 weeks; N = 19 Sgca null and 11 Sgca null:Nfix null mice; mean ± SD; t test, *P < 0.05. c Immunofluorescence for laminin (green) and EBD (red) on diaphragms at 8 weeks. Hoechst (blue) stains nuclei. Scale bar 50 μm. d Immunofluorescence showing collagen I (green) deposits in tibialis anterior sections. Scale bar 100 μm. e MIP2 ELISA assay on gastrocnemius muscles at 8 weeks; N = 18 Sgca null and 7 Sgca null:Nfix null mice; mean ± SD; t test, *P < 0.05. f Quantification of the immunofluorescence staining for F4/80, marker of macrophages (MPs), on tibialis anterior muscle sections at different time points. N = 5 Sgca null and 5 Sgca null:Nfix null at 3 weeks, N = 3 Sgca null and 3 Sgca null:Nfix null at 5 weeks, N = 8 Sgca null and 8 Sgca null:Nfix null at 8 weeks, and N = 12 Sgca null and 7 Sgca null:Nfix null at 12 weeks. Mean ± SEM; t test, *P < 0.05, ***P < 0.001
Fig. 4
Fig. 4
Sgca null:Nfix null mice show improved functionality, an oxidative phenotype, and delayed regeneration. a, b Treadmill test on WT, Sgca null, Sgca null:Nfix null, and Nfix null mice. a represents the performance profile over time, while b shows the totality of the measurements; N = 6 measurements per 7 WT, 4 Sgca null, 3 Sgca null:Nfix null, and 4 Nfix null mice. Mean ± SD; one-way ANOVA with Bonferroni post-test, ***P < 0.001. ns, non significant. See also Supplementary Movie 1 for an example of a typical run. c Percentage of developmental myosin heavy chain positive fibers out of the centrally nucleated fibers at different time points. N = 8 Sgca null and 8 Sgca null:Nfix null mice at 3 weeks, N = 11 Sgca null and 11 Sgca null:Nfix null mice at 5 weeks, N = 11 Sgca null and 11 Sgca null:Nfix null mice at 8 weeks, and N = 10 Sgca null and 10 Sgca null:Nfix null mice at 12 weeks; mean ± SEM; t test, *P < 0.05, *P < 0.001. d Entire tibialis anterior muscle section reconstructions and higher magnifications showing SDH staining at 3 weeks of age; N = 13 Sgca null and 6 Sgca null:Nfix null mice. Scale bar 100 μm
Fig. 5
Fig. 5
Nfix overexpression in skeletal muscle exacerbates the dystrophic phenotype. a Hematoxylin and eosin (H&E) and Milligan’s trichrome staining of tibialis anterior (left) and diaphragm (right) muscles at 5 weeks of age; N = 4 Sgca null and 9 Sgca null:Mlc1f-Nfix2 mice. Scale bar 100 μm. b Hematoxylin and eosin (H&E) and Milligan’s trichrome staining of tibialis anterior (left) and diaphragm (right) muscles at 8 weeks of age; N = 6 Sgca null and 30 Sgca null:Mlc1f-Nfix2 mice. Scale bar 100 μm. c Percentage of centrally nucleated myofibers in tibialis anterior muscles at 8 weeks of age; N = 11 Sgca null and 18 Sgca null:Mlc1f-Nfix2 mice. Mean ± SD; t test, ***P < 0.001. d Myofiber cross-sectional area distribution at 8 weeks of age; N = 186 fibers for WT, 908 for Sgca null, and 1026 for Sgca null:Mlc1f-Nfix2 mice. Mean ± whiskers from min to max; one-way ANOVA with Bonferroni post-test, ***P < 0.001. See also Supplementary Fig. 4 for PCR and WB analysis of Nfix expression in Sgca null:Mlc1f-Nfix2 mice, as well as for central nucleation and CSA measurements
Fig. 6
Fig. 6
Targeting Nfix ameliorates muscular dystrophy also in mdx mice. a Hematoxylin and eosin (H&E) and Milligan’s trichrome staining of tibialis anterior (left) and diaphragm (right) muscles at 10 weeks of age; N = 5 mdx and 4 mdx:Nfix null mice. Scale bar 100 μm. b Percentage of centrally nucleated myofibers in tibialis anterior (TA) and diaphragm muscles at 10 weeks of age; N = 5 mdx and 4 mdx:Nfix null mice for TA. N = 8 mdx and 5 mdx:Nfix null mice for diaphragm. Mean ± SD, t test, *P < 0.05; ***P < 0.001. See also Supplementary Fig. 3 for the analysis of utrophin and myostatin levels in mdx mice
Fig. 7
Fig. 7
Silencing Nfix in adult Sgca null mice morphologically rescues the dystrophic pathology. a Real-time PCR analysis of Nfix expression on Sgca null muscles electroporated with scramble or shNfix plasmids after 1 or 2 days (d) from electroporation. N = 2 for each group. Mean ± SD. b Hematoxylin and eosin (H&E) and Milligan’s trichrome staining of tibialis anterior muscles from Sgca null mice electroporated with scramble or shNfix plasmids; N = 9 mice. Scale bar 75 μm. c Entire tibialis anterior muscle section reconstructions of Sgca null mice electroporated with scramble or shNfix plasmids; N = 9 mice. d Percentage of centrally nucleated myofibers in tibialis anterior muscle sections from Sgca null mice electroporated with scramble or shNfix plasmids. N = 5 mice. Mean ± SD; t test, *P < 0.05. e, f Myofiber cross-sectional area distribution in Sgca null mice electroporated with scramble or shNfix plasmids; N = 639 fibers for scramble and 661 for shNfix. Mean ± whiskers from min to max; t test, ***P < 0.001. g SDH staining of Sgca null tibialis anterior muscles electroporated with scramble or shNfix vectors; N = 4 mice. h Quantification of collagen I positive areas in Sgca null tibialis anterior muscles electroporated with scramble (N = 9) or shNfix (N = 9) plasmids. Mean ± SD; t test, **P < 0.01

Comment in

References

    1. Mercuri E, Muntoni F. Muscular dystrophies. Lancet. 2013;381:845–860. doi: 10.1016/S0140-6736(12)61897-2. - DOI - PubMed
    1. Emery AE. The muscular dystrophies. Lancet. 2002;359:687–695. doi: 10.1016/S0140-6736(02)07815-7. - DOI - PubMed
    1. Flanigan KM. Duchenne and Becker muscular dystrophies. Neurol. Clin. 2014;32:671–688. doi: 10.1016/j.ncl.2014.05.002. - DOI - PubMed
    1. Sandona D, Betto R. Sarcoglycanopathies: molecular pathogenesis and therapeutic prospects. Expert Rev. Mol. Med. 2009;11:e28. doi: 10.1017/S1462399409001203. - DOI - PMC - PubMed
    1. Urtasun M, et al. Muscular dystrophy due to a mutation in the gene of alpha-sarcoglycan subunit of dystrophin associated protein complex. Med. Clin. 1998;110:538–542. - PubMed

Publication types