. 2018 Feb 8;37(6):756-767.
doi: 10.1038/onc.2017.365. Epub 2017 Oct 23.

Neurotensin receptor type 2 protects B-cell chronic lymphocytic leukemia cells from apoptosis

Affiliations

Neurotensin receptor type 2 protects B-cell chronic lymphocytic leukemia cells from apoptosis

A Abbaci et al. Oncogene. .

Abstract

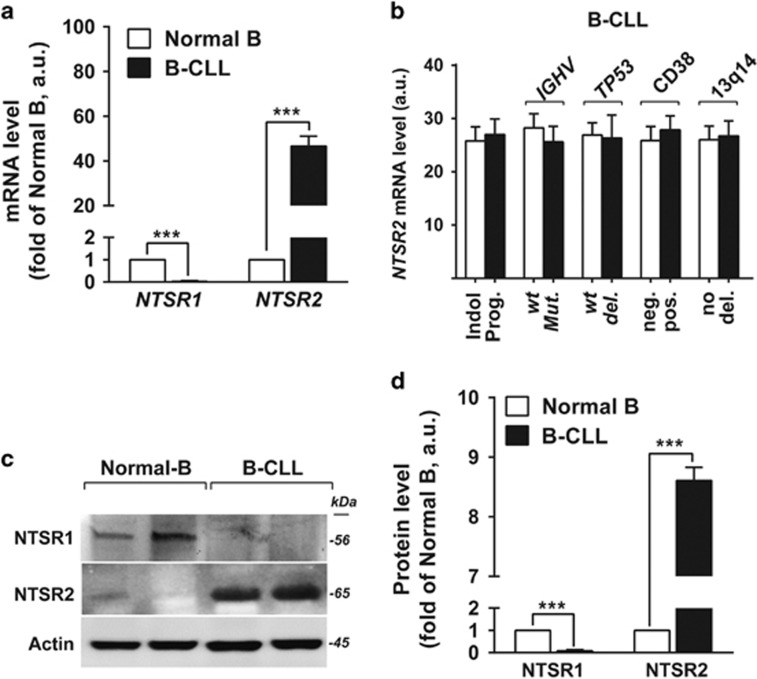
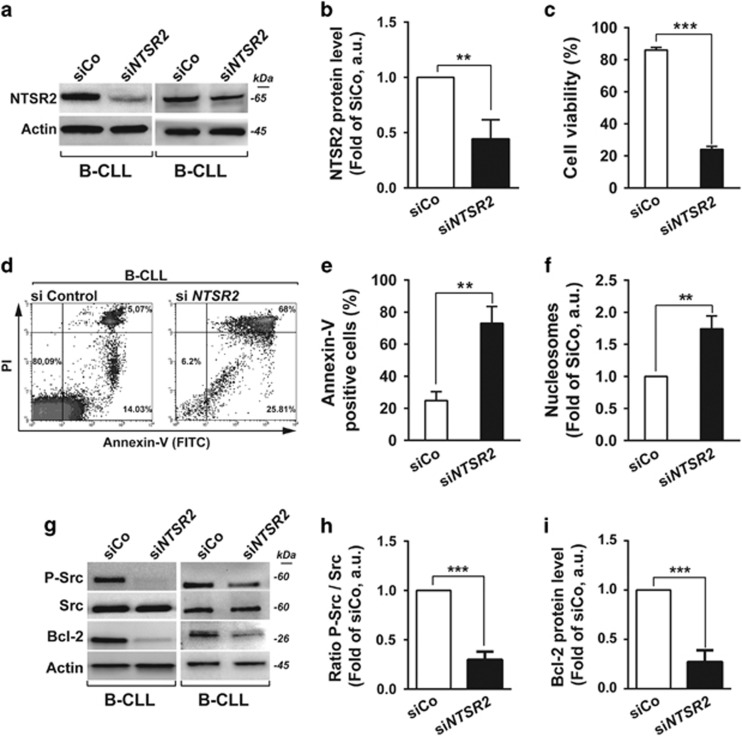
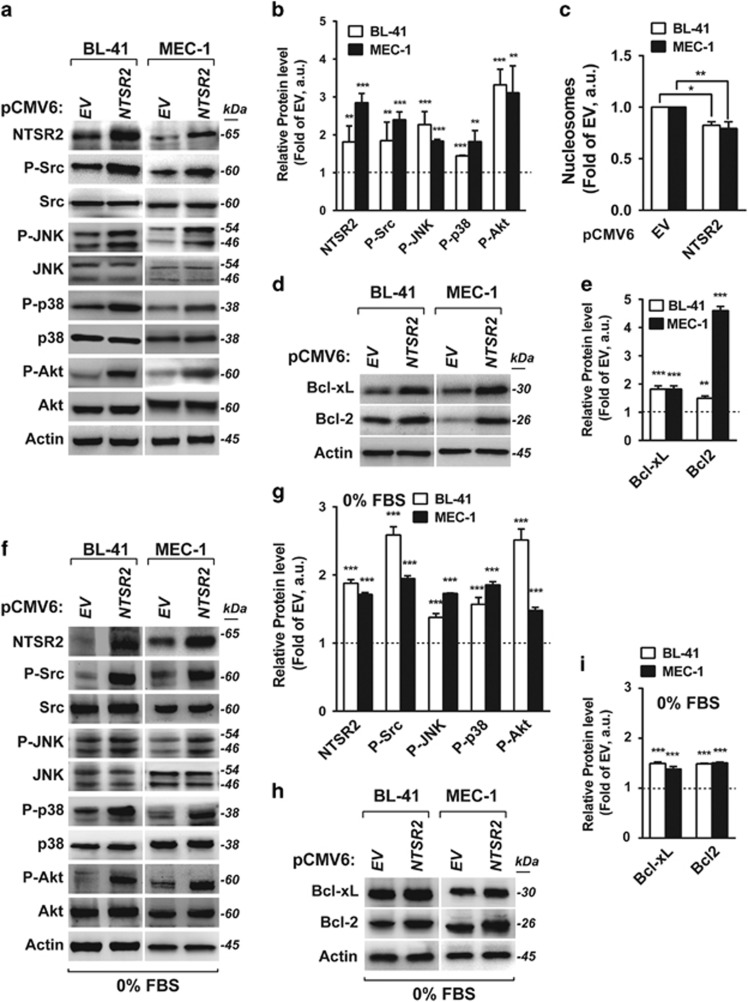
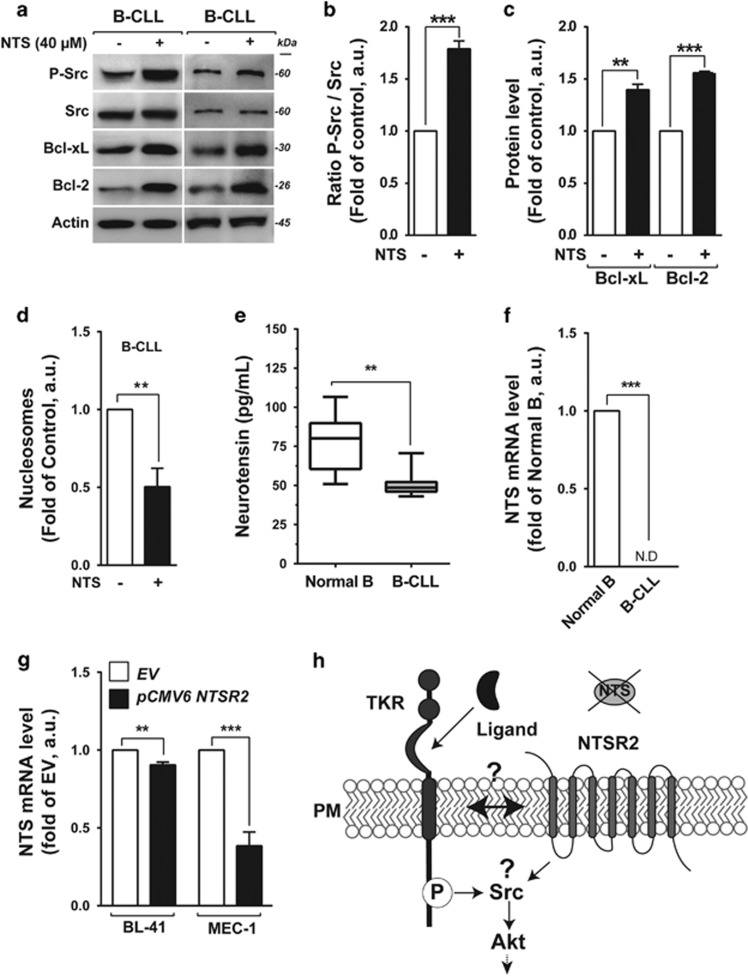
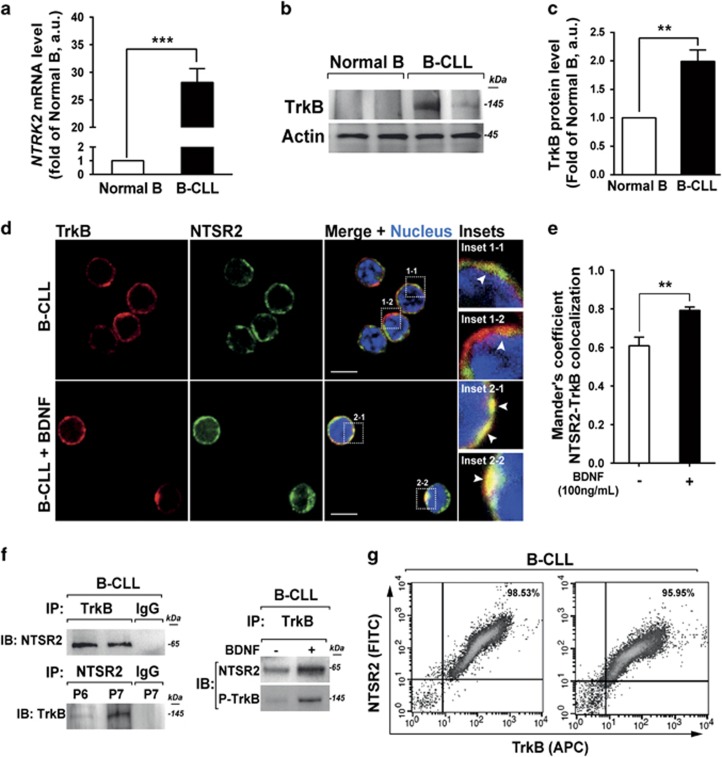
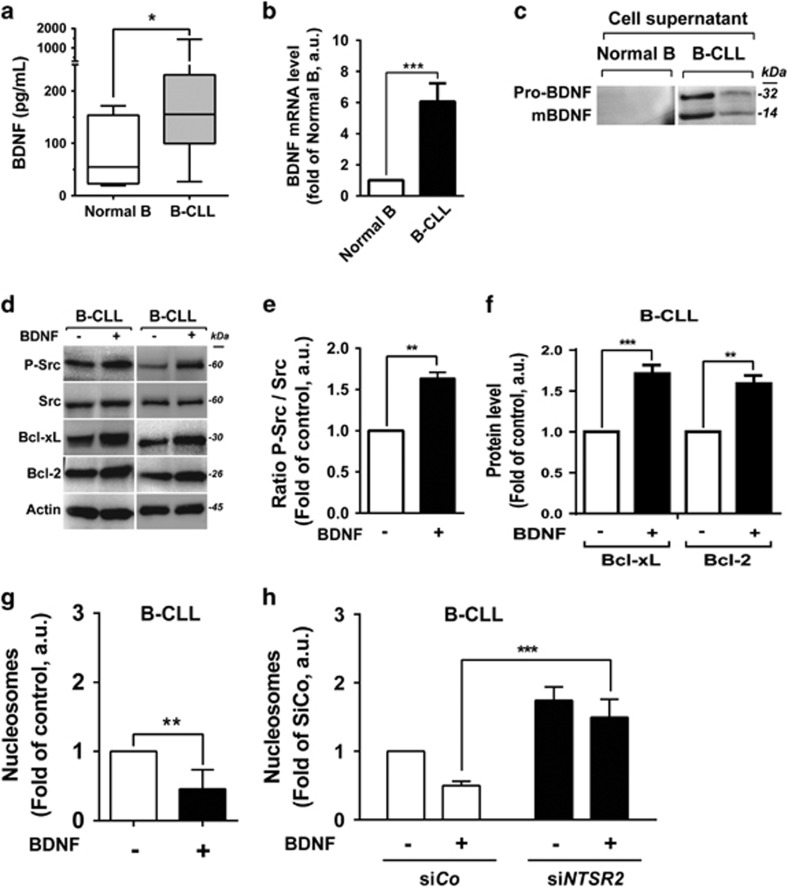
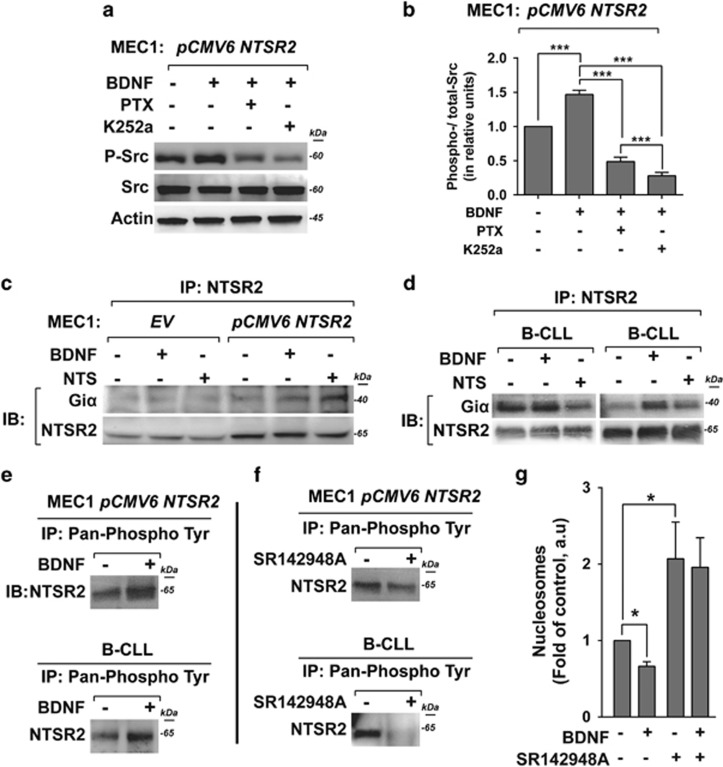
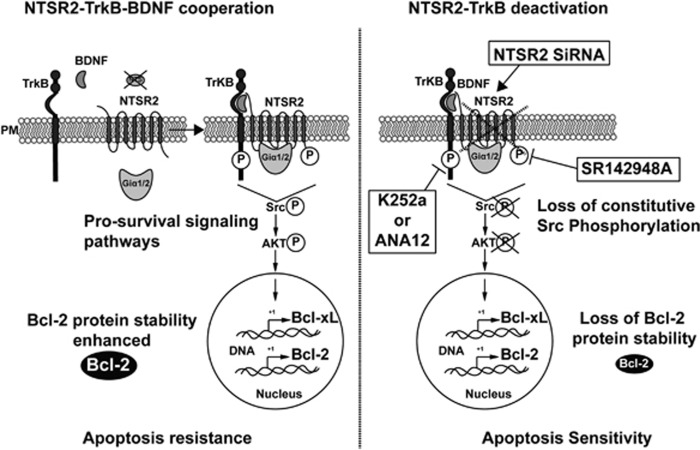
B-cell chronic lymphocytic leukemia (B-CLL) cells are resistant to apoptosis, and consequently accumulate to the detriment of normal B cells and patient immunity. Because current therapies fail to eradicate these apoptosis-resistant cells, it is essential to identify alternative survival pathways as novel targets for anticancer therapies. Overexpression of cell-surface G protein-coupled receptors drives cell transformation, and thus plays a critical role in malignancies. In this study, we identified neurotensin receptor 2 (NTSR2) as an essential driver of apoptosis resistance in B-CLL. NTSR2 was highly expressed in B-CLL cells, whereas expression of its natural ligand, neurotensin (NTS), was minimal in both B-CLL cells and patient plasma. Surprisingly, NTSR2 remained in a constitutively active phosphorylated state, caused not by a mutation-induced gain-of-function but rather by an interaction with the oncogenic tyrosine kinase receptor TrkB. Functional and biochemical characterization revealed that the NTSR2-TrkB interaction acts as a conditional oncogenic driver requiring the TrkB ligand brain-derived neurotrophic factor (BDNF), which unlike NTS is highly expressed in B-CLL cells. Together, NTSR2, TrkB and BDNF induce autocrine and/or paracrine survival pathways that are independent of mutation status and indolent or progressive disease course. The NTSR2-TrkB interaction activates survival signaling pathways, including the Src and AKT kinase pathways, as well as expression of the anti-apoptotic proteins Bcl-2 and Bcl-xL. When NTSR2 was downregulated, TrkB failed to protect B-CLL cells from a drastic decrease in viability via typical apoptotic cell death, reflected by DNA fragmentation and Annexin V presentation. Together, our findings demonstrate that the NTSR2-TrkB interaction plays a crucial role in B-CLL cell survival, suggesting that inhibition of NTSR2 represents a promising targeted strategy for treating B-CLL malignancy.


Conflict of interest statement

The authors declare no conflict of interest.

Figures

Figure 1
Figure 1
NTSR2, but not NTSR1, is overexpressed in B-CLL. (a) Quantitative analyses of NTSR1 and NTSR2 mRNA levels in normal B (n=15) and B-CLL (n=30) lymphocytes, normalized against HPRT. Data are expressed as mean fold change in expression (±s.e.m.) vs normal B cells. (b) Quantitative analyses of NTSR2 mRNA level in indolent (Indol.) vs progressive (prog.) patients, wild-type (wt) vs mutant (Mut.) IGHV, wild-type (wt) vs mutant (deleted, del.) p53, CD38 negative (neg.) vs positive (pos.), and absence (no) vs presence of 13q14 deletion (del.); values are given in arbitrary units (a.u.). (c) Representative analysis of NTSR2 expression from B-lymphocyte lysates from two normal donors (D1, D2) and two B-CLL patients (P1, P2). (d) NTSR2 expression, normalized against actin, in normal B (n=6) and B-CLL (n=6) lymphocytes (means±s.e.m. of three independent experiments). Significant P-values are indicated in the graphs ***P<0.001.
Figure 2
Figure 2
NTSR2 silencing decreases B-CLL viability and induces apoptosis. (a) Representative western blot of B-CLL lymphocytes transfected with either a non-relevant siRNA (siRNA control, siCo) or a pool of four different siRNAs directed against NTSR2 (siNTSR2). (b) NTSR2 protein level, expressed as fold change vs control (siCo), normalized against actin, in three different B-CLL patients. (c) B-CLL cell viability (n=4), expressed as a percentage, 72 h after NTSR2 depletion (siCo vs SiNTSR2). (d) Representative fluorescence-activated cell sorting analysis of apoptosis induction, assessed by Annexin V-fluorescein Isothiocyanate/PI dual staining of B-CLL cells (n=4) depleted or not for NTSR2. (e) Percentage of apoptotic cells (Annexin V-positive cells) after NTSR2 silencing in B-CLL vs siCo. (f) Apoptotic ratio in B-CLL cells (n=5) 72 h after NTSR2 depletion, assessed by cell death ELISA, expressed as fold change vs control (siCo). (g) Representative western blot analysis of p-Src and Bcl-2 expression from B-CLL cell lysates, depleted of NTSR2 or not for 72 h. (h, i) Histogram bars represent the fold change in phosphorylation level of Src or Bcl-2 expression in siNTSR2 cells, normalized against actin, in comparison with siCo. Significant P-values are indicated in the graphs **P<0.01, ***P<0.001.
Figure 3
Figure 3
NTSR2 overexpression induces cell survival signaling pathways. (a,b) Western blot analysis of NTSR2, Src, SAPK/JNK, p38MAPK, and Akt expression from lysates of BL-41 and MEC-1 cells overexpressing NTSR2 (pCMV6-NTSR2) or empty vector (EV) cultured for 24 h post-transfection in basal conditions (10% fetal bovine serum). (c) Apoptotic ratio following NTSR2 overexpression for 24 h, assessed by cell death ELISA, expressed as fold change vs empty vector (EV). (d, e) Representative western blot analysis of Bcl-xL and Bcl-2 expression in BL-41 and MEC-1 cells overexpressing NTSR2 for 24 h. (h, i) Fold change in Bcl-xL or Bcl-2 expression in BL-41 and MEC-1 cells overexpressing NTSR2 for 24 h, normalized against actin, in comparison with EV. (f–i) Similar analyses performed in cells deprived of serum for 24 h. Significant P-values are indicated in the graphs *P<0.05, **P<0.01, ***P<0.001.
Figure 4
Figure 4
Exogenous neurotensin (NTS) maintains cell survival pathways in B-CLL. (a) Representative western blot of p-Src, Bcl-xL and Bcl-2 expression in B-CLL cells after addition of neurotensin (40 μM) for 24 h. (b,c) Expression levels of P-Src (b), Bcl-xL and Bcl-2 (c) represented as, respectively, the ratio of phosphorylated Src vs pan-Src protein and the ratios of Bcl-xL and Bcl-2 to actin. Values are means±s.e.m. of B-CLL, expressed in a.u. (n=3). (d) Apoptotic ratio in B-CLL in the presence or absence of 40 μM NTS for 24 h, assessed by cell death ELISA. Values are proportions of apoptotic cells (±s.e.m.) in three independent experiments from different patients (n=3). (e) Neurotensin concentration, quantified by ELISA, from B-CLL patient plasma (n=22, gray boxes), in comparison with healthy donor plasma (n=8, white boxes). (f) Quantitative analysis of NTS mRNA level in normal B cells (n=15) and B-CLL (n=30). Data are expressed as mean fold change in expression (±s.e.m.) in comparison with normal B cells. ND: not detectable. (g) Quantitative analysis of NTS mRNA level in BL-41 or MEC-1 transfected with either NTSR2 expression vector (pCMV6 NTSR2) or empty vector (EV). Data are expressed as mean fold change (±s.e.m.) vs empty vector. (h) Schematic representation of hypothetical NTSR2 activation dependent on recruitment of a tyrosine kinase receptor (TKR). Significant P-values are indicated in the graphs **P<0.01, ***P<0.001.
Figure 5
Figure 5
NTSR2 interacts with the tyrosine kinase receptor TrkB. (a) Quantitative analysis of the level of NTRK2 mRNA (encoding TrkB) in normal B (n=15) and B-CLL (n=30) lymphocytes. Data are expressed as mean fold change in NTRK2 expression (±s.e.m.) vs normal B cells. (b) Representative analysis of TrkB expression from B-lymphocyte cell lysates from two normal donors (D1, D2) or two B-CLL patients (P1, P2). (c) TrkB expression level, normalized against actin, in normal B (n=6) and B-CLL (n=6) cells. Values are means±s.e.m. of three independent experiments. (d) Confocal microscopy analysis of NTSR2 (green) and TrkB (red) and their colocalization in B-CLL cells (yellow staining in merged image, insets 1-1 to 2-2) in the presence or absence of BDNF (100 ng/ml). (e) Mander’s overlap coefficient indicating colocalization of NTSR2 and TrkB after BDNF (100 ng/ml) treatment (means±s.e.m. of three independent experiments). (f) After immunoprecipitation (IP) of TrkB and NTSR2 from B-CLL protein lysates, immunocomplexes were immunoblotted (IB) with the indicated antibodies. (g) Representative cytogram showing co-detection of NTSR2 and TrkB by flow cytometry in B-CLL lymphocytes. Significant P-values are indicated in the graphs **P<0.01, ***P<0.001.
Figure 6
Figure 6
Protective role of BDNF against B-CLL apoptosis. (a) BDNF concentration, quantified by ELISA, in B-CLL patient plasma (n=17, gray boxes) in comparison with healthy donor plasma (n=9, white boxes). (b) Quantitative analysis of BDNF mRNA level in normal B (n=15) and B-CLL (n=30) cells. Data are expressed as mean fold change in expression (±s.e.m.) vs normal B cells. (c) Representative western blot analysis of pro-BDNF and mature BDNF (mBDNF) expression in normal B and B-CLL supernatants after 24 h of culture post-isolation. (d) Western blot analysis of P-Src, Bcl-xL and Bcl-2 in B-CLL cell lysates from two patients after addition of BDNF (100 ng/ml) for 24 h. (e, f) Expression levels of p-Src (e), Bcl-xL and Bcl-2 (f) represented as, respectively, the ratio of phosphorylated Src vs pan-Src protein and the ratios of Bcl-xL and Bcl-2 to actin (B-CLL, n=3). Values are means±s.e.m. of three independent experiments, in a.u. (g, h) Apoptotic ratio, assessed by cell death ELISA, in B-CLL cells cultured with or without 100 ng/ml BDNF for 24 h (B-CLL, n=4) in the presence or absence of siRNA against NTSR2 or control siRNA. Values are the mean ratio of apoptotic cells (±s.e.m.) from four independent experiments. Significant P-values are indicated in the graphs *P<0.05, **P<0.01, ***P<0.001.
Figure 7
Figure 7
NTSR2 phosphorylation in B-CLL and recruitment of Giα proteins. (a) Representative western blot analysis of Src phosphorylation in MEC-1 cells overexpressing NTSR2 (pCMV6-NTSR2) in the presence or absence of BDNF (100 ng/ml), pertussis toxin (PTX, 200 ng/ml) or K252a (100 nM) for 24 h. (b) Ratio of phosphorylated Src vs pan-Src protein, normalized against actin. Values are means±s.e.m. of three independent experiments in a.u. (c, d). After immunoprecipitation (IP) of NTSR2 from MEC-1 cells overexpressing NTSR2 (pCMV6-NTSR2) or not (EV), or from B-CLL cells in the presence or absence of BDNF (100 ng/ml) or NTS (40 μM/ml), the immunocomplexes were immunoblotted (IB) with anti-Giα1/2 antibodies. (e, f) After immunoprecipitation (IP) of anti-pan-phosphoprotein was performed on MEC-1 cells overexpressing NTSR2 and B-CLL cells in the presence or absence of BDNF (100 ng/ml) or SR142948A (67 μM), the phosphorylation of NTSR2 was detected by immunoblotting (IB) with anti-NTSR2 antibodies. (g) Apoptotic ratio, assessed by cell death ELISA, in B-CLL in the presence or absence of SR142948A (67 μM) for 24 h. Values are mean ratios of apoptotic cells (±s.e.m.) of three independent experiments from different patients (n=3). Significant P-values are indicated in the graphs *P<0.05, ***P<0.001.
Figure 8
Figure 8
Model of NTSR2 function in B-CLL survival. In this schematic, NTSR2–TrkB–BDNF acts as a key regulator of B-CLL resistance to apoptosis. The NTSR2–TrkB interaction is strengthened upon BDNF stimulation, and triggers pro-survival pathways via phosphorylation of NTSR2, resulting in activation of the phosphorylation cascade of the Src and AKT kinases, as well as expression of the downstream anti-apoptotic proteins Bcl-xL and Bcl-2, leading to B-CLL cell survival and resistance to apoptosis (left panel). NTSR2 inhibition by siRNA-mediated mRNA depletion induces a drastic apoptotic cell death despite the presence of TrkB and BDNF, indicating that TrkB plays a role as a second messenger in NTSR2-mediated apoptotic resistance in B-CLL. NTSR2 deactivation by SR142948A suppresses the ability of NTSR2 to recruit the Giα1/2 subunits upon BDNF stimulation, leading to the suppression of NTSR2 phosphorylation and a decrease in the expression of anti-apoptotic proteins, thereby increasing B-CLL apoptosis (right panel). PM, plasma membrane.

References

    1. Kitada S, Pedersen IM, Schimmer AD, Reed JC. Dysregulation of apoptosis genes in hematopoietic malignancies. Oncogene 2002; 21: 3459–3474. - PubMed
    1. Chiorazzi N, Rai KR, Ferrarini M. Chronic lymphocytic leukemia. N Engl J Med 2005; 352: 804–815. - PubMed
    1. Rossi D, Rasi S, Spina V, Bruscaggin A, Monti S, Ciardullo C et al. Integrated mutational and cytogenetic analysis identifies new prognostic subgroups in chronic lymphocytic leukemia. Blood 2013; 121: 1403–1412. - PMC - PubMed
    1. Liu Y, An S, Ward R, Yang Y, Guo X-X, Li W et al. G protein-coupled receptors as promising cancer targets. Cancer Lett 2016; 376: 226–239. - PubMed
    1. Kehrl JH. Heterotrimeric G protein signaling: roles in immune function and fine-tuning by RGS proteins. Immunity 1998; 8: 1–10. - PubMed

Publication types

MeSH terms