. 2018 Feb 15;37(7):924-934.
doi: 10.1038/onc.2017.395. Epub 2017 Oct 23.

Nutrient sensor O-GlcNAc transferase controls cancer lipid metabolism via SREBP-1 regulation

Affiliations

Nutrient sensor O-GlcNAc transferase controls cancer lipid metabolism via SREBP-1 regulation

V L Sodi et al. Oncogene. .

Abstract

Elevated O-GlcNAcylation is associated with disease states such as diabetes and cancer. O-GlcNAc transferase (OGT) is elevated in multiple cancers and inhibition of this enzyme genetically or pharmacologically inhibits oncogenesis. Here we show that O-GlcNAcylation modulates lipid metabolism in cancer cells. OGT regulates expression of the master lipid regulator the transcription factor sterol regulatory element binding protein 1 (SREBP-1) and its transcriptional targets both in cancer and lipogenic tissue. OGT regulates SREBP-1 protein expression via AMP-activated protein kinase (AMPK). SREBP-1 is critical for OGT-mediated regulation of cell survival and of lipid synthesis, as overexpression of SREBP-1 rescues lipogenic defects associated with OGT suppression, and tumor growth in vitro and in vivo. These results unravel a previously unidentified link between O-GlcNAcylation, lipid metabolism and the regulation of SREBP-1 in cancer and suggests a crucial role for O-GlcNAc signaling in transducing nutritional state to regulate lipid metabolism.


Conflict of interest statement

Conflict of Interest

The authors declare no conflict of interest.

Figures
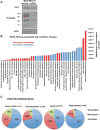
Figure 1
Figure 1. Metabolomics Profiling of MDA-MB-231 breast cancer cells with stable OGT suppression
(A) Cell lysates from MDA-MB-231 cells stably expressing control or OGT shRNA were collected for immunoblot analysis with the indicated antibodies and used for liquid chromatography-mass spectrometry (LC-MS) metabolomics profiling. (B) KEGG pathways highly associated metabolic changes resulting from OGT suppression. Pathways association with significantly increased metabolites (blue) and significantly decreased metabolites (red) are displayed in ranking p-values. Analysis was performed using MBrole2.0. (C) Pie graph showing metabolic categories altered in cells expressing OGT shRNA compared to control shown. Data are represented as statistically significant (p<0.05) changes in 124 out of 301 metabolites, grouped by metabolites related to amino acids, carbohydrates, lipids and nucleotides.
Figure 2
Figure 2. OGT Regulates Lipid Metabolism in Breast Cancer Cells
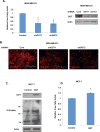
(A) Relative free fatty acids levels in MDA-MB-231 cells stably expressing control, OGT-1 or OGT-2 shRNA. Equal number of cells was analyzed in each sample and normalized to control. (B) Cell lysates from MDA-MB-231 cells expressing control, OGT-1 or OGT-2 shRNA were collected for immunoblot analysis with the indicated antibodies (B) Representative images of nile red staining of MDA-MB-231 cells under the same conditions as (A). (C) Cell lysates from MCF7 cells stably overexpressing control or Flag-OGT were collected for immunoblot analysis with indicated antibodies. (D) Measurement of relative free fatty acids in MCF7 stably overexpressing control or Flag-OGT. Mean ± SE. *p<0.05.
Figure 3
Figure 3. O-GlcNAcylation regulates expression of SREBP-1 and its transcriptional targets
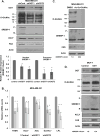
(A) Cell lysates from MDA-MB-231 cells expressing control, OGT-1 or OGT-2 shRNA were collected for immunoblot analysis with the indicated antibodies (top). SREBP-1 protein expression quantified normalized to actin (below). (B). Measurement of relative mRNA expression of SREBP-1 target genes from control or stable OGT shRNA expressing MDA-MB-231 cells using qRT-PCR. All expression is normalized to cyclophilin A internal control and to MDA-MB-231 control samples. (C) Cell lysates from MDA-MB-231 cells treated for 48 hours with control (DMSO) or 100 μM Ac-5sGlcNAc for 48 hrs were collected for immunoblot analysis with the indicated antibodies. (D) Cell lysates from MCF7 cells stably overexpressing control or Flag-OGT were collected for immunoblot analysis with indicated antibodies. Mean ± SE. *p<0.05 **p< 0.01.
Figure 4
Figure 4. O-GlcNAcylation regulation of SREBP-1 is dependent on AMPK activation
(A) Cell lysates from MDA-MB-231 cells expressing control, OGT-1 or OGT-2 shRNA were collected for immunoblot analysis with the indicated antibodies. (B) Protein immunoblot of lysates from MDA-MB-231 expressing control or OGT shRNA and treated with vehicle (DMSO) or 10 μM Compound C for 24 hours, analyzed with the indicated antibodies. (C) Cell lysates from WT or AMPK -/- MEF cells expressing control or OGT shRNA were analyzed with the indicated antibodies by immunoblot (top). Quantification of SREBP-1 protein expression normalized to actin (below). (D) Cell lysates from MDA-MB-231 cells expressing control or OGT shRNA treated with control (dH20) or 10 μM methyl-pyruvate for 24 hours were collected and analyzed with the indicated antibodies. Mean ± SE. *p<0.05.
Figure 5
Figure 5. OGT-suppression induced decreases in lipids and cell growth are prevented when SREBP-1 expression is restored
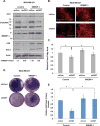
(A) Cell lysates were collected from MDA-MB-231 cells were treated with control or OGT shRNA after stable infection with control or SREBP-1. Lysates were analyzed with the indicated antibodies (top). Quantification of relative SREBP-1 protein expression normalized to actin is displayed below panel. (B) Representative immunofluorescent imaging of nile red stained cells corresponding to the conditions in (A). (C) Quantification of measurements of relative free fatty acids within cells corresponding to the conditions in (A). (D) MDA-MB-231 cells were treated with control or OGT shRNA after stable infection with control or SREBP-1 and cell colonies were stained with crystal violet. (E) Quantification of soft agar colony forming assays corresponding to conditions in (A-D) after staining with INT for visualization. Mean ± SE. *p<0.05.
Figure 6
Figure 6. SREBP-1 restoration prevents OGT-suppression mediated decreases in mTOR signaling, activation of AMPK and decreased glycolytic regulators
(A) Cell lysates were collected from MDA-MB-231 cells were treated with control or OGT shRNA after stable infection with control or SREBP-1 and analyzed with the indicated antibodies. (B) Changes in lactate levels were measured from cells in (A) and normalized to control-treated cells. (C) Relative glucose consumption were measured from cells in (A) and normalized to cell number. Mean ± SEM. *p<0.05, **p<0.01.
Figure 7
Figure 7. Decreased tumor growth in vivo by OGT suppression is partially rescued by SREBP-1 overexpression
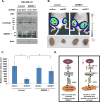
(A) Cell lysates were collected prior to injection into mice from MDA-MB-231-Luciferase cells treated with control or OGT shRNA after stable infection with control or SREBP-1 and analyzed by immunoblot with the indicated antibodies. (B) Representative bioluminescent images of xenograft conditions corresponding to conditions in (A) from week 4–6 post-injection (endpoint as dictated by IACUC. (C) Mean tumor volume (mm3) from MDA-MB-231 cells with the indicated treatment (as in A-B) (n=6/group). Mean ± SE. *p<0.05. (D) A schematic illustration of proposed model, showing OGT regulation of SREBP-1 protein and phosphorylation via regulation of AMPK that regulates lipid metabolism and cancer growth and survival.

References

    1. Boroughs LK, DeBerardinis RJ. Metabolic pathways promoting cancer cell survival and growth. Nat Cell Biol. 2015 Apr;17(4):351–9. - PMC - PubMed
    1. Hart GW, Housley MP, Slawson C. Cycling of O-linked beta-N-acetylglucosamine on nucleocytoplasmic proteins. Nature. 2007 Apr 26;446(7139):1017–22. - PubMed
    1. Wellen KE, Thompson CB. Cellular metabolic stress: considering how cells respond to nutrient excess. Mol Cell. 2010 Oct 22;40(2):323–32. - PMC - PubMed
    1. Varki A, Cummings R, Esko J, et al. Essentials of Glycobiology. Cold Spring Harbor, NY: Cold Spring Harbor Laboratory Press; 1999. The O-GlcNAc Modification.
    1. Ozcan S, Andrali SS, Cantrell JE. Modulation of transcription factor function by O-GlcNAc modification. Biochim Biophys Acta. 2010 May-Jun;1799(5–6):353–64. - PMC - PubMed

Publication types

MeSH terms