. 2017 Oct 23;13(10):e1007071.
doi: 10.1371/journal.pgen.1007071. eCollection 2017 Oct.

Profiling RNA-Seq at multiple resolutions markedly increases the number of causal eQTLs in autoimmune disease

Affiliations

Profiling RNA-Seq at multiple resolutions markedly increases the number of causal eQTLs in autoimmune disease

Christopher A Odhams et al. PLoS Genet. .

Abstract

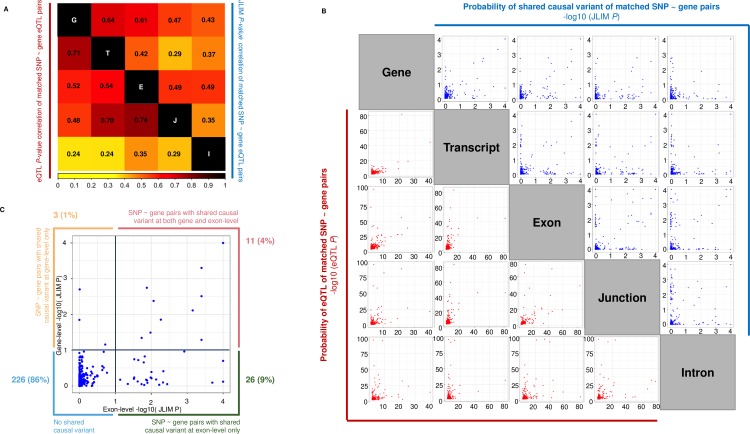
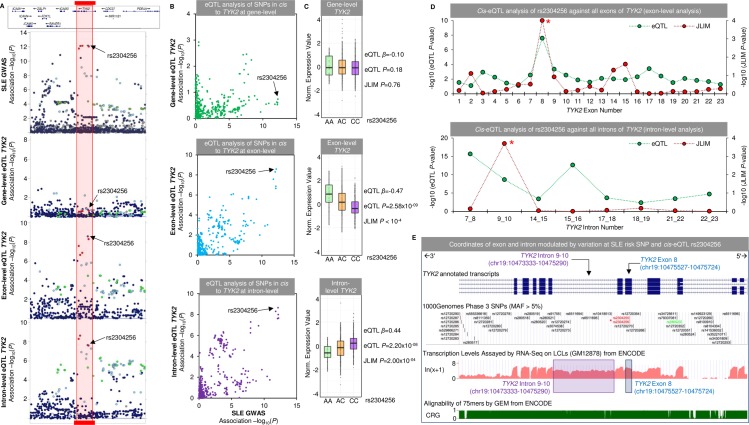
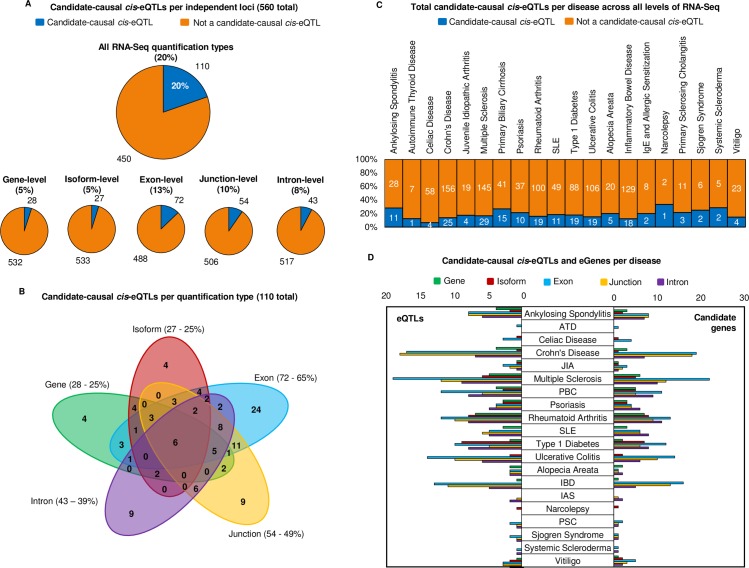
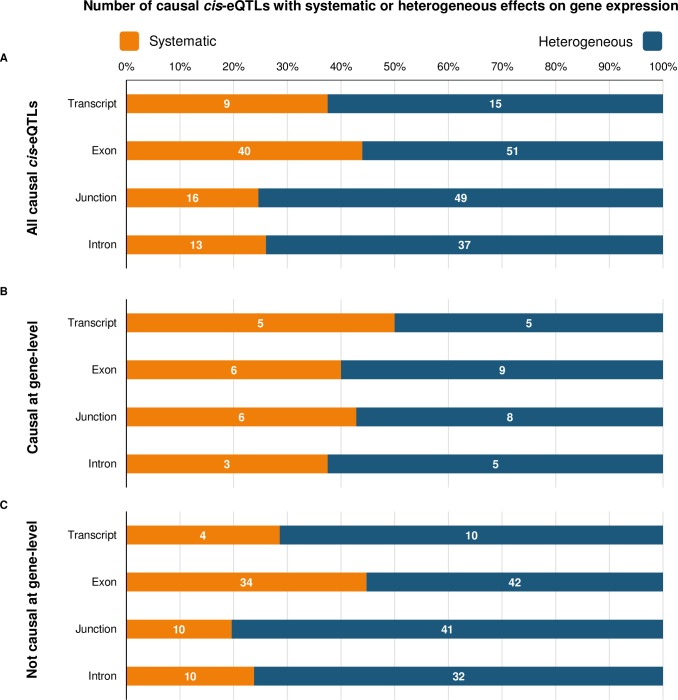
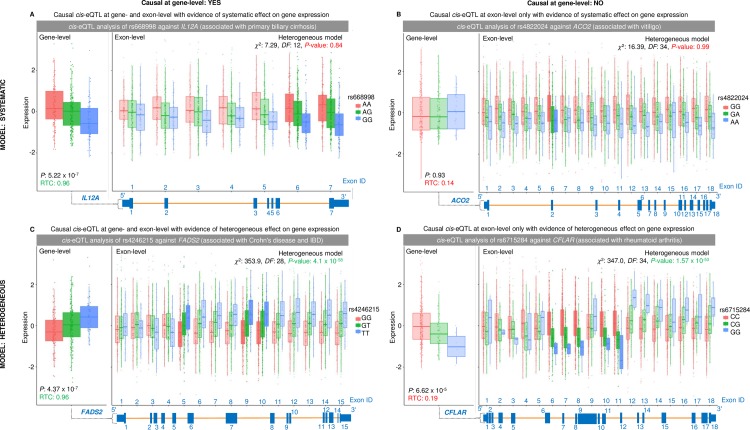
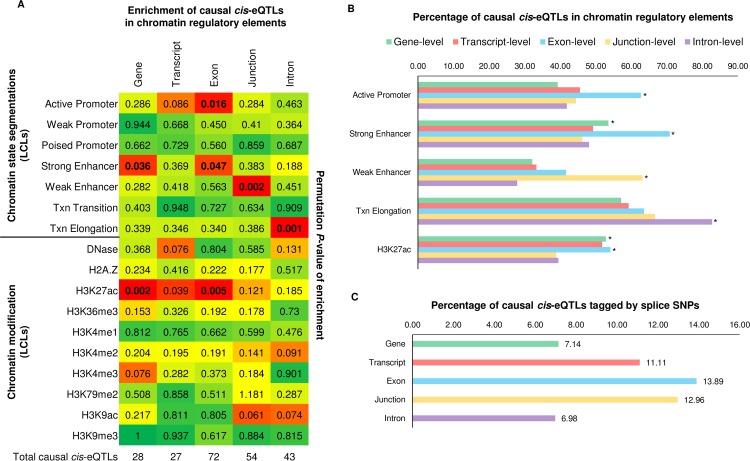
Genome-wide association studies have identified hundreds of risk loci for autoimmune disease, yet only a minority (~25%) share genetic effects with changes to gene expression (eQTLs) in immune cells. RNA-Seq based quantification at whole-gene resolution, where abundance is estimated by culminating expression of all transcripts or exons of the same gene, is likely to account for this observed lack of colocalisation as subtle isoform switches and expression variation in independent exons can be concealed. We performed integrative cis-eQTL analysis using association statistics from twenty autoimmune diseases (560 independent loci) and RNA-Seq data from 373 individuals of the Geuvadis cohort profiled at gene-, isoform-, exon-, junction-, and intron-level resolution in lymphoblastoid cell lines. After stringently testing for a shared causal variant using both the Joint Likelihood Mapping and Regulatory Trait Concordance frameworks, we found that gene-level quantification significantly underestimated the number of causal cis-eQTLs. Only 5.0-5.3% of loci were found to share a causal cis-eQTL at gene-level compared to 12.9-18.4% at exon-level and 9.6-10.5% at junction-level. More than a fifth of autoimmune loci shared an underlying causal variant in a single cell type by combining all five quantification types; a marked increase over current estimates of steady-state causal cis-eQTLs. Causal cis-eQTLs detected at different quantification types localised to discrete epigenetic annotations. We applied a linear mixed-effects model to distinguish cis-eQTLs modulating all expression elements of a gene from those where the signal is only evident in a subset of elements. Exon-level analysis detected disease-associated cis-eQTLs that subtly altered transcription globally across the target gene. We dissected in detail the genetic associations of systemic lupus erythematosus and functionally annotated the candidate genes. Many of the known and novel genes were concealed at gene-level (e.g. IKZF2, TYK2, LYST). Our findings are provided as a web resource.


Conflict of interest statement

The authors have declared that no competing interests exist.

Figures

Fig 1
Fig 1. Pairwise comparison of cis-eQTL and JLIM P-values for matched SNP-gene pairs.
This figure is complementary to the data in Table 2 and is derived from cis-eQTL analysis of the 38 SLE associated SNPs using RNA-Seq and implementation of the JLIM method to assess evidence of a shared causal variant. (A) We measured the Pearson’s correlation separately of all cis-eQTL and JLIM P-values between matched SNP-gene cis-eQTL pairs across the five RNA-Seq quantification types. We only considered matched SNP-gene cis-eQTL association pairs that had a nominal cis-eQTL association P-value < 0.01 in both quantification types, and to be conservative, when multiple transcripts, exons, junctions, and introns were annotated with the same gene symbol, we selected the associations that minimized the difference in JLIM P-value between matched SNP-gene cis-eQTLs across RNA-Seq quantification types. Note the weak JLIM P-value correlation of matched transcript-level and junction-level cis-eQTLs suggesting they stem from independent causal variants. (B) Correlation plots of matches SNP-gene cis-eQTL pairs as described above (red: cis-eQTL P-value; blue: JLIM P-value). Note that JLIM P-values often aggregate on the axis rather than on the diagonal suggesting independent causal variants across different quantification types. (C) An example of the sensitivity of exon-level analysis relative to gene-level. The majority of nominally significant JLIM P-values (<0.01) for matched SNP-gene pairs are captured by exon-level analysis and concealed at gene-level (green box: 9%).
Fig 2
Fig 2. Isolation of potential causal molecular mechanism in TYK2 by SLE cis-eQTL rs2304256.
(A) SLE GWAS association plot and cis-eQTL association plot around the 19p13.2 susceptibility locus tagged by rs2304256. The top panel shows the association plot with SLE that spans the gene body and 3′ region of TYK2 (Tyrosine Kinase 2). The haplotype block composed of highly correlated SNPs is highlighted in the red block. The second panel shows the cis-eQTL association plot at gene-level of all proximal SNPs to TYK2 (no significant association with rs2304256 is detected). The third panel shows the same regional association but at exon-level for the most associated exon of TYK2 with rs2304256 –the bottom panel is at intron-level for TYK2 (both are highly associated). (B) Correlation of SLE GWAS P-value and cis-eQTL association P-value for all SNPs in cis to TYK2. We show at gene-level the most associated SLE SNPs are not cis-eQTLs (top panel). The middle and bottom panels show the same correlation at exon-level and intron-level and reveal the most associated SNPs to SLE are also the most associated cis-eQTLs to TYK2. (C) The direction of effect of cis-eQTL rs2304256 with TYK2 at gene-level (top), exon-level (middle), and intron-level (bottom panel). The risk allele is rs2304256 [C]. (D) The top panel shows cis-eQTL association and JLIM P-values for all exons of TYK2 against rs2304256. Exon 8 (marked by an asterisk) is defined as having a causal association with rs2304256. The bottom panel shows the intron-level cis-eQTL of TYK2 against rs2304256. Note many introns are cis-eQTLs but are not causal with rs2304256. Exons and introns are numbered consecutively from start to end of gene if they are expressed (note some are not and therefore not included). (E) The genomic location of the single exon and single intron of TYK2 that are modulated by rs2304256 are highlighted (rs2304256 is marked by an asterisk in red). The bottom two panels show the transcription levels assayed by RNA-Seq on LCLs assayed by ENCODE. Note intron 9–10 of TYK2 is clearly expressed. The alignability of 75-mers by GEM is also shown to show the mapability of reads around rs2304256.
Fig 3
Fig 3. Breakdown of autoimmune associated causal cis-eQTLs using RNA-Seq.
(A) Percentage and number of causal cis-eQTL associations detected per RNA-Seq quantification type, following LD pruning of associated SNPs from twenty autoimmune diseases to 560 independent susceptibly loci. The top chart shows the number of causal cis-eQTLs when combining all RNA-Seq profiling types together (20%). (B) Sharing of causal cis-eQTL associations per quantification type (110 detected in total). Percentage of causal cis-eQTLs captured are shown as a percentage of the 110 total. (C) Total causal cis-eQTLs per disease across all five levels of RNA-Seq quantification, using the 20 diseases of the ImmunoBase resource. In orange are disease-associated SNPs that show no shared association with expression across any quantification type. In blue are the disease-associated SNPs that are also causal cis-eQTLs. (D) Causal cis-eQTLs and candidate genes per disease broken down by quantification type.
Fig 4
Fig 4. Number of causal cis-eQTLs with systematic or heterogeneous effects.
(A) Using a modified test of heterogeneity that accounts for the dependency structure arising from within-individual and within-gene expression correlations, we distinguished causal cis-eQTLs that fitted either a systematic gene-model (orange) or a heterogeneous gene-model (blue) per quantification type. The full results of this analysis are found in S7 Table. Numbers represent the total number of SNP-gene associations per quantification type. (B) Causal cis-eQTLs that are also causal cis-eQTLs at gene-level. (C) Causal cis-eQTLs that are not causal cis-eQTLs at gene-level.
Fig 5
Fig 5. Examples of causal cis-eQTLs with systematic or heterogeneous effects on expression.
This figure shows exon-level analysis using a modified test of heterogeneity to distinguish systematic causal cis-eQTLs and heterogeneous cis-eQTLs. It then stratifies these results based on whether the association is detected at gene-level or not. Each panel shows the gene-level association with cis-eQTL association P-value and RTC score (RTC > = 0.95 is deemed causal, highlighted in green), the exon-level association for each exon of the gene against the cis-eQTL, the heterogeneous model output from the likelihood ratio test with χ2 statistic, degrees of freedom (DF), and model P-value (highlighted in red is heterogeneous, green is systematic), and finally the collapsed gene model underneath with labelled exons. N.B box-plots in a darker shade are those that are deemed to be causal associations (PBF < 0.05 & RTC > = 0.95). (A) Systematic cis-eQTL detected at gene-level (B) systematic cis-eQTL not detected at gene-level (C) heterogeneous cis-eQTL detected at gene-level (D) heterogeneous cis-eQTL not detected at gene-level.
Fig 6
Fig 6. Functional annotation of causal autoimmune cis-eQTLs.
(A) We took the causal autoimmune cis-eQTLs detected for each RNA-Seq quantification type and performed enrichment testing for chromatin state segmentation and histone marks in LCLs taken from the NIH Roadmap Epigenomics Project. We used the GoShifter algorithm to do this (see methods); which takes all SNPs in strong LD (r2>0.8) with the causal cis-eQTLs and calculates the proportion of SNPs overlapping chromatin marks, the positions of the marks are then shuffled whilst retaining the SNP positions, and the fraction of overlap recalculated over 1,000 permutations. A permutation P-value is then generated–which is annotated in each box (P<0.05 deemed significant). The heat colour is representative of the permutation P-value. Significant enrichment tests are highlighted in bold. The total number of causal cis-eQTLs per quantification type are annotated at the bottom of the heatmap. (B) The percentage of causal cis-eQTLs in chromatin regulatory marks per quantification type. An asterisk shows that this level of enrichment is deemed to be significant as shown in panel A. (C) The percentage of causal cis-eQTLs in chromatin regulatory marks per quantification type that are or are highly correlated (r2>0.8) with SNPs that alter splice site consensus sequences of the target genes (assessed by Sequence Ontology for the hg19 GENCODE v12 reference annotation).

References

    1. Fever FM. NIH Progress in Autoimmune Diseases Research. in National Institute of Health Publication. 2005; 17–7576.
    1. Parkes M, Cortes A, van Heel DA, Brown MA. Genetic insights into common pathways and complex relationships among immune-mediated diseases. Nat Rev Genet. Nature Publishing Group; 2013;14: 661–73. doi: 10.1038/nrg3502 - DOI - PubMed
    1. Hindorff LA, Sethupathy P, Junkins HA, Ramos EM, Mehta JP, Collins FS, et al. Potential etiologic and functional implications of genome-wide association loci for human diseases and traits. Proc Natl Acad Sci U S A. 2009;106: 9362–9367. doi: 10.1073/pnas.0903103106 - DOI - PMC - PubMed
    1. Westra H-J, Franke L. From genome to function by studying eQTLs. Biochim Biophys Acta. Elsevier B.V.; 2014;1842: 1896–1902. doi: 10.1016/j.bbadis.2014.04.024 - DOI - PubMed
    1. Klionsky DJ. Crohn’s disease, autophagy, and the Paneth cell. N Engl J Med. 2009;360: 1785–1786. doi: 10.1056/NEJMcibr0810347 - DOI - PMC - PubMed