

The complex relationship between oligoclonal bands, lymphocytes in the cerebrospinal fluid, and immunoglobulin G antibodies in multiple sclerosis: Indication of serum contribution
- PMID: 29059249
- PMCID: PMC5653326
- DOI: 10.1371/journal.pone.0186842
The complex relationship between oligoclonal bands, lymphocytes in the cerebrospinal fluid, and immunoglobulin G antibodies in multiple sclerosis: Indication of serum contribution
Abstract
Introduction: Intrathecal immunoglobulin G (IgG) and oligoclonal bands (OCBs) are the most consistent and characteristic features of Multiple Sclerosis (MS). OCBs in MS are considered products of clonally expanded B cells in the cerebrospinal fluid (CSF), representing the sum of contributions from B cells in the brain. However, large amounts of IgG can be eluted from MS plaques in which lymphocytes are absent, and there is no correlation between levels of plaque-associated IgG and the presence of lymphocytes. It is calculated that it would take 3.2 billion lymphocytes to generate such large amounts of intrathecal IgG (30 mg in 500 ml CSF) in MS patients. Therefore, circulating lymphocytes in CSF could only account for <0.1% of the extra IgG in MS.
Methods: We analyzed clinical laboratory parameters from sera and CSF of 115 patients including 91 patients with MS and 24 patients with other inflammatory central nervous system (CNS) disorders (IC). We investigated the relationship between oligoclonal bands, IgG antibodies, CSF cells, IgG Index, albumin, and total protein.
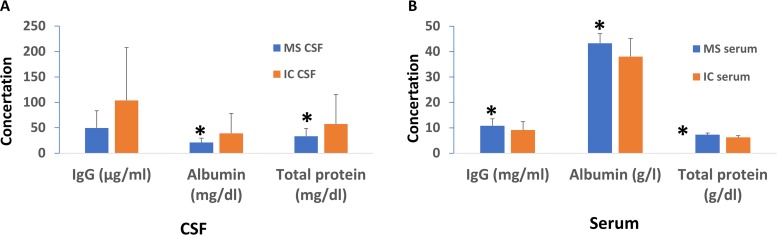
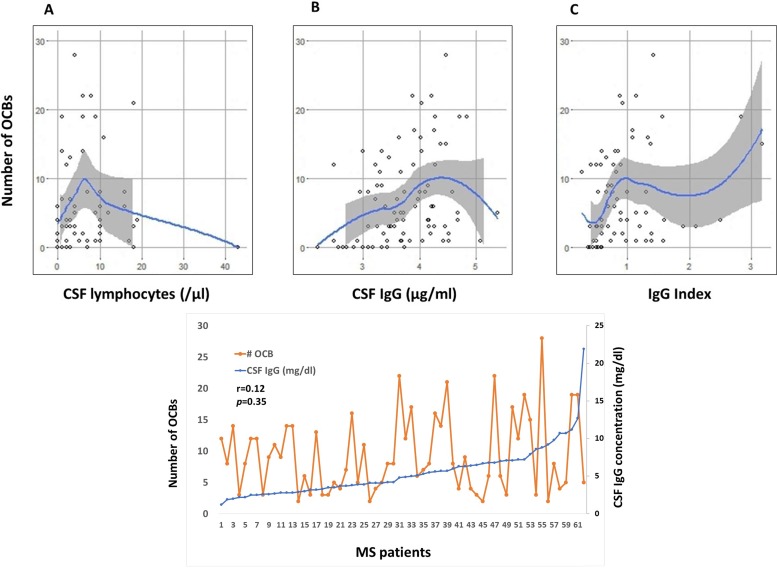
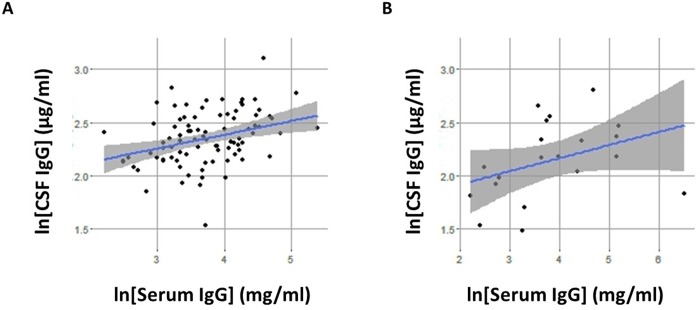
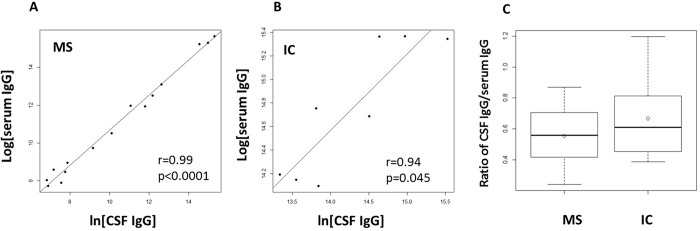
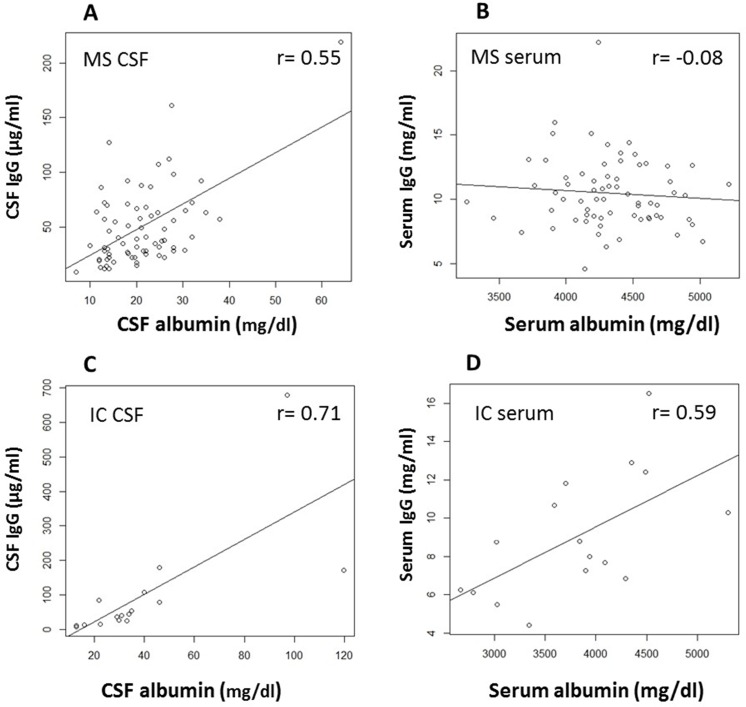
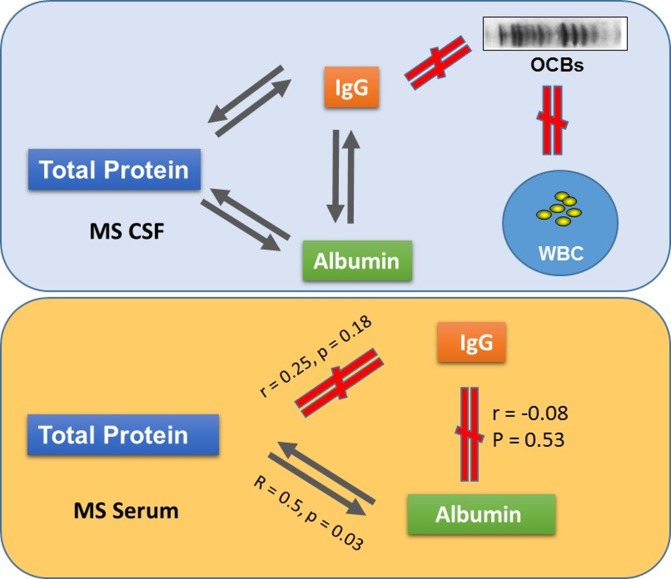
Results: MS patients have significantly elevated serum concentrations of IgG antibodies, albumin, and total protein, lower levels of lymphocytes, albumin, and total protein in the cerebrospinal fluid, but no difference in CSF IgG concentration compared to those with other inflammatory neurological disorders. Furthermore, in MS there was no linear relationship between the numbers of OCBs, CSF lymphocytes, CSF IgG, and IgG Index, and between serum IgG and serum albumin, but significant correlation between IgG in CSF and serum, and between CSF IgG and CSF albumin.
Conclusion: There are unique differences between MS and patients with other inflammatory neurological disorders. Our data suggest that in MS patient (a) B cells and their products in the CSF may not be the sole source of intrathecal IgG; (b) oligoclonal bands may not be the products of single B cell clones in the CSF; and (c) there is a strong connection between serum components in the peripheral circulation and the central nervous system.
Conflict of interest statement
Figures
Similar articles
-
MS and clinically isolated syndromes: shared specificity but diverging clonal patterns of virus-specific IgG antibodies produced in vivo and by CSF B cells in vitro.Eur J Neurol. 2009 Oct;16(10):1124-9. doi: 10.1111/j.1468-1331.2009.02657.x. Epub 2009 May 14. Eur J Neurol. 2009. PMID: 19469834
-
Elevated antibody reactivity to measles virus NCORE protein among patients with multiple sclerosis and their healthy siblings with intrathecal oligoclonal immunoglobulin G production.J Clin Virol. 2014 Sep;61(1):107-12. doi: 10.1016/j.jcv.2014.06.011. Epub 2014 Jun 20. J Clin Virol. 2014. PMID: 25022622
-
Oligoclonal bands in multiple sclerosis cerebrospinal fluid: an update on methodology and clinical usefulness.J Neuroimmunol. 2006 Nov;180(1-2):17-28. doi: 10.1016/j.jneuroim.2006.07.006. Epub 2006 Sep 1. J Neuroimmunol. 2006. PMID: 16945427 Review.
-
Effects of natalizumab on oligoclonal bands in the cerebrospinal fluid of multiple sclerosis patients: a longitudinal study.Mult Scler. 2014 Dec;20(14):1900-3. doi: 10.1177/1352458514538111. Epub 2014 Jun 16. Mult Scler. 2014. PMID: 24948690
-
Oligoclonal bands: An immunological and clinical approach.Adv Clin Chem. 2022;109:129-163. doi: 10.1016/bs.acc.2022.03.004. Epub 2022 Apr 22. Adv Clin Chem. 2022. PMID: 35953125 Review.
Cited by
-
Multiple sclerosis plasma IgG aggregates induce complement-dependent neuronal apoptosis.Cell Death Dis. 2023 Apr 8;14(4):254. doi: 10.1038/s41419-023-05783-3. Cell Death Dis. 2023. PMID: 37031195 Free PMC article.
-
Aberrant Immunoglobulin G Glycosylation in Multiple Sclerosis.J Neuroimmune Pharmacol. 2022 Jun;17(1-2):218-227. doi: 10.1007/s11481-021-09996-1. Epub 2021 May 3. J Neuroimmune Pharmacol. 2022. PMID: 33942224 Free PMC article.
-
A Patient With Encephalomyeloradiculoneuropathy Exhibiting a Relapsing-Remitting Clinical Course: Correlation of Serum and Cerebrospinal Fluid Anti-Neutral Glycosphingolipids Antibodies With Clinical Relapse.Front Neurol. 2018 Apr 4;9:206. doi: 10.3389/fneur.2018.00206. eCollection 2018. Front Neurol. 2018. PMID: 29670569 Free PMC article.
-
Oligoclonal Bands as Predictors of Disease Severity and Prognosis in Anti-NMDAR Encephalitis.J Inflamm Res. 2025 Aug 13;18:11009-11020. doi: 10.2147/JIR.S535684. eCollection 2025. J Inflamm Res. 2025. PMID: 40827266 Free PMC article.
-
Selective plasma exchange for multiple sclerosis with optic neuritis.Neurol Clin Pract. 2020 Aug;10(4):e38-e40. doi: 10.1212/CPJ.0000000000000735. Neurol Clin Pract. 2020. PMID: 32983623 Free PMC article. No abstract available.
References
-
- Joseph FG, Hirst CL, Pickersgill TP, Ben-Shlomo Y, Robertson NP, Scolding NJ. CSF oligoclonal band status informs prognosis in multiple sclerosis: a case control study of 100 patients. Journal of neurology, neurosurgery, and psychiatry. 2009;80(3):292–6. doi: 10.1136/jnnp.2008.150896 . - DOI - PubMed
-
- Tintore M, Rovira A, Rio J, Tur C, Pelayo R, Nos C, et al. Do oligoclonal bands add information to MRI in first attacks of multiple sclerosis? Neurology. 2008;70(13 Pt 2):1079–83. doi: 10.1212/01.wnl.0000280576.73609.c6 . - DOI - PubMed
-
- Calabrese M, Poretto V, Favaretto A, Alessio S, Bernardi V, Romualdi C, et al. Cortical lesion load associates with progression of disability in multiple sclerosis. Brain: a journal of neurology. 2012;135(Pt 10):2952–61. doi: 10.1093/brain/aws246 . - DOI - PubMed
-
- Ferreira D, Voevodskaya O, Imrell K, Stawiarz L, Spulber G, Wahlund LO, et al. Multiple sclerosis patients lacking oligoclonal bands in the cerebrospinal fluid have less global and regional brain atrophy. J Neuroimmunol. 2014;274(1–2):149–54. doi: 10.1016/j.jneuroim.2014.06.010 . - DOI - PubMed
-
- Lefranc D, Almeras L, Dubucquoi S, de Seze J, Vermersch P, Prin L. Distortion of the self-reactive IgG antibody repertoire in multiple sclerosis as a new diagnostic tool. J Immunol. 2004;172(1):669–78. . - PubMed
MeSH terms
Substances
LinkOut - more resources
Full Text Sources
Other Literature Sources
Medical
