. 2018 Feb;29(2):477-491.
doi: 10.1681/ASN.2017040385. Epub 2017 Oct 23.

Progressive Renal Disease Established by Renin-Coding Adeno-Associated Virus-Driven Hypertension in Diverse Diabetic Models

Affiliations

Progressive Renal Disease Established by Renin-Coding Adeno-Associated Virus-Driven Hypertension in Diverse Diabetic Models

Shannon M Harlan et al. J Am Soc Nephrol. 2018 Feb.

Abstract

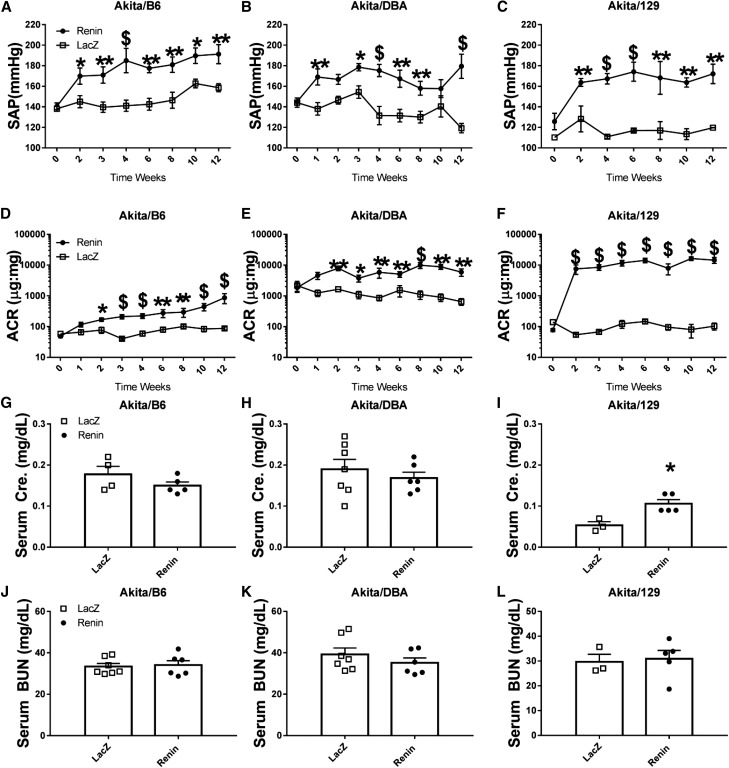
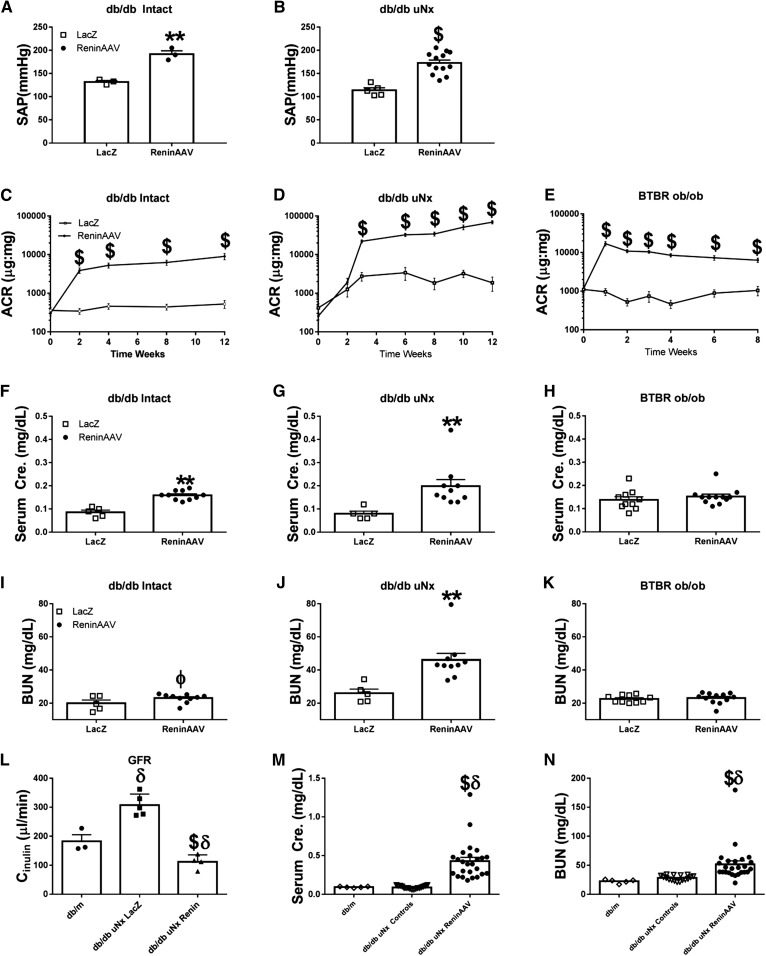
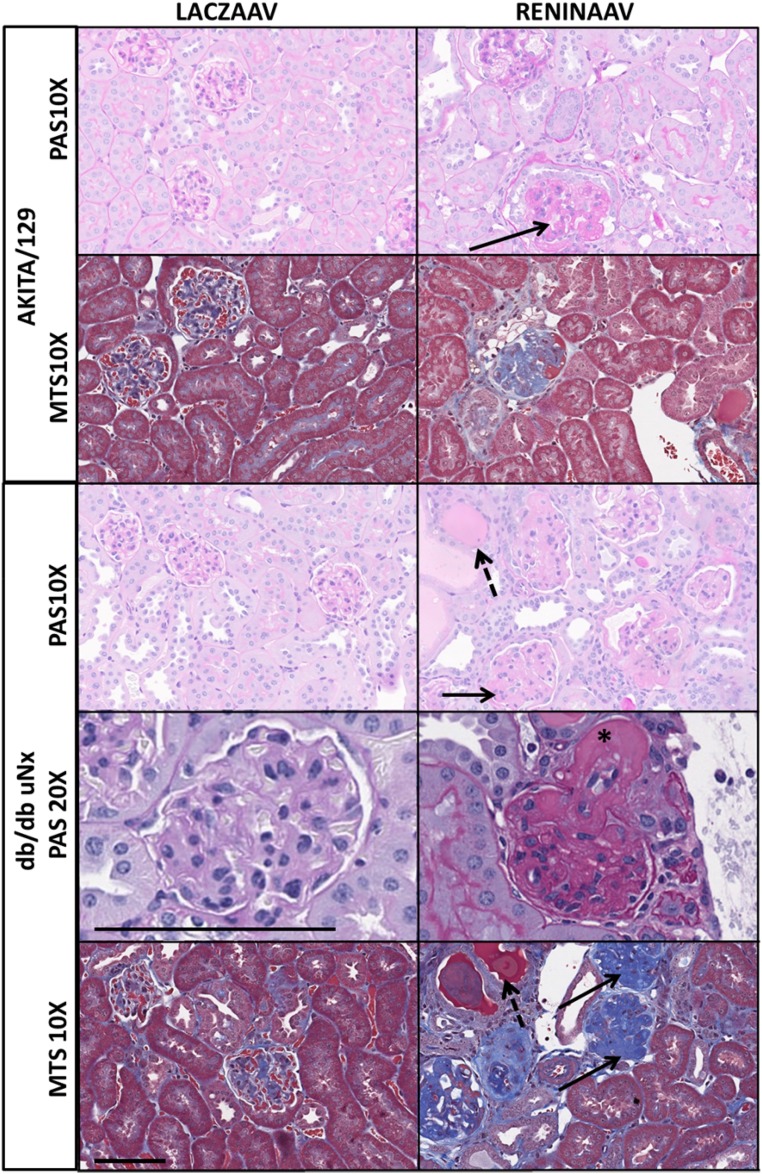
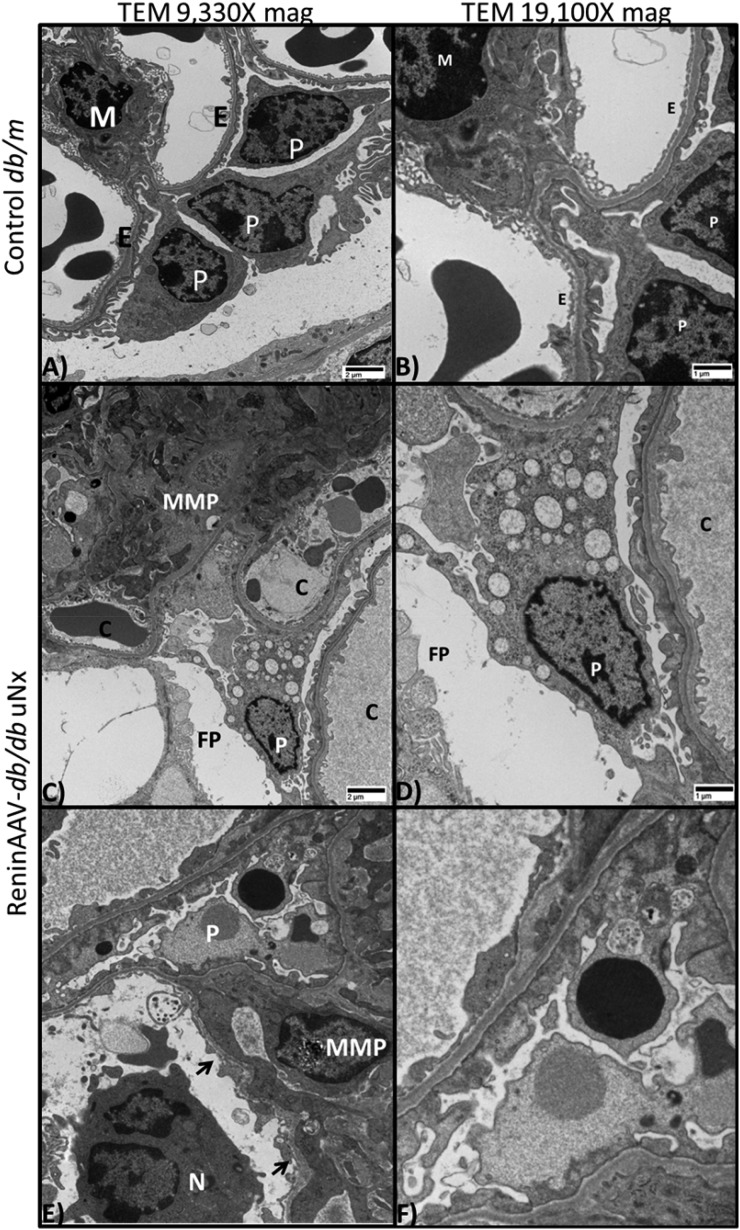
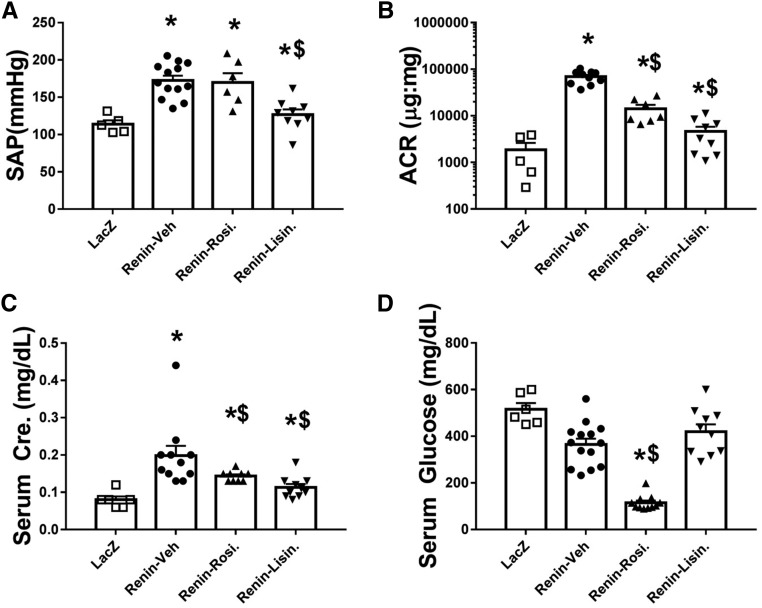
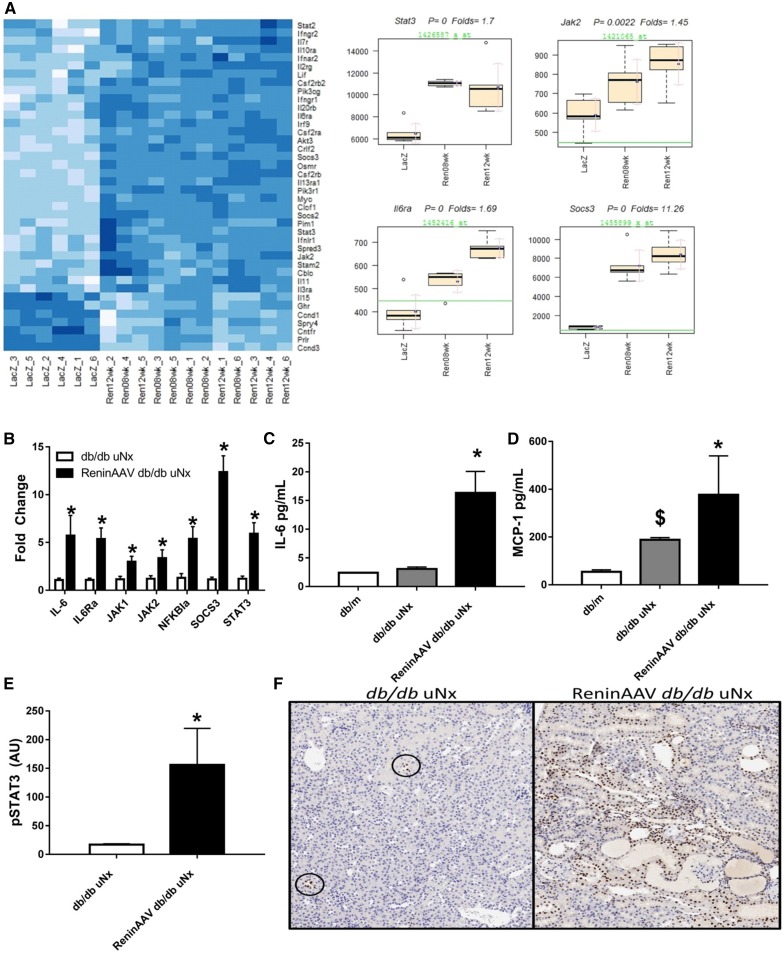
Progress in research and developing therapeutics to prevent diabetic kidney disease (DKD) is limited by a lack of animal models exhibiting progressive kidney disease. Chronic hypertension, a driving factor of disease progression in human patients, is lacking in most available models of diabetes. We hypothesized that superimposition of hypertension on diabetic mouse models would accelerate DKD. To test this possibility, we induced persistent hypertension in three mouse models of type 1 diabetes and two models of type 2 diabetes by adeno-associated virus delivery of renin (ReninAAV). Compared with LacZAAV-treated counterparts, ReninAAV-treated type 1 diabetic Akita/129 mice exhibited a substantial increase in albumin-to-creatinine ratio (ACR) and serum creatinine level and more severe renal lesions. In type 2 models of diabetes (C57BKLS db/db and BTBR ob/ob mice), compared with LacZAAV, ReninAAV induced significant elevations in ACR and increased the incidence and severity of histopathologic findings, with increased serum creatinine detected only in the ReninAAV-treated db/db mice. The uninephrectomized ReninAAV db/db model was the most progressive model examined and further characterized. In this model, separate treatment of hyperglycemia with rosiglitazone or hypertension with lisinopril partially reduced ACR, consistent with independent contributions of these disorders to renal disease. Microarray analysis and comparison with human DKD showed common pathways affected in human disease and this model. These results identify novel models of progressive DKD that provide researchers with a facile and reliable method to study disease pathogenesis and support the development of therapeutics.

Keywords: chronic diabetic complications; diabetic glomerulopathy; diabetic nephropathy; electron microscopy; hypertension.


Figures

Figure 1.
Figure 1.
ReninAAV in type 1 diabetic Akita models accelerates renal disease. ReninAAV (1×10¹⁰ GC) elevated SAP, with effects that were detected within 1–2 weeks of injection and persisted for 12 weeks in Akita mice of three different genetic backgrounds (A) Akita/B6, (B) Akita/DBA, and (C) Akita/129 compared with respective LacZAAV controls. (D–F) ReninAAV increased ACR in all three genetic backgrounds within 2 weeks postinjection and remained elevated for the 12-week duration, with modest effects detected in Akita/B6 mice and most significant changes observed in Akita/129 mice compared with respective LacZ controls. Serum creatinine was unchanged in (G) ReninAAV Akita/B6 and (H) Akita/DBA mice, but it was statistically elevated in (I) ReninAAV Akita/129 mice compared with respective LacZAAV controls. (J–L) ReninAAV did not have a significant effect on serum BUN in any Akita strain tested. n=3–10 per group. *P<0.05; **P<0.01; $P<0.001.
Figure 2.
Figure 2.
ReninAAV in type 2 diabetic models accelerates renal disease. (A and B) ReninAAV (5×10⁹ GC) significantly elevated SAP of db/db intact and uNx mice compared with respective LacZAAV controls. ReninAAV elevated ACR in (C) db/db intact, (D) db/db uNx, and (E) BTBR-ob/ob mice, with effects typically detected within 1 week postinjection and persisting for the duration of the study. ReninAAV led to statistically significant elevations in serum creatinine in (F) db/db intact and (G) db/db uNx mice but not the (H) BTBR-ob/ob. (I–K) ReninAAV elevated serum BUN only in db/db uNx mice with no detectable changes in db/db intact or BTBR-ob/ob mice. (L) GFR was measured by FITC-inulin clearance in ReninAAV db/db uNx mice with an approximate doubling of serum creatinine and compared with db/m leans and LacZ db/db uNx controls. (L) GFR was significantly reduced in ReninAAV db/db uNx mice compared with both db/m and LacZ db/db uNx controls, whereas LacZ db/db uNx controls were significantly elevated compared the db/m mice. (M and N) Compiled data of serum creatinine and BUN from ReninAAV db/db uNx mice after 11–12 weeks of ReninAAV shows that over 55% of mice have advanced renal disease as shown by over fourfold increases in serum creatinine and further elevations in BUN. n=5+ mice per group. **P<0.01 by t test only and not more stringent analysis versus LacZ db/db uNx controls; $P<0.001 by t test only and not more stringent analysis versus LacZ db/db uNx controls; ϕP=0.05 by t test only and not more stringent analysis versus LacZ db/db uNx controls; δP<0.01 versus db/m.
Figure 3.
Figure 3.
ReninAAV leads to renal pathologic changes in most strains tested, with the most pronounced effect observed in db/db uNx and Akita/129 mice. Representative photomicrographs of kidney sections stained with periodic acid–Schiff (PAS) or Masson trichrome (MTS) from mice 12 weeks postinjection of LacZAAV or ReninAAV in Akita/129 or db/db uNx mice. Solid arrows highlight mesangial matrix expansion, dashed arrows indicate tubular protein, and asterisk highlights arterial hyalinosis. Images were taken at ×10 or ×20 magnification. Scale bar, 100 μm.
Figure 4.
Figure 4.
ReninAAV db/db uNx mice exhibit ultrastructural changes observed in DKD. (A and B) Transmission electron micrograph of glomerulus from a healthy db/m control kidney with numerous intact podocytes (P) and basement membranes lined by intact endothelial cells (Es) with normal fenestrations. (A and B) A single mesangial cell (M) appears in the upper left quadrant. (C–F) Transmission electron micrograph of glomerulus from a ReninAAV db/db uNx mouse. (C and D) Extensive mesangial matrix proliferation (MMP) composed of amorphous and occasional fibrillary densities; three capillary profiles (Cs) are shown with thickened endothelium and irregular basement membranes with fused and expanded P foot processes (FPs). (C–F) Ps undergoing vacuolar degeneration; reactive endothelium lining capillaries (arrows) and neutrophil (N) infiltration were detected in the ReninAAV db/db uNx mice. n=6 mice evaluated per group. Scale bar, 1 or 2 μM.
Figure 5.
Figure 5.
ReninAAV db/db uNx mice respond to standard of care treatment. Mice were injected with ReninAAV and allowed to progress until ACR reached approximately 20,000 μg/mg; they were then treated with vehicle (Veh), rosiglitazone (Rosi), or lisinopril (Lisin). (A) ReninAAV-Veh, ReninAAV-Lisin, and ReninAAV-Rosi had significantly elevated AP compared with LacZ controls. ReninAAV-Lisin had significantly lower AP compared with the ReninAAV-Veh group. (B) All ReninAAV-injected groups had ACR values significantly elevated from LacZ controls. Treatment with lisinopril significantly reduced ACR compared with ReninAAV-Veh. Rosiglitazone treatment halted progression, and ACR was lower than Renin-Veh. (C) Serum creatinine was elevated in ReninAAV-Veh and all ReninAAV-treated groups compared with LacZ controls. Treatment with lisinopril and rosiglitazone significantly lowered serum creatinine compared with in ReninAAV-Veh mice. (D) Serum glucose levels were significantly lowered in the Renin-Rosi group only compared with either control group (LacZ or ReninAAV-Veh). n=10–15 mice per group. *P<0.05 compared with LacZ control; $P<0.05 compared with ReninAAV-Veh group.
Figure 6.
Figure 6.
JAK/STAT pathway is upregulated in the ReninAAV db/db uNx model of DKD. (A) Microarray analysis identified the JAK/STAT pathway as a top pathway upregulated in ReninAAV db/db uNx mice at both 8 and 12 weeks of ReninAAV treatment compared with LacZ db/db uNx controls, including Stat3, Jak2, IL6Ra, and Socs3. (B) Taqman analysis verified microarray data and showed that genes of the JAK/STAT pathway are upregulated in ReninAAV db/db uNx mice compared with LacZ controls. (C and D) Serum IL-6 and MCP-1 were upregulated in ReninAAV db/db uNx mice compared with db/m or db/db uNx controls. (E) Protein expression of pSTAT3 is upregulated in ReninAAV db/db uNx mice compared with LacZ controls. (F) Immunostaining-identified pSTAT3 is increased in renal tubule epithelium and infiltrating leukocytes compared with LacZ controls, with circles highlighting low-level detection in LacZ groups. n=5+ per group. *P<0.05 versus LacZ db/db uNx control; $P<0.05 versus db/m.

References

    1. Wanner C, Inzucchi SE, Lachin JM, Fitchett D, von Eynatten M, Mattheus M, Johansen OE, Woerle HJ, Broedl UC, Zinman B; EMPA-REG OUTCOME Investigators : Empagliflozin and progression of kidney disease in type 2 diabetes. N Engl J Med 375: 323–334, 2016 - PubMed
    1. Conway BR, Rennie J, Bailey MA, Dunbar DR, Manning JR, Bellamy CO, Hughes J, Mullins JJ: Hyperglycemia and renin-dependent hypertension synergize to model diabetic nephropathy. J Am Soc Nephrol 23: 405–411, 2012 - PMC - PubMed
    1. Van Buren PN, Toto R: Hypertension in diabetic nephropathy: Epidemiology, mechanisms, and management. Adv Chronic Kidney Dis 18: 28–41, 2011 - PMC - PubMed
    1. Betz B, Conway BR: Recent advances in animal models of diabetic nephropathy. Nephron, Exp Nephrol 126: 191–195, 2014 - PubMed
    1. Giunti S, Barit D, Cooper ME: Mechanisms of diabetic nephropathy: Role of hypertension. Hypertension 48: 519–526, 2006 - PubMed

MeSH terms