. 2017 Dec 5;372(1735):20160419.
doi: 10.1098/rstb.2016.0419.

The origin of heredity in protocells

Affiliations

The origin of heredity in protocells

Timothy West et al. Philos Trans R Soc Lond B Biol Sci. .

Abstract

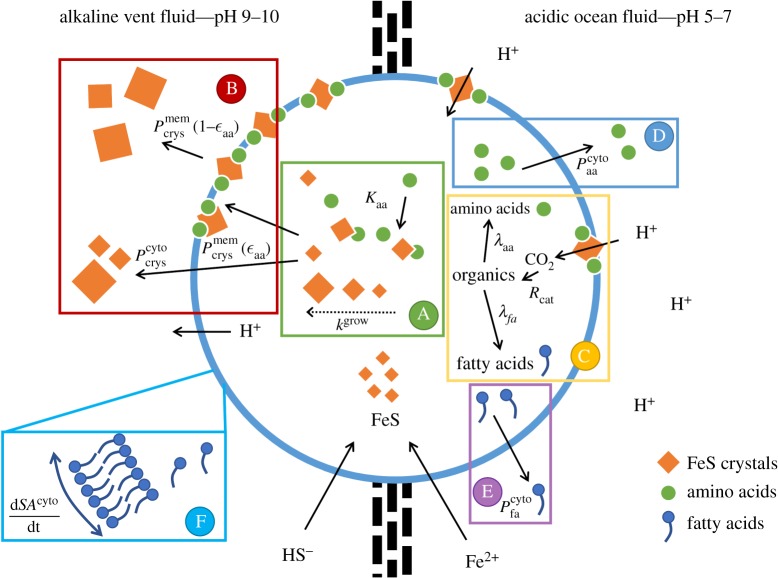
Here we develop a computational model that examines one of the first major biological innovations-the origin of heredity in simple protocells. The model assumes that the earliest protocells were autotrophic, producing organic matter from CO2 and H2 Carbon fixation was facilitated by geologically sustained proton gradients across fatty acid membranes, via iron-sulfur nanocrystals lodged within the membranes. Thermodynamic models suggest that organics formed this way should include amino acids and fatty acids. We assume that fatty acids partition to the membrane. Some hydrophobic amino acids chelate FeS nanocrystals, producing three positive feedbacks: (i) an increase in catalytic surface area; (ii) partitioning of FeS nanocrystals to the membrane; and (iii) a proton-motive active site for carbon fixing that mimics the enzyme Ech. These positive feedbacks enable the fastest-growing protocells to dominate the early ecosystem through a simple form of heredity. We propose that as new organics are produced inside the protocells, the localized high-energy environment is more likely to form ribonucleotides, linking RNA replication to its ability to drive protocell growth from the beginning. Our novel conceptualization sets out conditions under which protocell heredity and competition could arise, and points to where crucial experimental work is required.This article is part of the themed issue 'Process and pattern in innovations from cells to societies'.

Keywords: RNA world; composome; origin of life; protocell.


Conflict of interest statement

We declare we have no competing interests.

Figures

Figure 1.
Figure 1.
Model of FeS-catalyzed growth dynamics within a protocell. FeS nanocrystals spontaneously form from the reaction of Fe2+ from ocean waters and HS from hydrothermal fluids. (A) FeS nanocrystal growth and chelation by amino acids. (B) Crystal fluxes between the cytosol, membrane and external sink. Nanocrystal partitioning to the membrane depends on the presence of amino acids in the cytosol. (C) Amino acid-associated FeS nanocrystals embedded in the membrane (on the ocean side only) use the geological proton gradient to drive reduction of CO2 and formation of new organics inside the protocell. Amino acids (D) and fatty acids (E) are also subject to leak permeabilities towards the external sink. (F) Protocell growth is facilitated by the addition of newly generated lipids to the membrane, producing an increase in cell surface area. See Appendix A for more details.
Figure 2.
Figure 2.
Parameters controlling protocell growth. The figure shows the effect of varying catalytic activity (Rcat) and amino acid binding affinity (Kaa) for FeS crystals. (a) Time courses for simulations computed for five parameter combinations corresponding to the five coloured sample points shown in (b) and (c). Parameters were chosen to demonstrate the dependence of crystal growth, production of organics, partitioning of FeS nanocrystals to the membrane, and growth in protocell surface area upon combinations of catalytic turnover rates and amino acid binding strengths. The correspondence of line colours to the parameter space are given in the bottom legend (see main text for more details). Parameter values: 1, fast catalysis (Rcat = 10−9.4 mol dm–2 s–1) tight binding (Kaa = 10–4.3 mol dm3); 2, fast catalysis (Rcat = 10−9.4 dm–2 s–1) weak binding (Kaa = 10–2.2 mol dm–3); 3, slow catalysis (Rcat = 10−11.6 mol dm–2 s–1) tight binding (Kaa = 10−4.3 mol dm3); 4, slow catalysis (Rcat = 10−11.6 mol dm–2 s–1) weak binding (Kaa = 10−2.2 mol dm–3); 5, medium catalysis (Rcat = 10−10.4 mol dm–2 s–1) medium binding (Kaa = 10–3.7 mol dm–3). (b) Parameter space representation of the protocell equilibrium surface area (cm2). Results demonstrate that the extent of cell growth is largely determined by the catalytic activity of the FeS crystals. (c) Parameter space representation of the rate of cell growth (cm2 day−1) during the growth period. Cases in which there was no growth are covered by the white section in the bottom half of the figure.
Figure 3.
Figure 3.
Protocell division as a function of amino acid binding. At a threshold cell surface area of 10–9 cm2, the cell divides and cytosol constituents are reorganized. The rate of growth depends on the strength of amino acid binding (Kaa). The blue curve shows tight binding (Kaa = 10–4.3 mol dm–3), the red curve shows weaker binding (Kaa = 10–2.7 mol dm–3) and the green curve shows the weakest binding considered (Kaa = 10–2 mol dm–3). (a) Time course of crystal volume evolution. So long as intracellular amino acids are conserved across a protocell division, FeS nanocrystal chelation can continue. (b) Dynamics of membrane-bound crystal concentration demonstrates that a loss of half of membrane crystals during division is not sufficient to significantly slow cell growth. (c) Protocell surface area dynamics indicating growth and division in the case of the two tightest binding coefficients (blue and red curves) compared with no growth (green). Protocell division intervals decrease until the catalytic activity of the cell reaches equilibrium. The turnover rate was held constant for all three simulations (Rcat = 10−10.4 mol dm−2 s−1).

References

    1. Joyce GF. 2002. The antiquity of RNA-based evolution. Nature 418, 214–221. (10.1038/418214a) - DOI - PubMed
    1. Wochner A, Attwater J, Coulson A, Holliger P. 2011. Ribozyme-catalysed transcription of an active ribozyme. Science 332, 209–212. (10.1126/science.1200752) - DOI - PubMed
    1. Higgs PG, Lehman N. 2015. The RNA world: molecular cooperation at the origins of life. Nat. Rev. Genet. 16, 7–17. (10.1038/nrg3841) - DOI - PubMed
    1. Orgel LE. 2004. Prebiotic chemistry and the origin of the RNA world. Crit. Rev. Biochem. Mol. Biol. 39, 99–123. (10.1080/10409230490460765) - DOI - PubMed
    1. Woese CR. 1967. The genetic code: the molecular basis for genetic expression. New York, NY: Harper & Row.

LinkOut - more resources