. 2017 Oct 23;8(1):1090.
doi: 10.1038/s41467-017-00942-5.

Survival of pancreatic cancer cells lacking KRAS function

Affiliations

Survival of pancreatic cancer cells lacking KRAS function

Mandar Deepak Muzumdar et al. Nat Commun. .

Abstract

Activating mutations in the proto-oncogene KRAS are a hallmark of pancreatic ductal adenocarcinoma (PDAC), an aggressive malignancy with few effective therapeutic options. Despite efforts to develop KRAS-targeted drugs, the absolute dependence of PDAC cells on KRAS remains incompletely understood. Here we model complete KRAS inhibition using CRISPR/Cas-mediated genome editing and demonstrate that KRAS is dispensable in a subset of human and mouse PDAC cells. Remarkably, nearly all KRAS deficient cells exhibit phosphoinositide 3-kinase (PI3K)-dependent mitogen-activated protein kinase (MAPK) signaling and induced sensitivity to PI3K inhibitors. Furthermore, comparison of gene expression profiles of PDAC cells retaining or lacking KRAS reveal a role of KRAS in the suppression of metastasis-related genes. Collectively, these data underscore the potential for PDAC resistance to even the very best KRAS inhibitors and provide insights into mechanisms of response and resistance to KRAS inhibition.


Conflict of interest statement

The authors declare no competing financial interests.

Figures

Fig. 1
Fig. 1
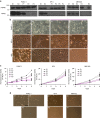
KRAS is dispensable for in vitro and in vivo proliferation of PDAC cells. a Western blot confirmed loss of KRAS protein in knockout clones (A13-K1,K2, 8988T-H9,H36) compared to intact clones (A13-E1,E2, 8988T E3, E6). HSP90 is loading control. b RAS-GTP levels were decreased in knockout (8988T-H9 and A13-K1,K2) compared to intact (8988T E3 and A13-E1,E2) clones. GTPγS (non-hydrolysable)-treated positive control (GTP PD) and GDP-treated negative control (GDP PD) for 8988T E3 are shown. PD pull-down. Inp input before pull-down. c KRAS deficient clones exhibited altered cell morphology, characterized by increased cell size, cytoplasmic translucency, and smooth edges. Scale bar is 100 µm. d KRAS deficient clones showed diminished anchorage-independent growth in soft agar. Scale bar is 500 µm. e Growth curves for A13 and 8988T KRAS intact and deficient (KO) clones. Average cell viability (normalized to day 0) ± s.e.m. is plotted for A13 (n = 2 clones) and 8988T (n = 4 clones). f A13, 8988T, and PANC-1 clones exhibited comparable efficiency generating tumors following subcutaneous transplant in nude mice regardless of KRAS status. Shown are cumulative data from two KRAS intact and two deficient clones for A13 and 8988T and one intact and one deficient clone for PANC-1. g A13 KRAS deficient tumors grew at a slower rate than intact tumors. Average tumor volume fold increase (normalized to day 0 when tumors were ~0.5 cm in diameter) ± s.e.m. is plotted (n = 8 tumors per group)
Fig. 2
Fig. 2
KRAS is dispensable in a subset of PDAC cell lines. a Western blot confirmed loss of KRAS protein in knockout clones derived from PANC-1 (P2 complete, P3 partial), KP-4 (P1, P2, P3, P4), and MM1402 (H1, H2) cell lines compared to intact clones (PANC-1-E1,E2; KP-4-E1,E2; MM1402-E1,E2,E3). HSP90 is loading control. b KRAS deficient clones (purple) exhibited altered cell morphology compared to intact cells (gray). Specific differences include increased cell size, cytoplasmic translucency, and smooth edges. Scale bar is 100 µm. c KRAS deficient clones showed diminished proliferation in vitro. Average cell viability (normalized to day 0) ± s.e.m. for each clone is plotted. PANC-1 knockout clone (P2) and partial knockout clone (P3) exhibited a dose-dependent effect of KRAS expression on proliferation compared to intact clones (E1, E2). d PANC-1, KP-4, and MM1402 KRAS deficient clones showed diminished soft agar colony formation. PANC-1 cells displayed a dose-dependent effect of KRAS expression on anchorage-independent growth. Scale bar is 500 µm
Fig. 3
Fig. 3
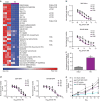
KRAS deficient cells are dependent on PI3K. a Heat map of area under the curve (AUC) for KRAS intact and deficient (KO) clones (columns) treated with various compounds. Row normalized data are presented with red designating high AUC (less sensitive) and blue denoting low AUC (more sensitive). Shown are hit compounds (see “Methods” section) exhibiting greater sensitivity in KRAS deficient cells listed in order of ΔAUC from highest to lowest. PI3K and mTOR inhibitors are noted. See Supplementary Data 4 for full data set. b Dose-response curves of 8988T KRAS intact (gray) and deficient (purple) cells to the pan-PI3K inhibitors GDC-0941 and BAY80-6946. Each replicate (n = 3 for each dose) and curve fit are shown. c Increased apoptosis (change in percentage Annexin V-positive cells vs. DMSO) in KRAS deficient (KO) cells 48 h after 2 μM GDC-0941 treatment. Average ± s.e.m. is plotted (n = 2 clones per group). *p < 0.05, two-tailed Student’s t test. d Dose-response curves of A13 cells to pan-PI3K inhibitors. Each replicate (n = 3 for each dose) and curve fit are shown. e GDC-0941 significantly decreased the growth rate of KRAS deficient (KO) but not intact A13 transplanted tumors in nude mice. Average tumor volume fold increase (normalized to start of treatment at day 0) ± s.e.m. (n = 8 tumors per group) is plotted. *p < 0.05, **p < 0.01, two-tailed Student’s t test for measurements at each time point comparing GDC-0941 to vehicle
Fig. 4
Fig. 4
PI3K inhibition functions through AKT-dependent and -independent mechanisms. a Western blot showed stable pERK1/2 but increased pAKT and pPRAS40 levels in 8988T and A13 KRAS deficient (purple) cells, consistent with PI3K/AKT pathway activation. HSP90 is loading control. b Dose-response curves of 8988T and A13 KRAS intact (gray) and deficient (purples) clones to the pan-AKT inhibitor MK2206. Each replicate (n = 3 for each dose) and curve fit are shown. c Western blot showed sustained phosphorylation of AKT and downstream targets (PRAS40, S6, and 4EBP1) only in myr-AKT1- and myr-AKT2-expressing cells but not in myr-AKT1 (K179M)- or control GFP-expressing cells following 4 h of 2 μM GDC-0941 treatment. d Dose-response curves of cell lines in c treated with GDC-0941 and BAY80-6946 demonstrated a marked decrease in PI3K sensitivity with myr-AKT1 or myr-AKT2 overexpression. Each replicate (n = 3 for each dose) and curve fit are shown
Fig. 5
Fig. 5
MAPK blockade following PI3K inhibition in KRAS deficient cells. a Western blot showed no change in pERK1/2 levels in KRAS intact cells at designated times (minutes for A13, hours for 8988T) following GDC-0941 treatment. HSP90 is loading control. b Western blot demonstrated a transient decrease in pERK1/2 levels in KRAS deficient cells at designated times (minutes for A13, hours for 8988T) following GDC-0941 treatment. c Western blot showed a transient decrease in phosphorylation of the MAPK pathway regulators CRAF and MEK1/2 following GDC-0941 treatment in KRAS deficient cells. d Western blot of RAS-GTP levels in KRAS intact (E6) and deficient (H36) clones following 1-h treatment with GDC-0941 showed a specific decline in deficient cells. e Overexpression of constitutively active MEK (MEK-DD) or oncogenic KRAS-G12V, but not KRAS-WT or GFP, blocked pERK1/2 inhibition by a 4-h treatment with GDC-0941. f MEK-DD and KRAS-G12V-transduced cells from e showed decreased sensitivity to PI3K inhibition compared to control GFP- and KRAS-WT-transduced cells
Fig. 6
Fig. 6
PI3K inhibition enhances cap-dependent translation inhibition in KRAS deficient cells. a Schematic of cap-dependent translation reporter construct. 5′-LTR 5′ long terminal repeat of MSCV virus with promoter activity. In transduced cells, mCherry expression correlates with cap-dependent translation and GFP expression correlates with cap-independent translation initiated via an internal ribosomal entry site (IRES). b FACS plots of GFP and mCherry fluorescence in KRAS intact and deficient (KO) cells. KRAS deficient cells exhibited a greater decrease in mCherry (relative to GFP) expression when treated for 24 h with GDC-0941 (2 μM) or the mTORC1/2 inhibitor AZD8055 (100 nM) than intact cells. Triangle gates were drawn along the midline diagonal of the FACS plots of DMSO-treated cells and maintained in plots of drug treatment. Numbers denote percentages of cells within gate and is inversely related to cap-dependent translation of reporter. c FACS plots of GFP and mCherry fluorescence in KRAS deficient cells transduced with myr-AKT1 or myr-AKT1 (K179M). Wild-type AKT1 expression decreased the effect of GDC-0941 on cap-dependent translation compared to its kinase-dead variant
Fig. 7
Fig. 7
Combined KRAS and PI3K inhibition as a therapeutic approach in PDAC cells. a Schematic of lentiviral constructs to express Cas9 and a doxycycline (DOX)-inducible sgRNA targeting KRAS (sgKRAS). PeF1a ubiquitously expressed elongation factor 1a promoter. 2A self-cleaving peptide. Blast blasticidin resistance gene. TRE tetracycline-responsive element. PH1/TO H1 promoter with Tet-operator sites. PUb-P ubiquitin promoter. tetR Tet-repressor. DOX treatment relieves tetR repression of H1 promoter to permit sgKRAS expression. Western blot showed complete KRAS protein ablation in two different A13 mmKras.366 clones after 7 days of DOX treatment in vitro. b Combined KRAS (by DOX-inducible mmKras.366) and PI3K (by GDC-0941) inhibition in established subcutaneous tumors effectively inhibited tumor growth, whereas inhibition of KRAS or PI3K alone was insufficient to suppress tumor growth long term. Average tumor volume fold increase (normalized to start of DOX treatment, pooled for both clones in a) ± s.e.m. (n = 10 tumors per group) is plotted. Dashed line denotes bliss independence for additive effect of DOX and GDC-0941, consistent with synergism starting at day 11. **p < 0.01, two-tailed Student’s t test, DOX + GDC-0941 vs. Vehicle only at end of experiment. ***p < 0.001, two-tailed Student’s t test, DOX + GDC-0941 vs. DOX + Vehicle at end of experiment. c Western blot confirmed loss of KRAS protein in knockout clones derived from PACO19 (H11, H13, H17) and PACO9 (H12) compared to intact clones (PACO19-E6,E9; PACO9-E5,E20). HSP90 is loading control. d KRAS alleles from PACO19 and PACO9 clones showed out-of-frame indels in KRAS deficient clones. Reference corresponds to UCSC hg19 sequence. All clones retained a single indel allele except for PACO19 H13 for which two different indels were identified, one of which was a 95 bp deletion that is not pictured in full. The purple and orange bars denote the sgRNA and PAM sequences, respectively. e Dose-response curves of PACO19 and PACO9 KRAS intact (gray) and deficient (purple) clones to the pan-PI3K inhibitor GDC-0941. Each replicate (n = 3 for each dose) and curve fit are shown. f Western blot showed a decrease in pERK1/2 levels in KRAS deficient (H13) but not intact (E6) clones derived from PACO19 cells following GDC-0941 treatment
Fig. 8
Fig. 8
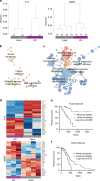
Multiple dysregulated cellular processes in KRAS deficient cells. a Unsupervised hierarchical clustering dendrograms of 8988T and A13 clones indicated clean segregation between KRAS intact and deficient (KO) cells within each cell line. b Network representation of overlapping enriched GSEA/MSigDB gene sets in the A13 knockout signature (p < 0.05, FDR < 0.25). Each circle represents a gene set with circle size corresponding to gene set size and intensity corresponding to enrichment significance. Red is upregulated and blue is downregulated. Each line corresponds to minimum 50% mutual overlap with line thickness corresponding to degree of overlap. Cellular processes associated with related gene sets are listed. c Network representation of overlapping enriched GSEA/MSigDB gene sets in the 8988T knockout signature (p < 0.005, FDR < 0.1). d Heat map of a 32-gene combined knockout signature generated through ICA analysis of A13 and 8988T gene expression data sets. Gene names are listed in rows. Row normalized gene expression values are shown where red designates relative upregulation and blue designates relative downregulation. e Kaplan–Meier plots of survival of human patients from the TCGA PDAC cohort whose tumors most correlated (top quintile) and least correlated (bottom quintile) with the combined knockout signature in d (UP genes only). Log-rank (Mantel–Cox) p value is shown. f Kaplan–Meier plots of survival of human patients from the ICGC cohort whose tumors most correlated (top quintile) and least correlated (remaining tumors) with the combined knockout signature in d (UP genes only). Log-rank (Mantel–Cox) p value is shown
Fig. 9
Fig. 9
KRAS knockout signatures correlate with CTC gene expression. a Unsupervised hierarchical clustering and ICA analysis of single cell RNA-Seq data from Ting et al. using circulating tumor cells (CTCs) and primary tumor cells from a Kras;p53 mutant mouse model. ICA analysis identified a signature (component 1 (IC1) in Hinton diagram) that distinguished CTCs from primary tumors (p < 0.01, Mann–Whitney U-test). b GSEA plots of 8988T and A13 knockout signatures (top/bottom 2% genes) enriched in ICA-derived CTC signature shown above. Normalized enrichment scores (NES) and p values are listed for each gene set. c Significantly enriched MSigDB gene sets in CTCs include genes downregulated (DN) following KRAS expression in the KrasLA2 lung cancer mouse model (Sweet), mouse fibroblasts (Chiaradonna), and in primary human lung and breast epithelial cells (KRAS.600). NES, p values, and FDR are listed for each gene set
Fig. 10
Fig. 10
KRAS knockout signature overlaps with subtype-specific signatures of PDAC. a Univariate and multivariable Cox proportional hazards models on overall survival in the entire TCGA PDAC cohort, including clinical covariates and gene expression signatures, revealed that the combined KRAS knockout signature was independently associated with worse survival. Hazard ratios (HR) and p values (Cox regression) are reported. A comparison between a model with and without an interaction term (likelihood ratio test) was used to determine independence (p > 0.05) between significant covariates in multivariable analysis and the combined KRAS knockout signature. b Kaplan–Meier plots of survival in human PDAC patients from the TCGA cohort based on tumors most correlated (top quintile) and least correlated (bottom quintile) with the quasi-mesenchymal (QM) subtype from Collisson et al., basal subtype signature from Moffitt et al., and the squamous subtype signature from Bailey et al. (n = 33 most correlated and n = 33 least correlated tumors). Log-rank (Mantel–Cox) p values are shown. c Tables show percentage of tumor/patient overlap of top (most correlated) and bottom (least correlated) quintiles of tumors (out of n = 33 per group) in each signature. Green shading corresponds to degree of overlap (white = 0%, dark green = 100%). p values for significance of overlap (between n = 33 groups) within the TCGA PDAC cohort (out of 166 total tumors) are also shown (hypergeometric test). Red shading corresponds to significance of overlap (white = 0.05, dark red = minimum p value)

References

    1. American Cancer Society. Cancer Facts & Figures 2017 (American Cancer Society, Atlanta, 2017).
    1. Ryan DP, Hong TS, Bardeesy N. Pancreatic adenocarcinoma. NEJM. 2014;371:1039–1049. doi: 10.1056/NEJMra1404198. - DOI - PubMed
    1. Conroy T, et al. FOLFIRINOX versus gemcitabine for metastatic pancreatic cancer. N. Engl. J. Med. 2011;364:1817–1825. doi: 10.1056/NEJMoa1011923. - DOI - PubMed
    1. Von Hoff DD, et al. Increased survival in pancreatic cancer with nab-paclitaxel plus gemcitabine. N. Engl. J. Med. 2013;369:1691–1703. doi: 10.1056/NEJMoa1304369. - DOI - PMC - PubMed
    1. Hezel AF, Kimmelman AC, Stanger BZ, Bardeesy N, DePinho RA. Genetics and biology of pancreatic ductal adenocarcinoma. Genes Dev. 2006;20:1218–1249. doi: 10.1101/gad.1415606. - DOI - PubMed

Publication types

MeSH terms

Substances