. 2017 Oct 23;8(1):1093.
doi: 10.1038/s41467-017-00962-1.

High grade serous ovarian carcinomas originate in the fallopian tube

Affiliations

High grade serous ovarian carcinomas originate in the fallopian tube

S Intidhar Labidi-Galy et al. Nat Commun. .

Abstract

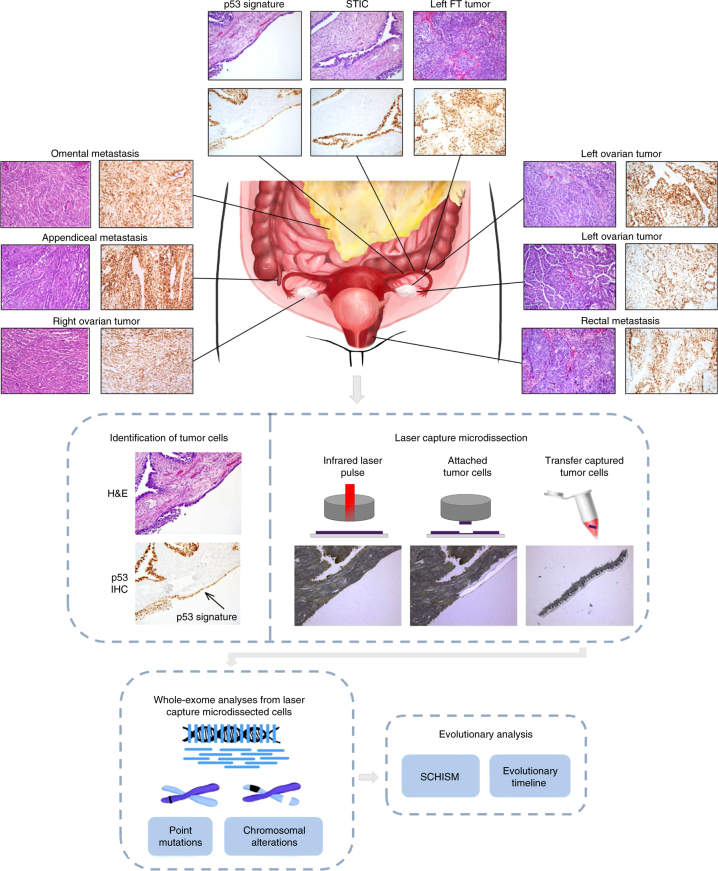
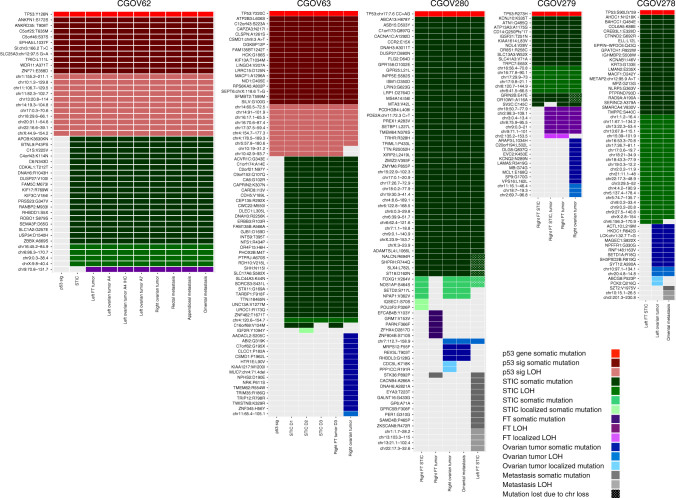
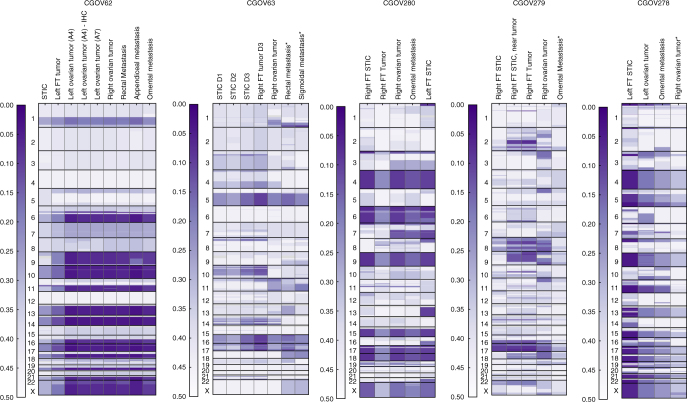
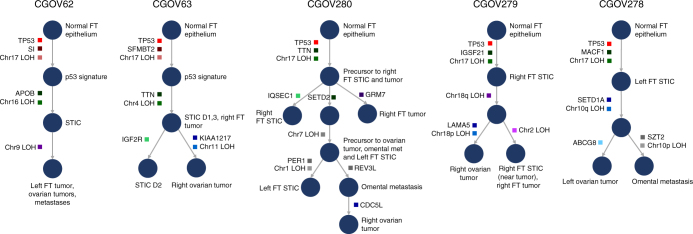
High-grade serous ovarian carcinoma (HGSOC) is the most frequent type of ovarian cancer and has a poor outcome. It has been proposed that fallopian tube cancers may be precursors of HGSOC but evolutionary evidence for this hypothesis has been limited. Here, we perform whole-exome sequence and copy number analyses of laser capture microdissected fallopian tube lesions (p53 signatures, serous tubal intraepithelial carcinomas (STICs), and fallopian tube carcinomas), ovarian cancers, and metastases from nine patients. The majority of tumor-specific alterations in ovarian cancers were present in STICs, including those affecting TP53, BRCA1, BRCA2 or PTEN. Evolutionary analyses reveal that p53 signatures and STICs are precursors of ovarian carcinoma and identify a window of 7 years between development of a STIC and initiation of ovarian carcinoma, with metastases following rapidly thereafter. Our results provide insights into the etiology of ovarian cancer and have implications for prevention, early detection and therapeutic intervention of this disease.


Conflict of interest statement

V.E.V. is a founder of Personal Genome Diagnostics and is a member of its Scientific Advisory Board and Board of Directors. V.E.V. owns Personal Genome Diagnostics stock, which is subject to certain restrictions under university policy. The terms of this arrangement is managed by the Johns Hopkins University in accordance with its conflict of interest policies. The remaining authors declare no competing financial interests.

Figures

Fig. 1
Fig. 1
Schematic of sample isolation and next-generation sequencing analyses. (Top panel) Tumor sites analyzed from CGOV62 with stage III HGSOC. For each sample, slides were stained with hematoxylin and eosin as well as analyzed by immunohistochemical staining of p53. (Middle panel) Tumor samples were microdissected for genomic analyses. For microdissection for STIC and p53 signature lesions, tumor cells were identified using immunohistochemical staining of p53 and isolated through laser capture microdissection. (Bottom panel, left) Next-generation sequencing analyses were performed for tumor specimens using either whole-exome or targeted analyses. (Bottom panel, right) Somatic mutations and chromosomal alterations were used to evaluate tumor evolution using the tumor subclonality phylogenetic reconstruction algorithm SCHISM and to determine a timeline for tumor progression
Fig. 2
Fig. 2
Somatic mutation and allelic imbalance profiles among different tumor lesions. Somatic mutations and segments of allelic imbalance detected by whole-exome analyses are indicated as colored cells in rows for all patients. Darker shades of each color indicate somatic mutations while lighter shades indicate allelic imbalances. The tumor samples analyzed for each patient are indicated in columns (p53 sig, p53 signature; STIC, serous tubal intraepithelial carcinoma). For ovarian tumors in CGOV62 and STIC lesions in CGOV63 multiple blocks are indicated, including one ovarian tumor where multiple sections were analyzed after hematoxylin and eosin staining or after immunohistochemistry (IHC) staining of p53. These analyses indicated that staining methods did not affect detection of somatic alterations. The color of mutations indicates the degree of relatedness among tumor samples: red, shared among all tumor samples with TP53 highlighted at the top row; green, shared among all tumor samples except p53 signature lesion; purple, shared among fallopian tube tumor and omental metastasis; blue indicates mutations that were first detected in the ovarian tumors; and gray indicates mutations that were only detected in metastatic lesions. Additional color shades or patterns indicate mutations that are localized to specific lesions or lost due to chromosome loss as shown in the legend
Fig. 3
Fig. 3
Genome-wide allelic imbalance profile. Minor allele frequency of heterozygous SNPs identified from normal tissue in each patient are derived in each tumor sample, enabling assessment of allelic imbalance in ~17,000 loci across the exome. Circular binary segmentation (CBS) is applied to minor allele frequencies of SNPs with minimum coverage of 10× in each tumor sample, and the resulting segment means are shown as a heatmap. Asterisks indicate samples where corresponding mutation analyses were not performed due to low tumor purity (omental metastasis of CGOV279, right ovarian tumor of CGOV278) or miliary pattern of tumor samples (peritoneal metastases of CGOV63). Given the relatively lower number of distinct DNA molecules available from the p53 signature samples from CGOV62 and CGOV63, these samples were subjected to a more sensitive LOH analysis (Methods, Genome-wide imbalance analysis) and are not shown here
Fig. 4
Fig. 4
Schematic of tumor evolution. The history of tumor evolution in each patient is modeled as a subclonal hierarchy inferred from the somatic mutations and large scale genomic regions harboring loss of heterozygosity (LOH features) using the SCHISM framework, and is depicted as a tree. Each tree starts from a root node corresponding to the normal fallopian tube epithelium (germline). In all patients, mutations in TP53 (red boxes) are among the earliest somatic alterations and are ubiquitously present in all tumor samples. Somatic alterations (boxes) are acquired along edges (arrows) of the tree, and example alterations are indicated in each case. Nodes of the tree represent cells whose genotype is described by the presence of somatic mutations and LOH features on the path connecting the node to the root of the tree. Each node is labeled with tumor samples harboring all upstream and lacking any downstream alterations. The trees inferred for all patients support a pattern of evolution with p53 signatures and STIC lesions as early events in tumorigenesis. Mutation clusters and LOH feature groups follow the same color code as Fig. 2

References

    1. Ferlay J, et al. Cancer incidence and mortality patterns in Europe: estimates for 40 countries in 2012. Eur. J. Cancer. 2013;49:1374–1403. doi: 10.1016/j.ejca.2012.12.027. - DOI - PubMed
    1. Siegel RL, Miller KD, Jemal A. Cancer statistics, 2015. CA Cancer J. Clin. 2015;65:5–29. doi: 10.3322/caac.21254. - DOI - PubMed
    1. Cress RD, Chen YS, Morris CR, Petersen M, Leiserowitz GS. Characteristics of long-term survivors of epithelial ovarian cancer. Obstet. Gynecol. 2015;126:491–497. doi: 10.1097/AOG.0000000000000981. - DOI - PMC - PubMed
    1. Menon U, Griffin M, Gentry-Maharaj A. Ovarian cancer screening--current status, future directions. Gynecol. Oncol. 2014;132:490–495. doi: 10.1016/j.ygyno.2013.11.030. - DOI - PMC - PubMed
    1. Jacobs IJ, et al. Ovarian cancer screening and mortality in the UK Collaborative Trial of Ovarian Cancer Screening (UKCTOCS): a randomised controlled trial. Lancet. 2016;387:945–956. doi: 10.1016/S0140-6736(15)01224-6. - DOI - PMC - PubMed

Publication types

MeSH terms