. 2017 Oct 23;7(1):13823.
doi: 10.1038/s41598-017-14076-7.

Optogenetic Neuronal Silencing in Drosophila during Visual Processing

Affiliations

Optogenetic Neuronal Silencing in Drosophila during Visual Processing

Alex S Mauss et al. Sci Rep. .

Abstract

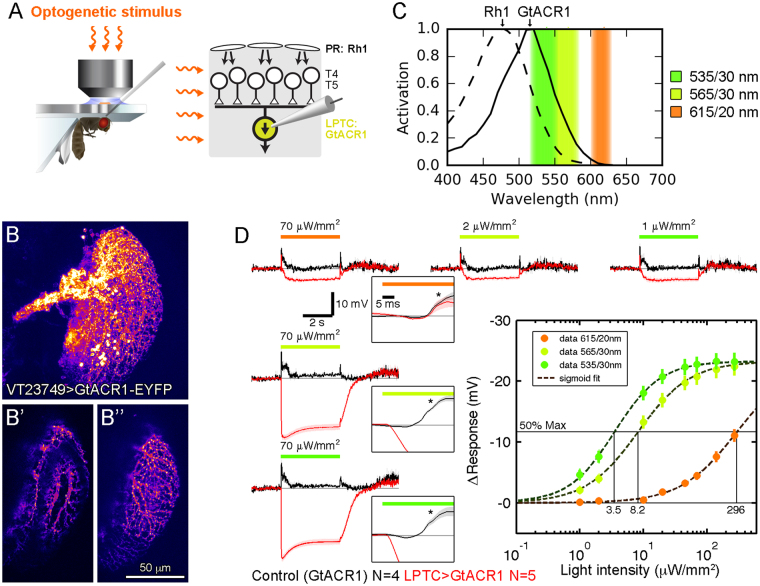
Optogenetic channels and ion pumps have become indispensable tools in neuroscience to manipulate neuronal activity and thus to establish synaptic connectivity and behavioral causality. Inhibitory channels are particularly advantageous to explore signal processing in neural circuits since they permit the functional removal of selected neurons on a trial-by-trial basis. However, applying these tools to study the visual system poses a considerable challenge because the illumination required for their activation usually also stimulates photoreceptors substantially, precluding the simultaneous probing of visual responses. Here, we explore the utility of the recently discovered anion channelrhodopsins GtACR1 and GtACR2 for application in the visual system of Drosophila. We first characterized their properties using a larval crawling assay. We further obtained whole-cell recordings from cells expressing GtACR1, which mediated strong and light-sensitive photocurrents. Finally, using physiological recordings and a behavioral readout, we demonstrate that GtACR1 enables the fast and reversible silencing of genetically targeted neurons within circuits engaged in visual processing.


Conflict of interest statement

The authors declare that they have no competing interests.

Figures

Figure 1
Figure 1
Characterization of GtACR1 and GtACR2 using a larval crawling assay. (A) Larvae were released in an agarose-coated petri dish and their crawling activity video-taped from above. Infra-red background illumination was provided by LED arrays emitting 850 nm light from below. Furthermore, three other LED arrays below emitted 457, 527 and 640 nm illumination for GtACR activation. Only one illumination was used for optogenetic stimulation at a time, here exemplified in red. (B) Relative activation spectra of GtACR1 and GtACR2, replotted from ref., with LED illumination used in the larval crawling assay indicated. (C) To quantify crawling activity, the measured centroid positions (red dots) were plotted as covered distance over time. The crawling activity of control larvae (vGlut-Gal4 only, no GtACR expression; black trace) was only mildly affected by illumination (527 nm at indicated intensity). In contrast, larvae with GtACR1 (cyan) or GtACR2 (magenta) expression in glutamatergic neurons (including motorneurons) seized crawling immediately with onset of light. Offset of illumination restored crawling activity. Traces labeled with a and b refer to data points in (E). (D) As another behavioral parameter, body length was quantified by fitting a rectangle to each larva contour and measuring its length. Upon illumination, only larvae with GtACR expression in glutamatergic neurons (vGlut-GtACR) elongated, in agreement with a relaxation of the body wall musculature due to GtACR-mediated motorneuron silencing. (E) Crawling activity (fraction of baseline) for illumination with three different wavelengths as a function of light intensity. Letters a and b indicate data points for which example traces are displayed in (C). All data are presented as mean ± standard error of the mean.
Figure 2
Figure 2
Characterization of GtACR1 in lobula plate tangential cells by whole-cell patch-clamp recordings. (A) Illustration of preparation for tangential cell recordings (left schematic adapted with permission from ref.). Lobula plate tangential cells (LPTCs) receive direction-selective visual input from T4/T5 neurons, three synapses downstream of photoreceptors (PR). Illumination for GtACR1 activation in tangential cells is conveyed to the brain via the epi-fluorescent light path of the microscope. (B-B”) Confocal images showing expression of GtACR1-EYFP in tangential cells. B depicts a maximal projection and B’, B” show projections from z-subsections highlighting individual dendritic branches. (C) Relative activation spectra of photoreceptor rhodopsin 1 (replotted from ref.) and transgenically expressed GtACR1 (replotted from ref.). Center illumination wavelengths (e.g. 615 nm) and bandwidths (e.g. 20 nm) used for the following experiments are indicated. (D) GtACR1-expressing tangential cell responses (membrane potential) to illumination of indicated wavelengths and intensities over time, averaged across 8 trials and N cells. Different wavelengths of similar intensity cause hyperpolarizations of different amplitudes (traces on the left). The same hyperpolarization in cells can be achieved with different wavelengths at different intensities (traces on top). Voltage traces with an expanded time axis are shown in the insets, showing a ~15 ms delayed depolarizing visual response (asterisk) that is replaced by short-latency (2–3 ms) GtACR1-mediated hyperpolarization using 535 and 565 nm illumination (red trace). The responses are quantified as the baseline-subtracted time-averaged potential during the steady-state (3–4 s after illumination onset minus 1–0 s before illumination onset). For each wavelength, sigmoid functions were fitted to the response amplitudes to obtain the light intensities required to reach 50% of the maximal response. Data are presented as mean ± standard error of the mean.
Figure 3
Figure 3
Using GtACR1 for optogenetic silencing of visual motion inputs to tangential cells. (A) Illustration of preparation for tangential cell recordings with GtACR1 expression in upstream direction-selective T4/T5 neurons (left schematic adapted with permission from ref.). (B) Confocal image showing expression of GtACR1-EYFP in T4/T5 neurons in a horizontal cross section. Me, medulla; Lo, lobula; LP, lobula plate. (C) Tangential cell responses in control (black traces) and T4/T5 > GtACR1 flies (red traces) to 615 nm illumination of indicated intensities. Note the different time scales. (D) Tangential cell responses in control (black traces) and T4/T5 > GtACR1 flies (red traces) to gratings of different sizes moving in the preferred direction. For the large pattern, cells in T4/T5 > GtACR1 flies show a reduced average response compared to control flies, presumably due to GtACR1 activation by the visual stimulus. Quantifications represent time-averaged and baseline-subtracted membrane potentials. (E) Tangential cell responses in control (black traces) and T4/T5 > GtACR1 flies (red traces) to combined visual and optogenetic stimulation. Visual stimuli were presented three times per trial and the second stimulation combined with 615 nm illumination (average voltage traces shown for 20 μW/mm2). Responses in control flies become progressively more reduced at increasing illumination intensities yet still reach ~50% at the highest intensity. In contrast, responses in T4/T5 > GtACR1 flies are eliminated already by weak illumination. For quantification, time-averaged membrane potentials were baseline-subtracted for the first and second visual stimulus. A normalized response was obtained by dividing the second by the first response. (F) Tangential cell responses to moving ON (red) and OFF edges (blue) in the same individuals expressing GtACR1 in ON-selective T4 cells. The stimulus is presented three times per trial and the second time combined with 615 nm light illumination. The OFF response is comparable to wild type while the ON response is almost absent. The third visual ON response is slightly reduced for unknown reasons. Quantification as in (E). Traces in CF represent the membrane potential averaged across 4 trials and N cells. All data are shown as mean ± standard error of the mean. A two-tailed Wilcoxon ranksum test was performed to establish statistical significance: n.s., not significant; **p < 0.01; ***p < 0.001.
Figure 4
Figure 4
Using GtACR1 for optogenetic silencing of visual motion signals underlying the optomotor response. (A) Schematic illustrating the behavioral optomotor assay. A tethered fly is walking on an air-suspended ball whose rotation is measured, allowing to obtain fly turning responses to visual motion. (B) To optogenetically silence visual neurons expressing GtACR1, light is focused onto a small spot (0.12 mm2) on the back of the fly head. (C) Fly turning responses (averaged across 20 trials and 10 flies) to visual motion towards left and right, presented either on the same (ipsilateral) or contralateral side of optogenetic illumination. Response traces for three illumination conditions are overlaid (0, 10 and 50 μW). Control flies (upper row) show no discernible changes in optomotor behavior due to illumination. In contrast, T4/T5 > GtACR1 flies display markedly reduced optomotor turning upon illumination (lower row), particularly in combination with ipsilateral visual stimulation (two plots on the right). The short horizontal lines in front of traces indicate zero turning. (D) Quantification of experiment presented in C, with an additional control (T4/T5 driver only, i.e without expression) and two additional optogenetic light intensities. Baseline-subtracted responses to left- and right-ward motion were combined (L–R) separately for ipsi- and contralateral stimulation. (E) Experiment as in C but with simultaneous visual motion in opposite directions on left and right side (back-to-front, shown on the left; front-to-back, shown on the right). Control flies do not display turning on average in any condition. T4/T5 > GtACR1 flies respond with turning to both visual stimuli when combined with illumination of intermediate intensities, in agreement with GtACR1-mediated unilateral motion blindness. The short horizontal lines in front of traces indicate zero turning. (F) Quantification of experiment presented in E, with an additional control (T4/T5 driver only, i.e without expression) and two additional optogenetic light intensities. Baseline-subtracted responses to front-to-back and back-to-front were combined (FTB - BTF). Data in D and F represent the mean ± standard error of the mean.

Similar articles

Cited by

References

    1. Fenno L, Yizhar O, Deisseroth K. The development and application of optogenetics. Annu. Rev. Neurosci. 2011;34:389–412. doi: 10.1146/annurev-neuro-061010-113817. - DOI - PMC - PubMed
    1. Zhang F, et al. The microbial opsin family of optogenetic tools. Cell. 2011;147:1446–1457. doi: 10.1016/j.cell.2011.12.004. - DOI - PMC - PubMed
    1. Borst A, Helmstaedter M. Common circuit design in fly and mammalian motion vision. Nat. Neurosci. 2015;18:1067–1076. doi: 10.1038/nn.4050. - DOI - PubMed
    1. Borst A. Drosophila’s view on insect vision. Curr. Biol. 2009;19:R36–47. doi: 10.1016/j.cub.2008.11.001. - DOI - PubMed
    1. Haikala V, Joesch M, Borst A, Mauss AS. Optogenetic control of fly optomotor responses. J. Neurosci. 2013;33:13927–13934. doi: 10.1523/JNEUROSCI.0340-13.2013. - DOI - PMC - PubMed

Publication types

LinkOut - more resources