. 2017 Oct 23;7(1):13746.
doi: 10.1038/s41598-017-14103-7.

Maternal Glucocorticoid Elevation and Associated Fetal Thymocyte Apoptosis are Involved in Immune Disorders of Prenatal Caffeine Exposed Offspring Mice

Affiliations

Maternal Glucocorticoid Elevation and Associated Fetal Thymocyte Apoptosis are Involved in Immune Disorders of Prenatal Caffeine Exposed Offspring Mice

Han-Xiao Liu et al. Sci Rep. .

Abstract

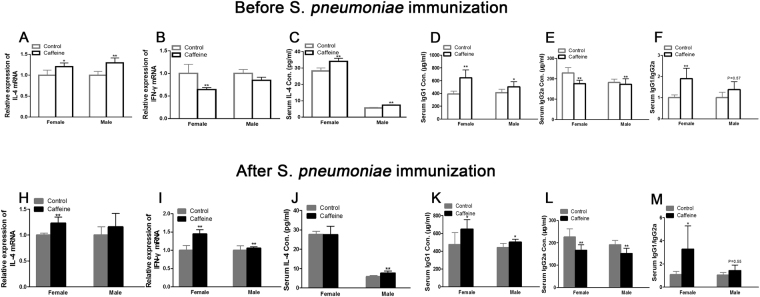
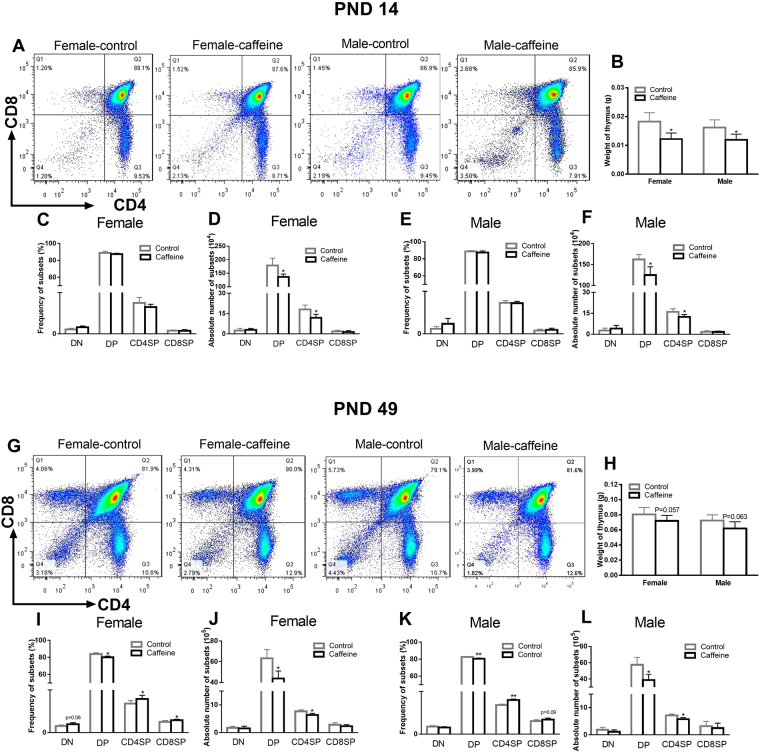
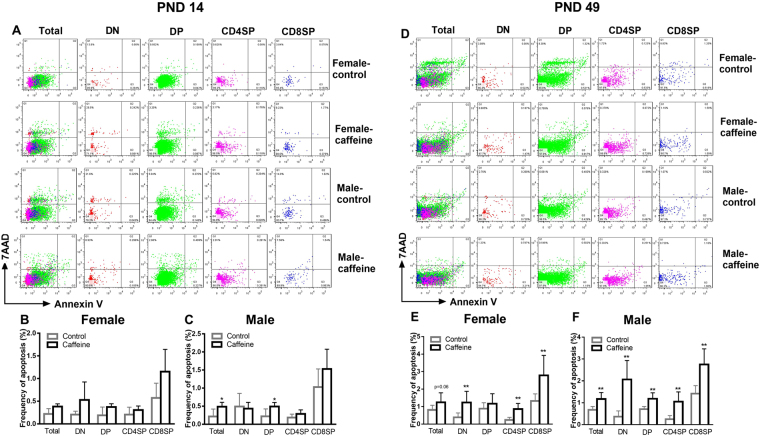
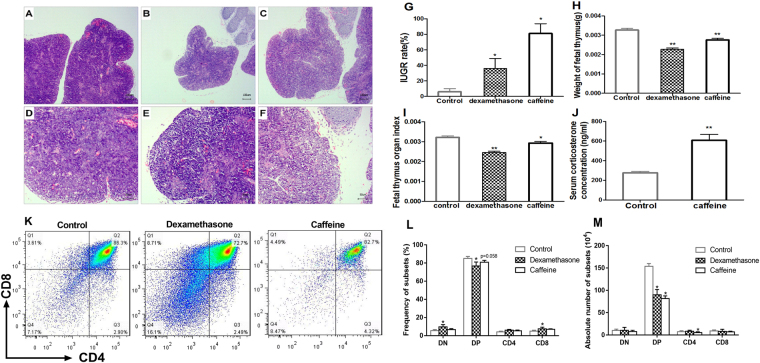
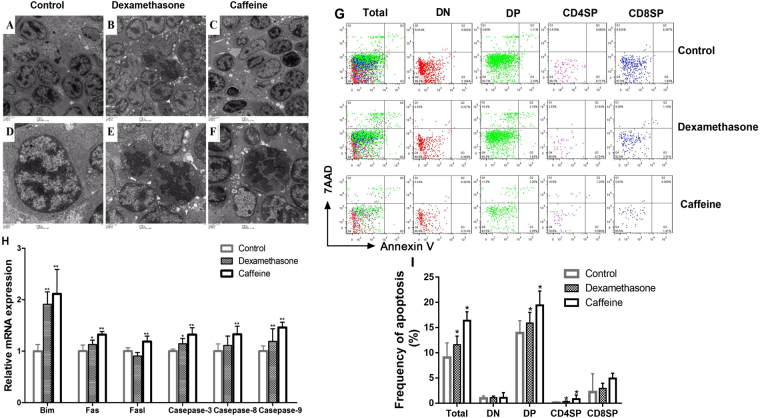
Our previous study showed that prenatal caffeine exposure (PCE) could induce intrauterine growth retardation (IUGR) and glucocorticoid elevation in the fetus. Researchers suggested that IUGR is a risk factor for T helper cell (Th)1/Th2 deviation. However, whether PCE can induce these immune disorders and the underlying mechanisms of that induction remain unknown. This study aimed to observe the effects of PCE on the Th1/Th2 balance in offspring and further explore the developmental origin mechanisms from the perspective of glucocorticoid overexposure-induced thymocyte apoptosis. An IUGR model was established by caffeine administration from gestational day (GD) 9 to GD 18, and the offspring were immunized on postnatal day (PND) 42. The results show that maternal glucocorticoid overexposure increased fetal thymocyte apoptosis by activating both the Fas-mediated and the Bim-regulated apoptotic pathways. After birth, accelerated thymocyte apoptosis and Th1 suppression were also found in the PCE offspring at PND 14 and PND 49. Moreover, the PCE offspring showed immune disorders after immunization, manifesting as increased IgG1/IgG2a ratio and IL-4 production in the serum. In conclusion, PCE could induce fetal overexposure to maternal glucocorticoids and increase thymocyte apoptosis, which could persist into postnatal life and be implicated in Th1 inhibition and further immune disorders.


Conflict of interest statement

The authors declare that they have no competing interests.

Figures

Figure 1
Figure 1
Effects of prenatal caffeine exposure (PCE) on body weight and growth rates of offspring. (A,D) Offspring body weights on postnatal day (PND) 0; (B,E) Changes in offspring body weights; (C,F) Offspring body weight growth rates. Mean ± SD, n = 20 per group per gender. *P < 0.05, **P < 0.01 vs control.
Figure 2
Figure 2
Effects of prenatal caffeine exposure (PCE) on splenic IL-4 and IFN-γ mRNA expression levels, on serum IL-4, IgG1 and IgG2a levels, and on IgG1/IgG2a ratios in the offspring on postnatal day (PND) 49 before and after S. pneumoniae immunization. (A,H) Relative IL-4 mRNA expression levels in the offspring; (B,I): Relative IFN-γ mRNA expression levels in the offspring; (C,J) Serum IL-4 contents in the offspring; (D,K) Serum IgG1 concentrations in the offspring; (E,L) Serum IgG2a concentrations in the offspring; (F,M) IgG1/IgG2a ratios in the offspring. Mean ± SD, n = 8–9 per group per gender. *P < 0.05, **P < 0.01 vs control.
Figure 3
Figure 3
Effects of prenatal caffeine exposure (PCE) on thymocyte phenotypes in the offspring mice on postnatal days (PND) 14 and 49. (A,G) Typical flow diagrams of male and female offspring; (B,H) Thymus weights of the offspring; (C,I) Thymocyte subpopulation percentages in the female offspring; (D,J) Absolute thymocyte subpopulation numbers in the female offspring; (E,K) Thymocyte subpopulation percentages in the male offspring. (F,L) Absolute thymocyte subpopulation numbers in the male offspring. Mean ± SD, n = 3 per group per gender. *P < 0.05, **P < 0.01 vs control.
Figure 4
Figure 4
Effects of prenatal caffeine exposure (PCE) on thymocyte apoptosis in offspring mice on postnatal days (PND) 14 and 49. (A,D) Typical flow diagrams of thymocyte apoptosis in the female and male offspring (B,E) Thymocyte apoptosis percentages in the female offspring; (C,F) Thymocyte apoptosis percentages in the male offspring. Mean ± SD, n = 3 per group per gender. *P < 0.05, **P < 0.01 vs control.
Figure 5
Figure 5
Effects of maternal caffeine and dexamethasone exposure on fetal thymus histological changes, fetal IUGR rates, fetal thymus development parameters and fetal thymocyte phenotypes on gestational day (GD) 18. (A) Control group (HE, ×40); (B) Dexamethasone group (HE, ×40); (C) Caffeine group (HE, ×40); (D) Control group (HE, ×100); (E) Dexamethasone group (HE, ×100); (F) Caffeine group (HE, ×100); (G) IUGR rates; (H) Thymus weights of the fetuses; (I) Fetal thymus organ index; (J) Fetal serum GC concentrations; (K) Typical flow diagram; (L) Percentage of thymocyte populations in the fetal mice; (M) Absolute thymocyte subpopulation numbers in the fetal thymuses. Mean ± SD, n = 3 per group for the flow cytometry analysis, n = 8–10 per group for the body weight and serum GC detection. *P < 0.05, **P < 0.01 vs control.
Figure 6
Figure 6
Fetal thymocyte apoptosis induced by maternal caffeine and dexamethasone exposure. (A) Control group (TEM, ×1,000); (B) Dexamethasone group (TEM, ×1,000); (C) Caffeine group (TEM, ×1,000); (D) Control group (TEM, ×3,000); (E) Dexamethasone group (TEM, ×3,000); (F) Caffeine group (TEM, ×3,000). (G) Typical flow diagram of thymocyte apoptosis; (H) mRNA expression levels of intrinsic and extrinsic apoptotic pathway genes; (I) Thymocytes apoptosis percentages in the fetal thymus. Mean ± SD, n = 3 per group for the flow cytometry analysis, n = 8–10 per group for the RT-PCR. *P < 0.05, **P < 0.01 vs control.
Figure 7
Figure 7
Hypothesis for the mechanism of the reduced thymopoiesis and Th1 inhibition in offspring induced by prenatal caffeine exposure (PCE). Bim, Bcl-2 family member; DN, CD4CD8 double negative thymocytes; DP, CD4+CD8+ double positive thymocytes; SP, single positive thymocytes; Th, T helper cells.
Figure 8
Figure 8
A schematic diagram of the protocol and groups. (A) Caffeine (dexamethasone) or saline was administered to pregnant mice from gestational day (GD) 9 to GD 18. On postnatal day (PND) 42, an inflammation model was established via S. pneumoniae immunization. Offspring were sacrifice for testing on GD 18, PND 14 and PND 49; (B) The experimental groups are shown in the table.

Similar articles

Cited by

References

    1. Dorostghoal M, Erfani Majd N, Nooraei P. Maternal caffeine consumption has irreversible effects on reproductive parameters and fertility in male offspring rats. Clin Exp Reprod Med. 2012;39:144–152. doi: 10.5653/cerm.2012.39.4.144. - DOI - PMC - PubMed
    1. Heckman MA, Weil J, Gonzalez de Mejia E. Caffeine (1, 3, 7-trimethylxanthine) in foods: a comprehensive review on consumption, functionality, safety, and regulatory matters. J Food Sci. 2010;75:R77–87. doi: 10.1111/j.1750-3841.2010.01561.x. - DOI - PubMed
    1. Kuczkowski KM. Caffeine in pregnancy. Arch Gynecol Obstet. 2009;280:695–698. doi: 10.1007/s00404-009-0991-6. - DOI - PubMed
    1. Grosso LM, et al. Maternal caffeine intake and intrauterine growth retardation. Epidemiology. 2001;12:447–455. doi: 10.1097/00001648-200107000-00015. - DOI - PubMed
    1. Ping J, et al. Prenatal caffeine ingestion induces aberrant DNA methylation and histone acetylation of steroidogenic factor 1 and inhibits fetal adrenal steroidogenesis. Toxicology. 2014;321:53–61. doi: 10.1016/j.tox.2014.03.011. - DOI - PubMed

Publication types

MeSH terms