

Comparing crop rotations between organic and conventional farming
- PMID: 29062017
- PMCID: PMC5653822
- DOI: 10.1038/s41598-017-14271-6
Comparing crop rotations between organic and conventional farming
Abstract
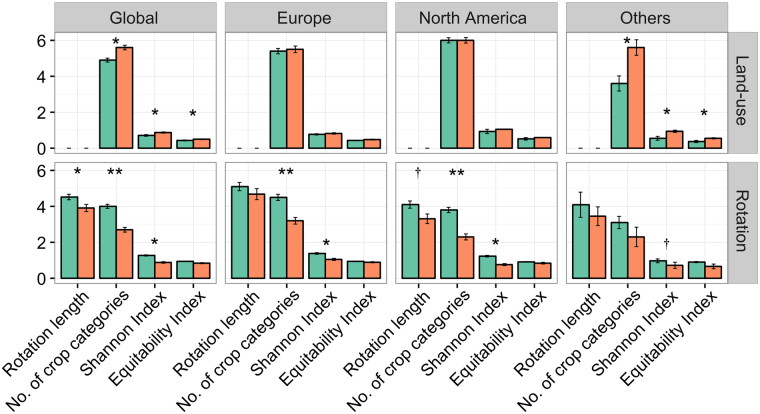
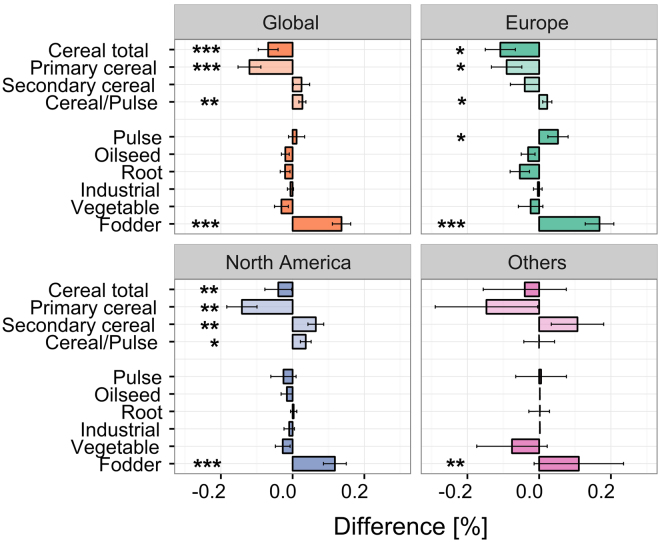
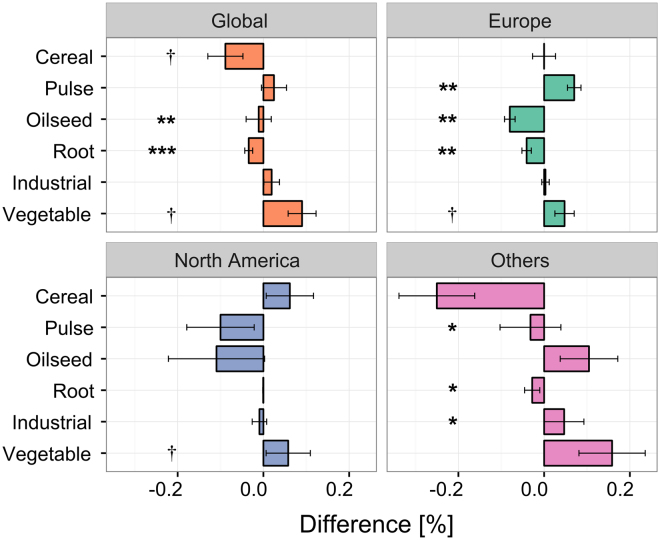
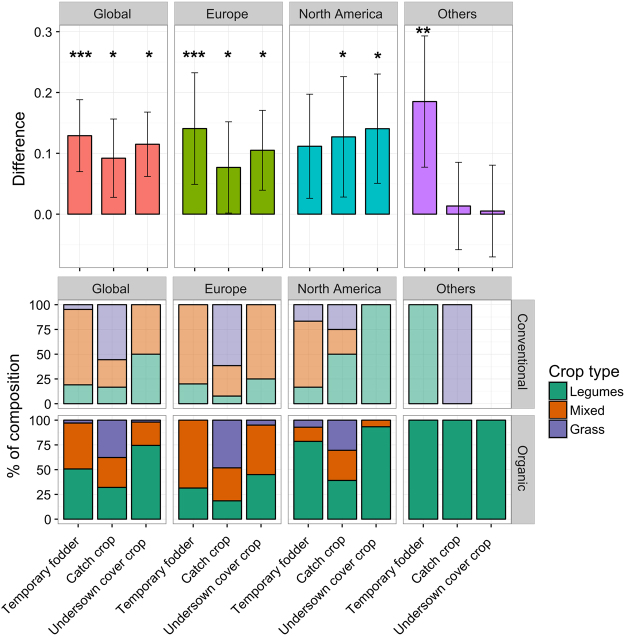
Cropland use activities are major drivers of global environmental changes and of farming system resilience. Rotating crops is a critical land-use driver, and a farmers' key strategy to control environmental stresses and crop performances. Evidence has accumulated that crop rotations have been dramatically simplified over the last 50 years. In contrast, organic farming stands as an alternative production way that promotes crop diversification. However, our understanding of crop rotations is surprisingly limited. In order to understand if organic farming would result in more diversified and multifunctional landscapes, we provide here a novel, systematic comparison of organic-to-conventional crop rotations at the global scale based on a meta-analysis of the scientific literature, paired with an independent analysis of organic-to-conventional land-use. We show that organic farming leads to differences in land-use compared to conventional: overall, crop rotations are 15% longer and result in higher diversity and evener crop species distribution. These changes are driven by a higher abundance of temporary fodders, catch and cover-crops, mostly to the detriment of cereals. We also highlighted differences in organic rotations between Europe and North-America, two leading regions for organic production. This increased complexity of organic crop rotations is likely to enhance ecosystem service provisioning to agroecosystems.
Conflict of interest statement
The authors declare that they have no competing interests.
Figures
Similar articles
-
Farmers' adoption and perceived benefits of diversified crop rotations in the margins of U.S. Corn Belt.J Environ Manage. 2021 Sep 1;293:112903. doi: 10.1016/j.jenvman.2021.112903. Epub 2021 Jun 5. J Environ Manage. 2021. PMID: 34102504
-
Cropping System Diversification Influences Soil Microbial Diversity in Subtropical Dryland Farming Systems.Microb Ecol. 2023 May;85(4):1473-1484. doi: 10.1007/s00248-022-02074-w. Epub 2022 Jul 15. Microb Ecol. 2023. PMID: 35840682 Free PMC article.
-
A global synthesis of the effects of diversified farming systems on arthropod diversity within fields and across agricultural landscapes.Glob Chang Biol. 2017 Nov;23(11):4946-4957. doi: 10.1111/gcb.13714. Epub 2017 May 10. Glob Chang Biol. 2017. PMID: 28488295
-
Conventional vs. Organic Agriculture-Which One Promotes Better Yields and Microbial Resilience in Rapidly Changing Climates?Front Microbiol. 2022 Jun 9;13:903500. doi: 10.3389/fmicb.2022.903500. eCollection 2022. Front Microbiol. 2022. PMID: 35814715 Free PMC article. Review.
-
Meeting the demand for crop production: the challenge of yield decline in crops grown in short rotations.Biol Rev Camb Philos Soc. 2012 Feb;87(1):52-71. doi: 10.1111/j.1469-185X.2011.00184.x. Epub 2011 Jun 1. Biol Rev Camb Philos Soc. 2012. PMID: 21631700 Review.
Cited by
-
Tobacco crop rotation enhances the stability and complexity of microbial networks.Front Microbiol. 2024 Jun 19;15:1416256. doi: 10.3389/fmicb.2024.1416256. eCollection 2024. Front Microbiol. 2024. PMID: 38962123 Free PMC article.
-
Quantifying the benefits of reducing synthetic nitrogen application policy on ecosystem carbon sequestration and biodiversity.Sci Rep. 2022 Dec 1;12(1):20715. doi: 10.1038/s41598-022-24794-2. Sci Rep. 2022. PMID: 36456611 Free PMC article.
-
Analyzing drivers of organic food sales-A pooled spatial data analysis for Hamburg (Germany).PLoS One. 2023 Oct 4;18(10):e0285377. doi: 10.1371/journal.pone.0285377. eCollection 2023. PLoS One. 2023. PMID: 37792695 Free PMC article.
-
Improving Agri-environmental Schemes: Suggestions from Farmers and Nature Managers in a Central European Region.Environ Manage. 2024 Apr;73(4):826-840. doi: 10.1007/s00267-023-01922-w. Epub 2023 Dec 18. Environ Manage. 2024. PMID: 38108828 Free PMC article.
-
Is Bhutan destined for 100% organic? Assessing the economy-wide effects of a large-scale conversion policy.PLoS One. 2018 Jun 13;13(6):e0199025. doi: 10.1371/journal.pone.0199025. eCollection 2018. PLoS One. 2018. PMID: 29897989 Free PMC article.
References
-
- Ramankutty N, Evan AT, Monfreda C, Foley JA. Farming the planet: 1. Geographic distribution of global agricultural lands in the year 2000. Global Biogeochem. Cycles. 2008;22:1–19.
Publication types
LinkOut - more resources
Full Text Sources
Other Literature Sources
Molecular Biology Databases
