. 2017 Oct 23;7(1):13853.
doi: 10.1038/s41598-017-14065-w.

A Brain Penetrant Mutant IDH1 Inhibitor Provides In Vivo Survival Benefit

Affiliations

A Brain Penetrant Mutant IDH1 Inhibitor Provides In Vivo Survival Benefit

Johnny Kopinja et al. Sci Rep. .

Abstract

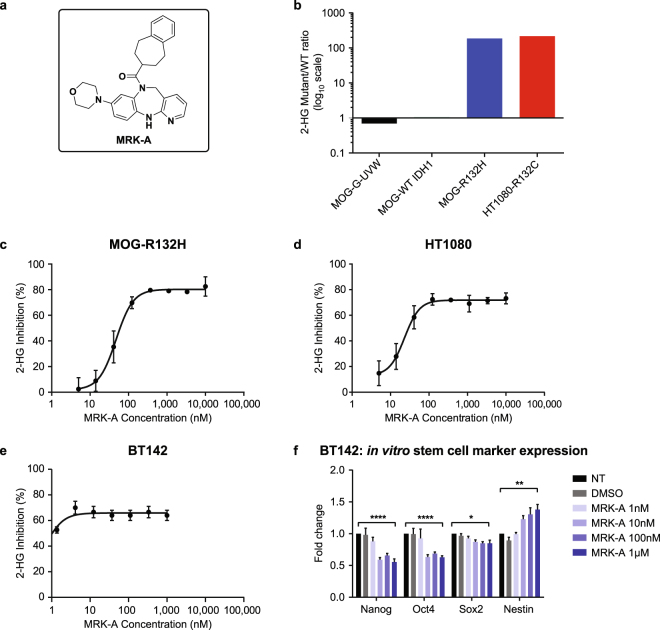
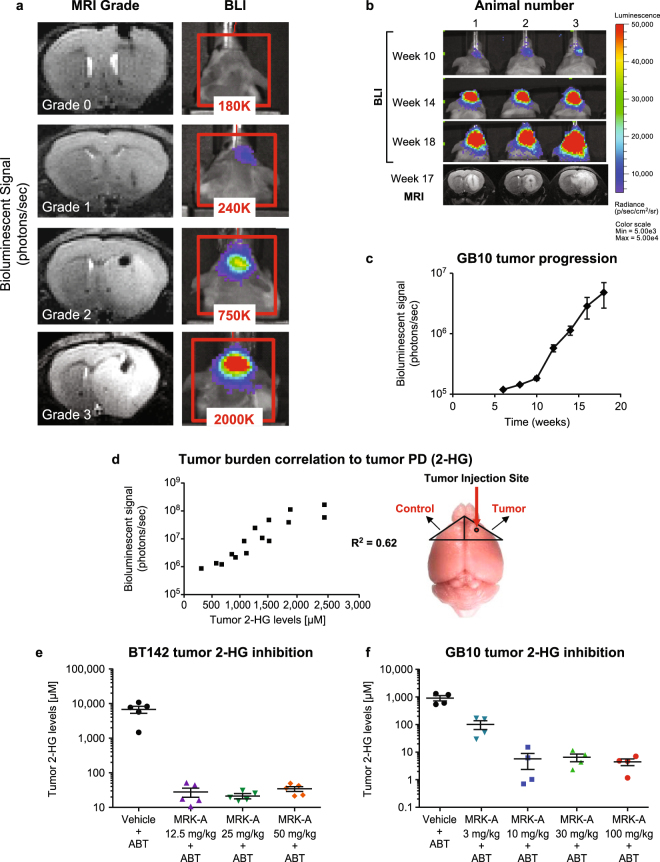
Mutations in IDH1 are highly prevalent in human glioma. First line treatment is radiotherapy, which many patients often forego to avoid treatment-associated morbidities. The high prevalence of IDH1 mutations in glioma highlights the need for brain-penetrant IDH1 mutant-selective inhibitors as an alternative therapeutic option. Here, we have explored the utility of such an inhibitor in IDH1 mutant patient-derived models to assess the potential therapeutic benefits associated with intracranial 2-HG inhibition. Treatment of mutant IDH1 cell line models led to a decrease in intracellular 2-HG levels both in vitro and in vivo. Interestingly, inhibition of 2-HG production had no effect on in vitro IDH1 mutant glioma cell proliferation. In contrast, IDH1 mutant-selective inhibitors provided considerable survival benefit in vivo. However, even with near complete inhibition of intratumoral 2-HG production, not all mutant glioma models responded to treatment. The results suggest that disruption of 2-HG production with brain-penetrant inhibitors in IDH1 mutant gliomas may have substantial patient benefit.


Conflict of interest statement

The study was sponsored by Merck & Co., Inc., Kenilworth, New Jersey, USA. J. Kopinja, R.S. Sevilla, D. Levitan, D. Dai, A. Vanko, E. Spooner, C. Ware, R. Forget, K. Hu, A. Kral, P. Spacciapoli, R. Kennan, L. Jayaraman, V. Pucci, S. Perera, W. Zhang, C. Fischer, and M.H. Lam are current or former employees of Merck Sharp & Dohme, Corp., a subsidiary of Merck & Co., Inc., Kenilworth, New Jersey, USA and may own stock or stock options in the company.

Figures

Figure 1
Figure 1
(a) Chemical structure of MRK-A. (b) MOG-G-UVW, MOG-R132H and HT1080 2-HG levels at baseline. MOG-G-UVW was engineered to express either wildtype (MOG-WT IDH1, black) or mutant IDH1 R132H (MOG-R132H, blue). HT1080 IDH1 R132C fibrosarcoma cells (red) is shown as a reference for 2-HG production. (c–e) In vitro curves for 2-HG inhibition by MRK-A in MOG-R132H, HT1080, and BT142 cell lines. Inhibition curves for (c) MOG-R132H, (d) HT1080, and (e) BT142 displayed in nanomolar (nM). (f) MRK-A in vitro dose response with BT142 IDH1 R132H glioma cells over 1 week. MRK-A treatment leads to stem cell marker changes in BT142. Stem cell marker expression was examined by qPCR assay. *, **, and **** indicate statistical significance at P < 0.05, 0.01, and 0.0001 respectively, compared to vehicle control.
Figure 2
Figure 2
(a) BT142-luciferase characterization and tumor burden assessment using Bioluminescence and MRI. Mice were injected intracranially with a patient-derived glioma cell line engineered to express luciferase protein. Representative anatomical MR images and corresponding bioluminescent heat maps are shown. On the left, the MR images were graded based on tumor size and intensity using a scoring system ranging from 0 = no tumor to 5 = very large, hyperintense tumor invading the brain hemisphere contralateral to the injection site. On the right, the heat map represents emitted photons per second. (b) GB10-luciferase characterization and tumor burden assessment versus MRI. GB10, a novel, patient-derived tumor model was engineered to express luciferase protein. Representative images show increasing bioluminescent signal over time. MR images at week 17 are displayed for comparative purposes and demonstrate that GB10 presents as a discrete mass instead of a hyperintense and diffuse tumor as in BT142. (c) GB10 tumor progression was measured as increasing intensity in bioluminescent signal over time. (d) Bioluminescent signal correlates to 2-HG levels in BT142 tumor model. In vivo LC-MS-based detection of 2-HG in BT142-injected animals with increasing tumor burden as indicated by bioluminescent imaging. The mouse brain on the right shows the approximate location of tumor cell injection (red arrow pointing to circle). (e,f) MRK-A dose response in patient-derived IDH1 mutant BT142 and GB10 models. For both studies, BID dosing occurred over three days, for a total of five doses. (e) Tumor 2-HG inhibition following three BID doses of 12.5, 25 and 50 mg/kg of MRK-A, administered orally in the BT142 tumor model. (f) Inhibition of 2-HG production in tumors following three oral doses of MRK-A, at 3, 10, 30 or 100 mg/kg, in the GB10 orthotopic glioma model.
Figure 3
Figure 3
(a) Tumor burden as measured by luciferase imaging after 4 weeks of MRK-A dosing in BT142 mouse model. Week 4 luciferase imaging timepoint in BT142 animals treated with either 10 mg/kg or 30 mg/kg MRK-A twice-daily with ABT 50 mg/kg BID co-dosing. (b) BT142 mice treated with MRK-A showing a statistically significant survival benefit. Survival curves from vehicle- and MRK-A-treated animals are provided with the associated p-value reflecting the median between-group survival estimate (as per the Log-rank Test, Mantel Cox). (c) MRK-A inhibits tumor 2-HG levels in treated efficacy study animals. Tumor 2-HG inhibition was measured by LC-MS following 38 days of BID dosing of vehicle, 10 and 30 mg/kg of MRK-A + ABT 50 mg/kg administered orally in the BT142 tumor model. (d) Longitudinal bioluminescent imaging of long-term BT142 vehicle and MRK-A treated animals shows extended MRK-A treatment leads to tumor growth inhibition in BT142 mice. (e) Long-term administration of MRK-A in BT142 mice confirms survival benefit. Survival curves from vehicle- and MRK-A-treated animals (p-value for the between-group differences in median survival estimates using Log-rank Test, Mantel Cox). (f) Tumor 2-HG inhibition measured by LC-MS following animal death due to disease-associated morbidity. BT142 animals were dosed orally BID with either vehicle + ABT or MRK-A + ABT. MRK-A significantly reduces 2-HG levels in BT142 tumors. *, **, and *** indicate statistical significance at P < 0.05, 0.01, and 0.001 respectively, compared to vehicle control.
Figure 4
Figure 4
(a) MRK-A treatment does not inhibit tumor growth in wildtype IDH1 U87MG tumor xenografts. U87MG animals were dosed BID with either 10 or 30 mg/kg MRK-A + ABT. Temozolomide positive control animals were treated QD for the first 5 days of the study. Tumor volumes were measured twice-weekly by caliper measurement. (b) 8 weeks of treatment with MRK-A and MRK-B induces tumor growth inhibition in BT142 animals. BT142 tumor volumes were measured by MR imaging after 8 weeks of treatment with either MRK-A + ABT or MRK-B. Compounds were dosed orally BID at the doses labeled. (c) Longitudinal monitoring of BT142 tumor growth using MRI. 8 weeks of MRK-A + ABT and MRK-B treatment induces tumor growth inhibition. Treatment started 3 weeks post implantation. (d) MRK-B significantly reduces 2-HG levels in BT142 intracranial tumors. Tumor 2-HG inhibition was measured by LC-MS postmortem. BT142 animals were dosed orally twice-daily with MRK-B at the stated doses. (e) Longitudinal bioluminescent imaging of vehicle- and MRK-A-treated GB10 animals demonstrates GB10 tumor model does not respond to MRK-A treatment. (f) GB10 survival curves for vehicle- and MRK-A-treated animals. (g) MRK-A significantly reduces 2-HG levels in GB10 tumors. Tumor 2-HG inhibition was measured by LC-MS postmortem. GB10 animals were dosed orally twice-daily with either vehicle + ABT or MRK-A + ABT. *, ***, and **** indicate statistical significance at P < 0.05, 0.001, and 0.0001 respectively.
Figure 5
Figure 5
(a) Differentially expressed genes between BT142, GB10 and TCGA GBM datasets. A Venn diagram showing overlap between gene expression patterns for BT142 (green), GB10 (red) and the TCGA proneural geneset (blue) from Verhaak et al.. For BT142 and GB10 tumors, differentially expressed genes were compared in MRK-A-treated animals relative to vehicle-treated animals. All animals were dosed BID; MRK-A was dosed at 30 mg/kg and vehicle with ABT was dosed at 50 mg/kg. Genes were considered differentially expressed if p-values were < 0.01 for MRK-A versus vehicle groups. (b) Hierarchical clustering using all proneural genes from Verhaak et al. to compare BT142 to GB10. Heat map showing differential expression of the TCGA proneural geneset in IDH1 mutant models. (c) Heat map showing differential expression of key proneural genes in BT142 and GB10. Heat map showing differential expression of key TCGA proneural genes highlighted by Verhaak et al., between BT142 and GB10 treated and vehicle treated tumors. (d) Individual proneural associated genes display large differences in expression between BT142 and GB10. RNA-Seq data for differential expression of PDGFRA, OLIG2 and IDH1, respectively between BT142 and GB10 treated and vehicle tumors.

References

    1. Balss J, et al. Analysis of the IDH1 codon 132 mutation in brain tumors. Acta Neuropathol. 2008;116:597–602. doi: 10.1007/s00401-008-0455-2. - DOI - PubMed
    1. Cairns RA, Mak TW. Oncogenic isocitrate dehydrogenase mutations: mechanisms, models, and clinical opportunities. Cancer Discov. 2013;3:730–741. doi: 10.1158/2159-8290.CD-13-0083. - DOI - PubMed
    1. Parsons DW, et al. An integrated genomic analysis of human glioblastoma multiforme. Science. 2008;321:1807–1812. doi: 10.1126/science.1164382. - DOI - PMC - PubMed
    1. Yan H, et al. IDH1 and IDH2 mutations in gliomas. N. Engl. J. Med. 2009;360:765–773. doi: 10.1056/NEJMoa0808710. - DOI - PMC - PubMed
    1. Verhaak RG, et al. Integrated genomic analysis identifies clinically relevant subtypes of glioblastoma characterized by abnormalities in PDGFRA, IDH1, EGFR, and NF1. Cancer Cell. 2010;17:98–110. doi: 10.1016/j.ccr.2009.12.020. - DOI - PMC - PubMed

Publication types

MeSH terms