. 2017 Oct 10:23:718-739.
eCollection 2017.

Enhancing the efficacy of AREDS antioxidants in light-induced retinal degeneration

Affiliations

Enhancing the efficacy of AREDS antioxidants in light-induced retinal degeneration

Paul Wong et al. Mol Vis. .

Abstract

Purpose: Light-induced photoreceptor cell degeneration and disease progression in age-related macular degeneration (AMD) involve oxidative stress and visual cell loss, which can be prevented, or slowed, by antioxidants. Our goal was to test the protective efficacy of a traditional Age-related Eye Disease Study antioxidant formulation (AREDS) and AREDS combined with non-traditional antioxidants in a preclinical animal model of photooxidative retinal damage.

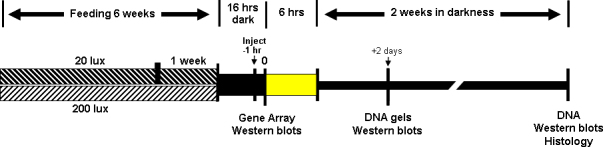
Methods: Male Sprague-Dawley rats were reared in a low-intensity (20 lux) or high-intensity (200 lux) cyclic light environment for 6 weeks. Some animals received a daily dietary supplement consisting of a small cracker infused with an AREDS antioxidant mineral mixture, AREDS antioxidants minus zinc, or zinc oxide alone. Other rats received AREDS combined with a detergent extract of the common herb rosemary, AREDS plus carnosic acid, zinc oxide plus rosemary, or rosemary alone. Antioxidant efficacy was determined by measuring retinal DNA levels 2 weeks after 6 h of intense exposure to white light (9,000 lux). Western blotting was used to determine visual cell opsin and arrestin levels following intense light treatment. Rhodopsin regeneration was determined after 1 h of exposure to light. Gene array analysis was used to determine changes in the expression of retinal genes resulting from light rearing environment or from antioxidant supplementation.

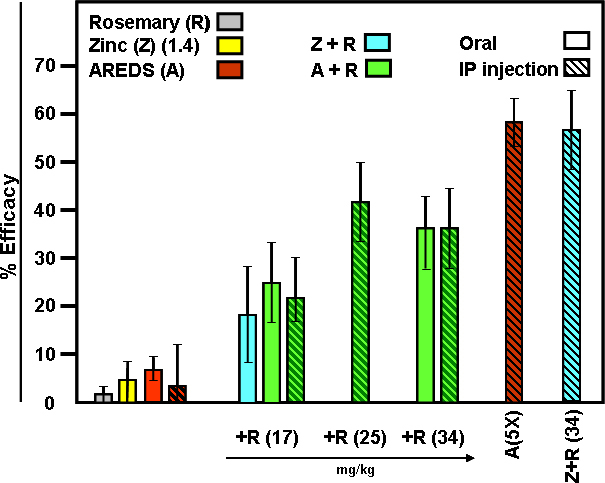
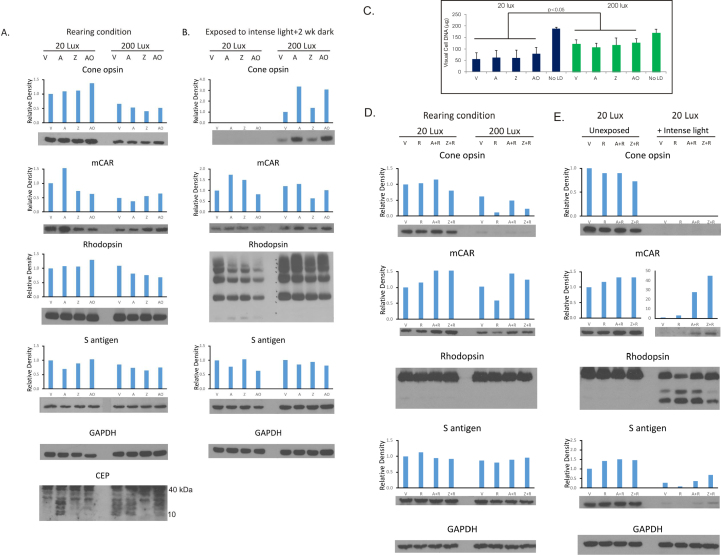
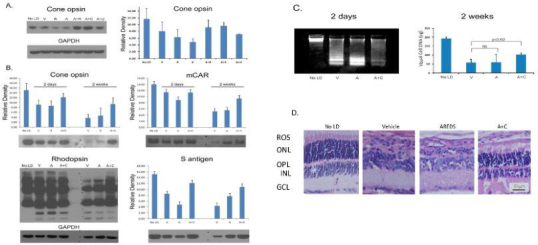
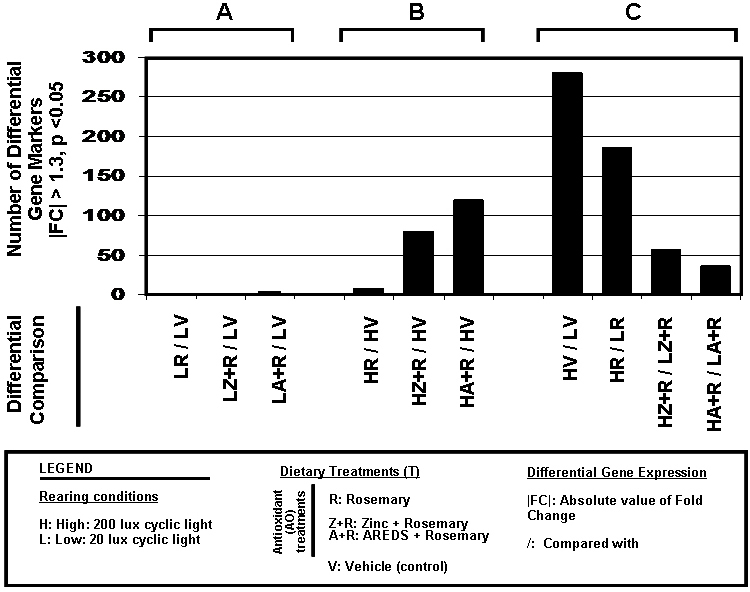
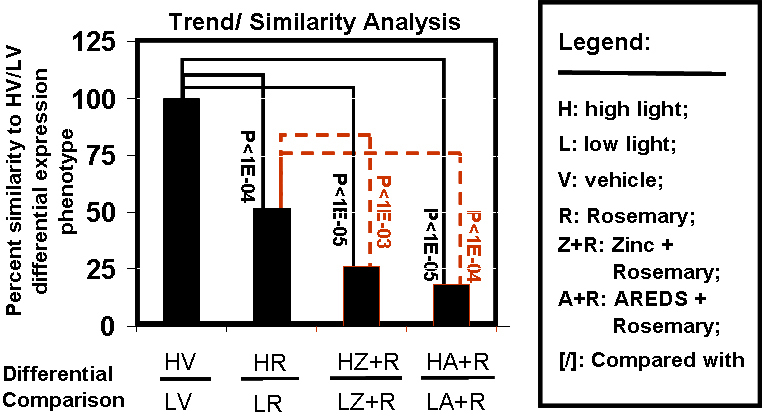
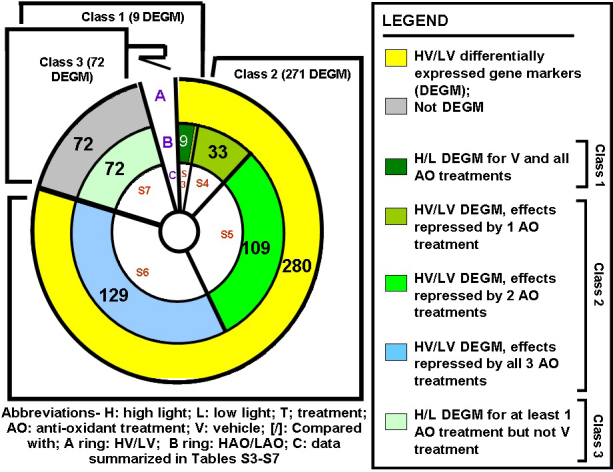
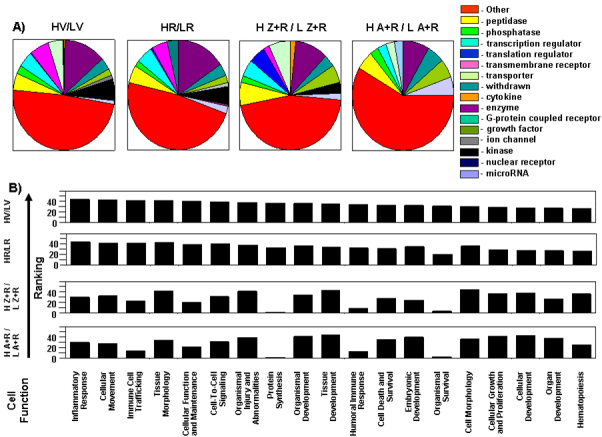
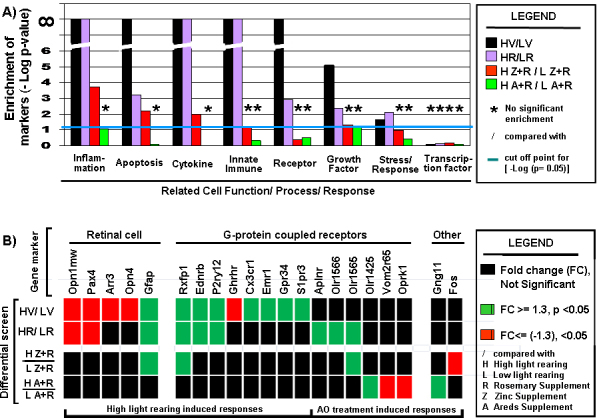
Results: Chronic high-intensity cyclic light rearing resulted in lower levels of rod and cone opsins, retinal S-antigen (S-ag), and medium wavelength cone arrestin (mCAR) than found for rats maintained in low cyclic light. However, as determined by retinal DNA, and by residual opsin and arrestin levels, 2 weeks after acute photooxidative damage, visual cell loss was greater in rats reared in low cyclic light. Retinal damage decreased with AREDS plus rosemary, or with zinc oxide plus rosemary whereas AREDS alone and zinc oxide alone (at their daily recommended levels) were both ineffective. One week of supplemental AREDS plus carnosic acid resulted in higher levels of rod and cone cell proteins, and higher levels of retinal DNA than for AREDS alone. Rhodopsin regeneration was unaffected by the rosemary treatment. Retinal gene array analysis showed reduced expression of medium- wavelength opsin 1 and arrestin C in the high-light reared rats versus the low-light rats. The transition of rats from low cyclic light to a high cyclic light environment resulted in the differential expression of 280 gene markers, enriched for genes related to inflammation, apoptosis, cytokine, innate immune response, and receptors. Rosemary, zinc oxide plus rosemary, and AREDS plus rosemary suppressed 131, 241, and 266 of these genes (respectively) in high-light versus low-light animals and induced a small subset of changes in gene expression that were independent of light rearing conditions.

Conclusions: Long-term environmental light intensity is a major determinant of retinal gene and protein expression, and of visual cell survival following acute photooxidative insult. Rats preconditioned by high-light rearing exhibit lower levels of cone opsin mRNA and protein, and lower mCAR protein, than low-light reared animals, but greater retention of retinal DNA and proteins following photooxidative damage. Rosemary enhanced the protective efficacy of AREDS and led to the greatest effect on the retinal genome in animals reared in high environmental light. Chronic administration of rosemary antioxidants may be a useful adjunct to the therapeutic benefit of AREDS in slowing disease progression in AMD.


Figures

Figure 1
Figure 1
Antioxidant feeding and light rearing paradigms. Weanling rats were maintained in a 12 h cyclic light environment, consisting of either 20 lux or 200 lux white light, for 6 weeks and given supplemental antioxidants on a daily basis. Following dark adaptation, rats were exposed to 9 k lux white light for 6 h and then allowed to recover in darkness for 2 days or 2 weeks. Animals were euthanized in a saturated CO2 atmosphere, and their retinas excised under dim red light. The extent of visual cell survival was determined by retinal DNA measurements and histology 2 weeks after light exposure. Western blot analysis was at various times before or after photooxidative stress, whereas gene array profiles were determined using tissues excised after 6 weeks of dietary supplements, but without exposure to intense light.
Figure 2
Figure 2
Protective efficacy of AREDS and rosemary on photooxidative retinal damage. Rats were reared in a 20 lux cyclic light environment and supplemented for 6 weeks with AREDS (A), AREDS + 17 mg/kg rosemary (A+R), zinc oxide (1.4 mg/kg) + 17 mg/kg rosemary (Z+R), rosemary alone (R), or zinc oxide alone (Z). Rats were exposed to intense light for 6 h (colored vertical bars), and allowed to recover in darkness for 2 weeks. One group of rats received A+R (34 mg/kg) daily for 1 week. Other animals were injected i.p. with A, or A+R (17, 25 or 34 mg/kg) 1 h before intense light treatment (diagonal hashed bars). One subgroup was given A at five times the daily recommended dose; a second subgroup received Z+R (1.4 and 34 mg/kg). Retinal DNA measurements were performed to determine protective efficacy, as described [25]. Results are presented as average percent (%) efficacy ± standard error of the mean (SEM) for four to eight animals per treatment. Chronic supplementation of rats with A, or acute i.p. administration, was ineffective in preventing photooxidative retinal damage. Oral R (17 mg/kg) or Z (1.4 mg/kg) alone were also ineffective. However, A+R (17 mg/kg), either given orally or by i.p. injection, resulted in 20–25% efficacy. A+R given i.p., with R at 25 or 34 mg/kg, or feeding A+R (34 mg/kg) for 1 week led to an average of 35% protective efficacy. AREDS (i.p.) at 5X the daily recommended dose or Z+R (34 mg/kg) provided 55–60% efficacy.
Figure 3
Figure 3
Western blot analysis and retinal DNA levels in rats reared for 6 weeks in low- or high-cyclic light. Retinal proteins (20 μg/lane), pooled from four to five rats, were electrophoresed on 12.5% sodium dodecyl sulfate (SDS)-polyacrylamide gels, transferred to polyvinylidene fluoride (PVDF) membranes, and then probed with antibodies as indicated in Appendix 1. Rats exposed to intense light for 6 h and then kept in darkness for 2 weeks (B, E). The fellow eyes were used for DNA measurements (C), [n = 8 for No LD]. Density profiles determined by Image J analysis. A: Cone opsin levels were lower in all rats reared under high cyclic light than for those reared in low cyclic light, whereas medium wavelength cone arrestin (mCAR) staining was lower in only the rats fed AREDS. There were no major differences in rhodopsin and S-antigen levels for AREDS (A), zinc oxide (Z), or AREDS antioxidants minus zinc (AO). Multiple CEP protein adducts were present, with greater staining for the 200 lux cyclic light-reared rats than for those reared in 20 lux light. B: Two weeks after exposure to acute intense light, higher levels of cone- and rod-opsins were present in rats from the high light condition versus low cyclic light. S-antigen and mCAR levels were similar. C: Individual antioxidants had little effect on retinal DNA for rats reared in 20 lux cyclic light (55–79 μg/retina); DNA levels for 200 lux cyclic light animals (107–128 μg) were significantly higher (p<0.05). D: Rats fed vehicle (V), rosemary (R), AREDS + rosemary (A+R), or zinc oxide + rosemary (Z+R). Cone opsin levels were higher in rats reared in 20 lux cyclic light than for those reared in 200 lux light. Rhodopsin (monomer) and S-antigen levels were unchanged by higher light rearing conditions, or by antioxidant feeding E: Two weeks after photooxidative damage considerable loss of cone opsin and rhodopsin (monomer) occurred in rats originally from the 20 lux light environment, and rhodopsin was still undergoing degradation. mCAR levels were preserved in A+R and Z+R rats, whereas S-antigen levels were low in all retinas. Glyceraldehyde phosphate dehydrogenase (GAPDH) was the control for protein loading.
Figure 4
Figure 4
Rats reared in low cyclic light and fed antioxidants for 1 week prior to photooxidative stress. Western analysis of cone opsin 2 days after intense light treatment (A). Cone opsin, rhodopsin, mCAR and S-antigen levels 2 days or 2 weeks after intense light exposure (B). Vehicle (V), rosemary (R), AREDS (A), AREDS + rosemary (A+R), AREDS + carnosic acid (A+C), or AREDS + ursolic acid (A+U) treated rats, concentrations as shown in Table 1. Density determined by Image J analysis for 3 separate gels (20 µg protein/lane) from n=4-6 rats; error bars ± SD. Retinal DNA damage and DNA levels determined 2 days or 2 weeks (respectively) after photooxidative damage; No LD; n=8 retinas from 8 different rats (C). Retinal histology for V, A, or A+C fed rats 2 weeks after intense light treatment (D). A: Cone opsin staining was greater for rats fed A+R or A+C, than those fed R, A, or A+U (n=6). B: Two weeks after retinal light damage cone opsin and mCAR levels were lower than after 2 days, but the relative staining for A+C (15.8 mg /kg) fed rats remained higher than for those fed A alone. Two weeks after light damage overall rhodopsin staining was less than in rats after 2 days for those given V or A. Lower molecular weight degradation products were present after both 2 days and 2 weeks, but higher levels of rhodopsin (and its polymeric forms) were present in animals fed A+C. C: Two days after light exposure staining for low molecular weight apoptotic DNA fragments was greater for rats treated with V or A than seen for rats treated with A+C. As determined by ethidium staining of a gel run for only 5 min DNA loading was the same in all samples (Appendix 3). Two weeks after intense light a significantly higher level of visual cell DNA was found in rats fed A+C than seen for V treatment (p<0.02). D: Histology of fellow eyes revealed considerable damage in V and A treated rats (1 to 3 rows of nuclei in the ONL), and retention of 7-8 rows of nuclei in the ONL of rats fed A+C (bar =50 µm).
Figure 5
Figure 5
Tabulation of changes induced by light rearing and antioxidant diets in retinal gene expression. Gene expression profiles were established for different groups of animals raised with high (H) or low cyclic light rearing (L) conditions and treated with specific dietary supplements (rosemary [R], AREDS and rosemary [A+R], or zinc oxide and rosemary [Z+R], or vehicle [V]; see Figure 1). Differential analysis, of these profiles, was performed in three different sets of comparisons. A: The counts of differential gene markers from comparing different antioxidant-fed L-reared animals with vehicle-fed L-reared animals. B: Comparison of the antioxidant-fed H-reared animals with vehicle-fed H-reared controls. C: The findings when each dietary treatment is compared in animals reared in the high cyclic light environment with the same treatment in animals raised in low cyclic light conditions (genes listed in Appendix 7, Appendix 8, Appendix 9, Appendix 10 and Appendix 11). In all cases, the gene markers were categorized as differentially expressed between two different treatments if the absolute value of the fold change (FC) was ≥ 1.3, p<0.05 (|fold change (FC)| >1.3, p<0.05).
Figure 6
Figure 6
Expression trends. The differential status (up: U; down: D; not significant: N) for each gene marker in the list of 352 gene markers (Appendix 7, Appendix 8, Appendix 9, Appendix 10 and Appendix 11) were aligned and matched for (HV/LV) and each antioxidant [(HR/LR), (H Z+R/L Z+R), and (H A+R/L A+R)] treatment comparison. For each alignment, we scored the trend of the differential status whether they were the same or not. This information was used to derive a percent similarity measure for each antioxidant treatment under (H/L) conditions against the differential HV/LV gene profile. A goodness of fit test was performed between the percent similarities between the H/L antioxidant treatments, (HAO/LAO) comparisons with (HV/LV) to determine its statistical significance (p value). Although all three antioxidant (H/L) scenarios are all statistically significantly different than (HV/LV), the HV/LV differential gene profile is more similar to HR/LR than (H Z+R/L Z+R) or (H A+R/ L A+R).
Figure 7
Figure 7
Three classes of induced gene markers. The (H/L) differential gene expression data across all four dietary treatments (352 gene markers) was partitioned into vehicle effects (A ring, HV/LV) and antioxidant (AO) effects (B ring, HAO/LAO); 280 of these gene markers define light (the transition from a low to high light rearing environment) responses. Nine gene markers with a similar fold change expression trend in all four analyses define class 1 genes (Appendix 7) that correspond to high light effects that cannot be inhibited with antioxidant treatment; 271 HV/LV differentially expressed gene markers where the differential phenotype is inhibited by at least one of the antioxidant treatments define class 2 genes (light effects that can be modified by an antioxidant treatment; Appendix 8, Appendix 9, Appendix 10 and Appendix 11); and 72 class 3 genes are characterized by a HAO/LAO differential status in at least one of the antioxidant treatments but not for HV/LV, thus defining purely antioxidant effects in a high light environment (Appendix 11).
Figure 8
Figure 8
Molecular cell function analyses demonstrate differences in gene profiles. An Ingenuity Pathway Analysis (IPA) core analysis (Ingenuity® Systems) was performed using the differential gene marker data sets for (HV/LV), HR/LR, H Z+R/L Z+R, and H A+R/L A+R (Appendix 7, Appendix 8, Appendix 9, Appendix 10 and Appendix 11). A: Genes annotated by a single function (see the legend for designations) were extracted and used to generate a pie chart for each dietary treatment (H/L). Molecules with more complex multiple functions, or with unknown functions are categorized as “other.” Each dietary supplementation resulted in a different differential retinal gene profile with respect to a transition from a low to high light rearing environment. B: The information underlying the pathway analysis of each differential gene list and the IPA knowledge base was extracted. In total, 44 cell function or process categories were observed between the four differential comparisons. Not all categories are necessarily represented in each differential comparison. For each functional category in each comparison, the best matched pathway per category was ranked. The top 19 (HV/LV) ranked functional categories are graphed in reverse order. The corresponding ranking for the same functional categories for the different antioxidant supplemented comparisons are provided below the HV/LV graph. Comparison of individual rankings for each category from each differential comparison shows again that the functional nature of each set of genes is different. From a visual inspection HV/LV is more similar to the pattern seen in HR/LR and [H Z+R/LZ+R] is more similar with [H A+R/ L A+R].
Figure 9
Figure 9
Cell function and cell response trends. A: Differential selection leads to enrichment and depletion of genes defining specific cell function and cell response. A focused cell function analysis was performed. A Boolean search for specific text strings was used to mine the NCBI gene database. We specifically mined for genes pertaining to the following categories (inflammation, apoptosis, cytokine, innate immune, receptor, growth factor, stress response, and transcription factor). Genes related to each text string were mined, and only rat genes were retrieved. Each gene list retrieved was aligned against a non-redundant gene list representing the microarray used, and this, in turn, was aligned to the differential comparison output data. From these alignments, we extracted the information needed to set up and perform a Fisher’s exact test for each functional category. P>0.05 indicates the absence of significant enrichment. –Log (p value) was plotted so changes in a single unit represent, a ten-fold difference. The blue line just above the value of 1 indicates the equivalent cut-off point for a p value of 0.05. B: Summary of the differential expression status for retinal cell associated gene markers and G-protein coupled protein associated gene markers.

Similar articles

Cited by

References

    1. Eye Disease Case-Control Study Group Risk factors for neovascular age-related macular degeneration. Arch Ophthalmol. 1992;110:1701–8. - PubMed
    1. Zarbin M, Sunness JS. Dry age-related macular degeneration and age-related macular degeneration pathogenesis. In: Levin LA, Albert DM, editors. Ocular Disease: Mechanisms and Management. London: Saunders Elsevier; 2010. p. 527–535.
    1. Lederer DE, Cousins SW, Csaky KG. Neovascular age-related macular degeneration. In: Levin LA, Albert DM, editors. Ocular Disease: Mechanisms and Management. London: Saunders Elsevier; 2010. p. 536–543.
    1. Seddon JM, Ajani UA, Sperduto RD, Hiller R, Blair N, Burton TC, Farber MD, Gragoudas ES, Haller J, Miller DT, Yannuzzi LA, Willett W, Eye Disease Case-Control Study Group Dietary carotenoids, vitamin A, C, and E, and advanced age-related macular degeneration. JAMA. 1994;272:1413–20. - PubMed
    1. Berrow EJ, Bartlett HE, Eperjesi F, Gibson JM. Risk factors for age-related macular degeneration. European Ophthalmic Rev. 2011;5:143–53.

Publication types

MeSH terms