. 2017 Oct 6:17:80-89.
doi: 10.1016/j.nicl.2017.10.004. eCollection 2018.

PaCER - A fully automated method for electrode trajectory and contact reconstruction in deep brain stimulation

Affiliations

PaCER - A fully automated method for electrode trajectory and contact reconstruction in deep brain stimulation

Andreas Husch et al. Neuroimage Clin. .

Abstract

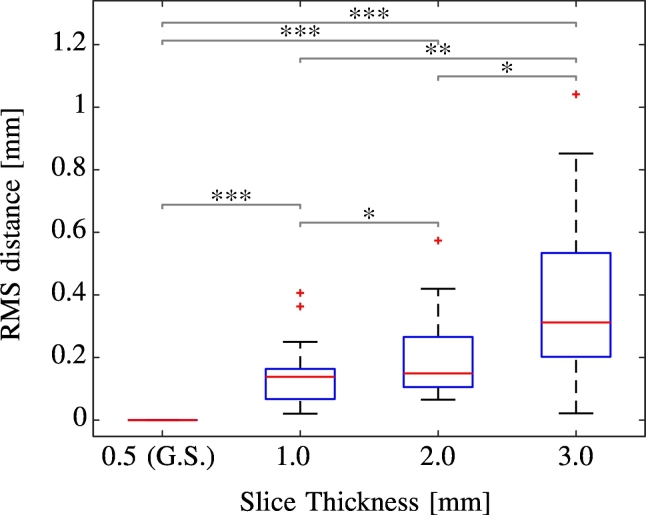
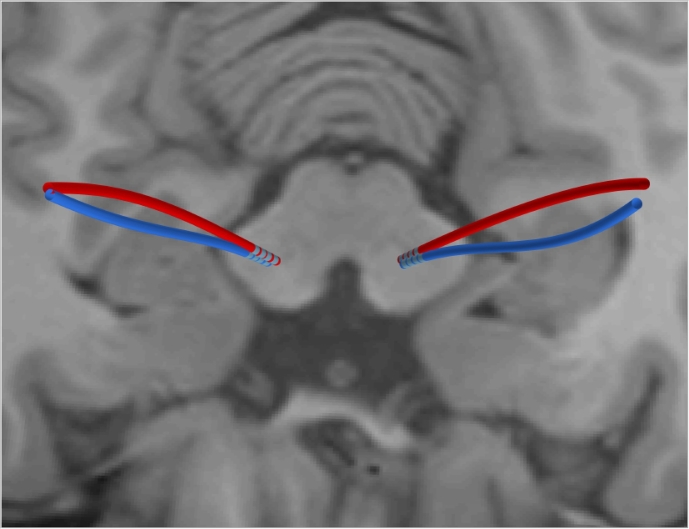
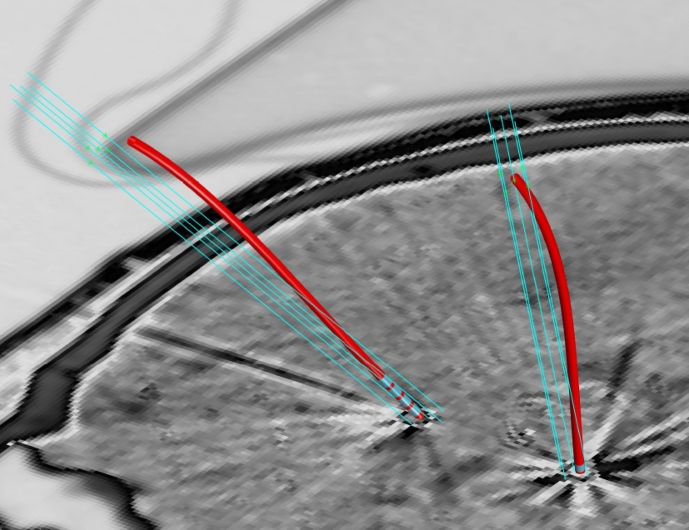
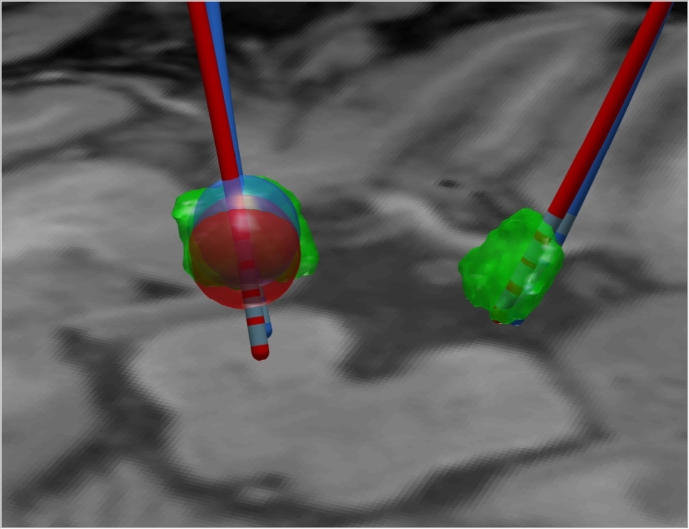
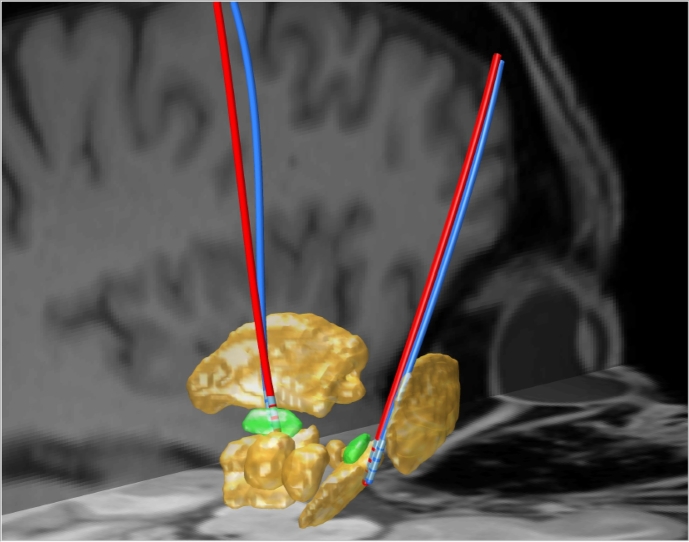
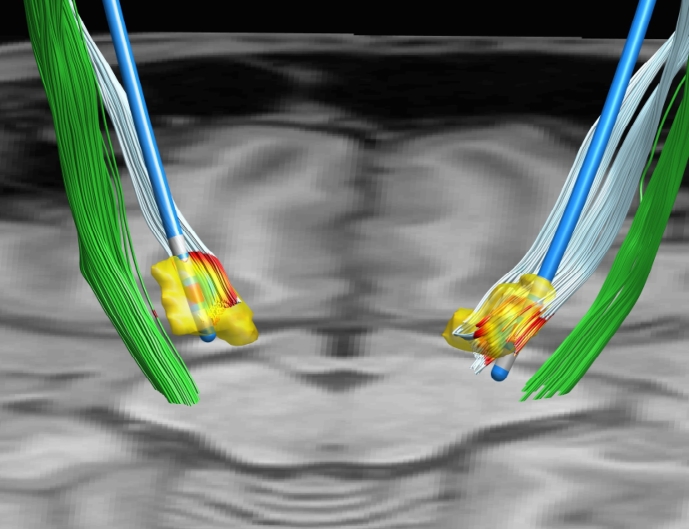
Deep brain stimulation (DBS) is a neurosurgical intervention where electrodes are permanently implanted into the brain in order to modulate pathologic neural activity. The post-operative reconstruction of the DBS electrodes is important for an efficient stimulation parameter tuning. A major limitation of existing approaches for electrode reconstruction from post-operative imaging that prevents the clinical routine use is that they are manual or semi-automatic, and thus both time-consuming and subjective. Moreover, the existing methods rely on a simplified model of a straight line electrode trajectory, rather than the more realistic curved trajectory. The main contribution of this paper is that for the first time we present a highly accurate and fully automated method for electrode reconstruction that considers curved trajectories. The robustness of our proposed method is demonstrated using a multi-center clinical dataset consisting of N = 44 electrodes. In all cases the electrode trajectories were successfully identified and reconstructed. In addition, the accuracy is demonstrated quantitatively using a high-accuracy phantom with known ground truth. In the phantom experiment, the method could detect individual electrode contacts with high accuracy and the trajectory reconstruction reached an error level below 100 μm (0.046 ± 0.025 mm). An implementation of the method is made publicly available such that it can directly be used by researchers or clinicians. This constitutes an important step towards future integration of lead reconstruction into standard clinical care.


Figures

Fig. 1
Fig. 1
Flowchart of PaCER electrode reconstruction. PaCER is organized in a pre-processing and three model fitting passes. The 1st pass fits a polynomial model to a set of lead skeleton points gained from the image pre-processing pipeline. The 2nd pass is a refinement stage where the 1st pass output is used together with the lead neighborhoods applying optimal oblique re-sampling. Thus the 2nd pass yields an improved model as well as intensity profiles of the electrodes. In the 3rd pass the intensity profiles are used for contact detection and zero-point calibration. Subsequently the model is refitted again to accurately reflect the detected zero-point.
Fig. 2
Fig. 2
Principle of optimal oblique re-sampling: (a): Axial CT slices (red) are evaluated in the pre-processing yielding a first electrode skeleton model (blue) of the underlying trajectory (gray) for the 1st pass, (b): using the analytic model from the 1st pass, oblique slices parallel to the normals of the model (green) are evaluated in the 2nd pass (Slice spacing and selected electrode part only for illustrative purposes).
Fig. 3
Fig. 3
Optimal oblique re-sampled (OOR) data stacked and displayed as a three plane MPR view cutting through the volume.
Fig. 4
Fig. 4
1D intensity profiles of a Medtronic 3387 Electrode scanned post-operatively at 0.7 mm slice thickness created using different operators (average, median, and median after thresholding). Note the four prominent signal peaks indicating the locations of the electrode contacts and compare with Fig. 3.
Fig. 5
Fig. 5
Definition of zero-point/origin of electrode space visualized for different electrode types. The origin is defined as the distal edge of the most distal electrode contact.
Fig. 6
Fig. 6
Acrylic glass phantom holding two electrodes (one curved, one straight-line) equipped with titanium reference balls for accurate registration.
Fig. 7
Fig. 7
Photogrammetry picture of the 3387 and 3389 electrode within the phantom. Note the slightly non-uniform contact spacings.
Fig. 8
Fig. 8
(a) Photogrammetry picture of the 3387 electrode within the phantom; (b) overlayed with the CT based 3D reconstruction using the presented algorithm. Note the visually perfect accuracy of trajectory as well as contact detection.
Fig. 9
Fig. 9
Influence of different slice thicknesses on contact localization in clinical data for Medtronic 3389 electrodes. RMS errors between the four contacts of 20 electrodes for three different resolution levels compared to a 0.5 mm scan used as gold-standard, * indicates p < 0.05, ** indicates p < 0.01, *** indicate p < 0.001 (paired Wilcoxon-Signed-Rank Test).
Fig. 10
Fig. 10
Electrode reconstruction from co-registered CT data one day after surgery (red) and one year later (blue). Co-registered T1 MRI displayed in background. Note the non-linear bending of the trajectories due to brain shift respectively inverse brain shift.
Fig. 11
Fig. 11
Planned micro electrode recording trajectories (light blue) and final electrode outcome revealed by PaCER (red) one day after surgery with brain shift still present.
Fig. 12
Fig. 12
Co-registered electrode reconstruction one day after surgery (red) and one year later (blue) together with manually segmented STN structures from T2 imaging (green). Electrode reconstruction reveals that DBS programming of the left electrode should assess the most proximal contact. Mädler/Coenen VTA estimates are indicated as blue repetitively red spheres. Note the upwards displacement of the later reconstruction.
Fig. 13
Fig. 13
Electrode reconstructions carried out in atlas space (high-resolution deep-brain atlas). The electrodes are displayed with the subcortical structures from the atlas. STNs highlighted in green.
Fig. 14
Fig. 14
PaCER electrode reconstruction and VTA approximation. Instead of displaying the VTA as a sphere (cf. Fig. 10), it is visualized as a colormap projected onto hyper-direct-pathway and cortico-spinal-tract fibers imported from MRtrix. Manually segmented STN is shown in yellow.

References

    1. Akram H., Sotiropoulos S.N., Jbabdi S., Georgiev D., Mahlknecht P., Hyam J., Foltynie T., Limousin P., De Vita E., Jahanshahi M., Hariz M., Ashburner J., Behrens T., Zrinzo L. Subthalamic deep brain stimulation sweet spots and hyperdirect cortical connectivity in parkinson's disease. NeuroImage. 2017;158:332–345. (Jul.) - PMC - PubMed
    1. Castrioto A., Lhommée E., Moro E., Krack P. Mood and behavioural effects of subthalamic stimulation in parkinson's disease. Lancet Neurol. 2014;13:287–305. (Mar.) - PubMed
    1. Chen L., Hallmann M., Romero D., Wang L., Astrom M., Ryzhkov M., Nijlunsing R., Meine H. Combining tubular tracking and skeletonization for fully-automatic and accurate lead localization in CT images. Int. J. Comput. Assist. Radiol. Surg. 2014;9(1):S195–S201. (may)
    1. Coenen V.A., Allert N., Paus S., Kronenbürger M., Urbach H., Mädler B. Modulation of the cerebello-thalamo-cortical network in thalamic deep brain stimulation for tremor: a diffusion tensor imaging study. Neurosurgery. 2014;75:657–669. (discussion 669-70, Dec.) - PubMed
    1. da Silva N.M., Rozanski V.E., Cunha J.P.S. Proc. 7th Int. IEEE/EMBS Conf. Neural Engineering (NER) 2015. A 3D multimodal approach to precisely locate dbs electrodes in the basal ganglia brain region; pp. 292–295. (Apr.)