. 2017 Oct 24:6:e29914.
doi: 10.7554/eLife.29914.

Patient-specific mutations impair BESTROPHIN1's essential role in mediating Ca2+-dependent Cl- currents in human RPE

Affiliations

Patient-specific mutations impair BESTROPHIN1's essential role in mediating Ca2+-dependent Cl- currents in human RPE

Yao Li et al. Elife. .

Abstract

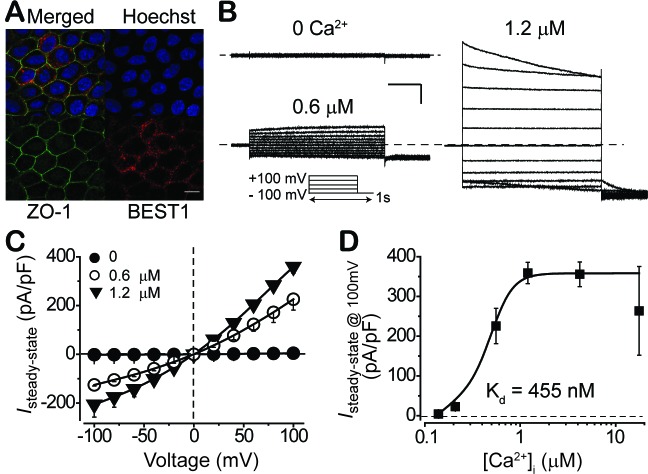
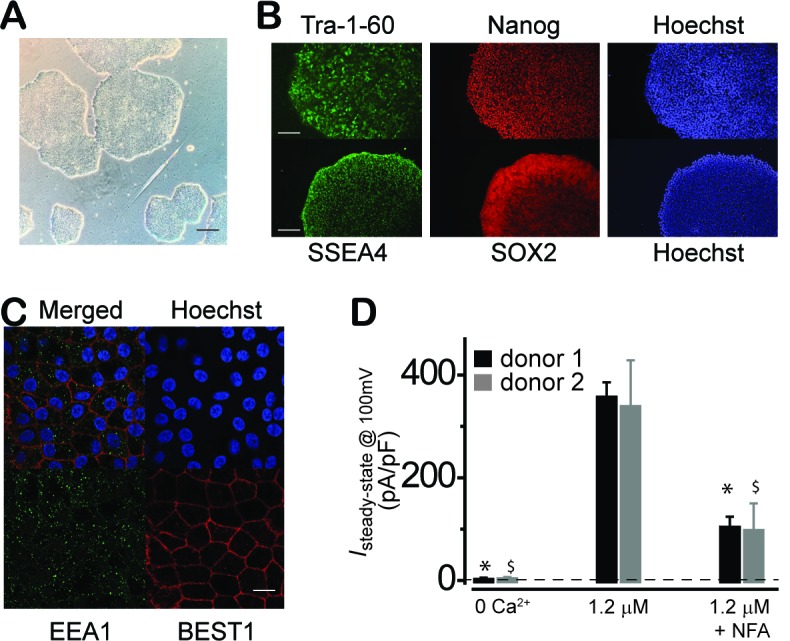
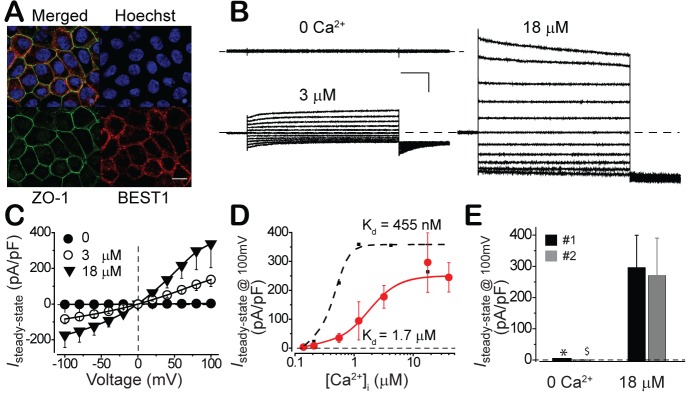
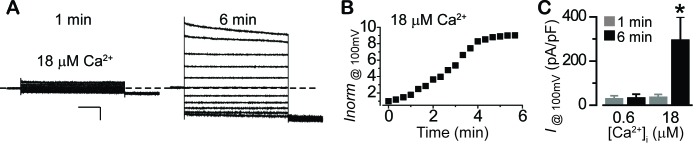
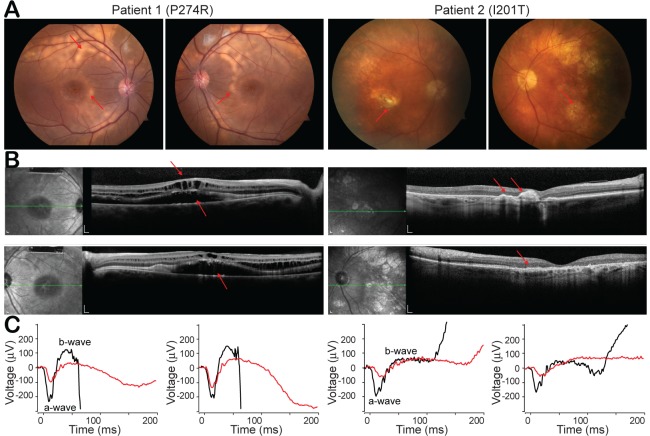
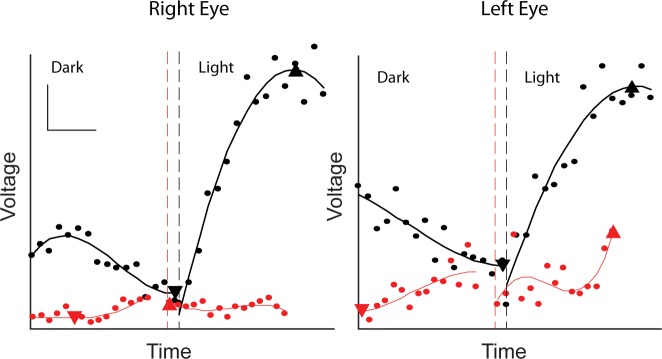
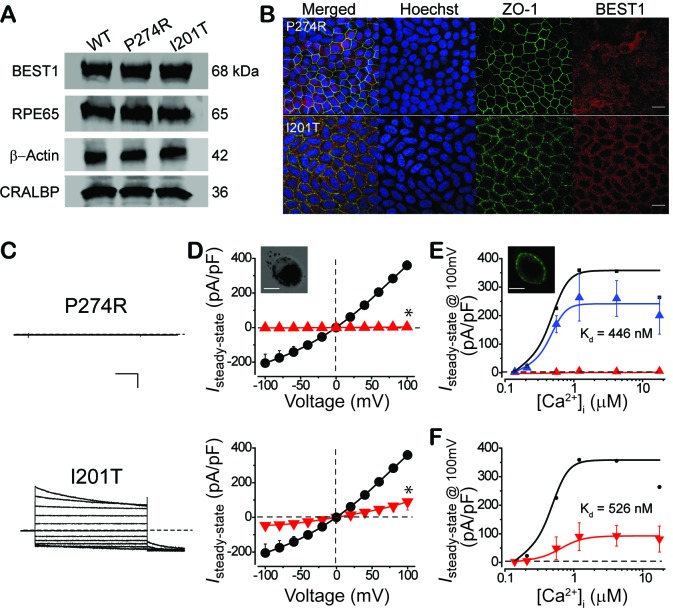
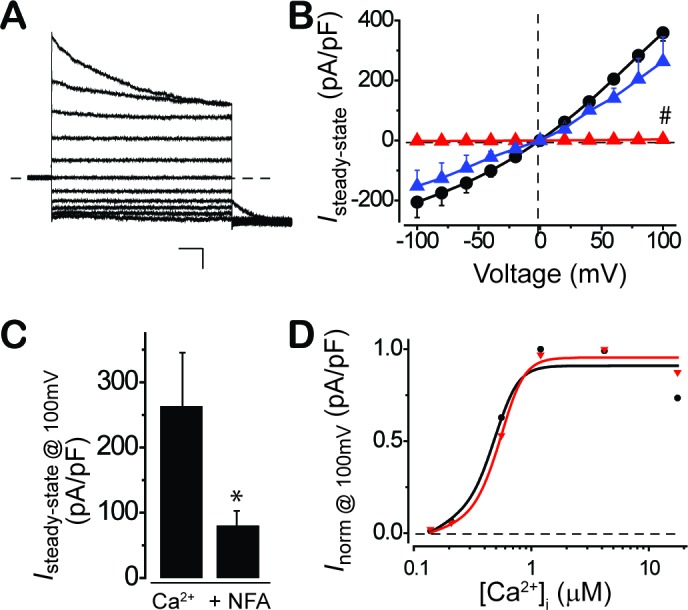
Mutations in the human BEST1 gene lead to retinal degenerative diseases displaying progressive vision loss and even blindness. BESTROPHIN1, encoded by BEST1, is predominantly expressed in retinal pigment epithelium (RPE), but its physiological role has been a mystery for the last two decades. Using a patient-specific iPSC-based disease model and interdisciplinary approaches, we comprehensively analyzed two distinct BEST1 patient mutations, and discovered mechanistic correlations between patient clinical phenotypes, electrophysiology in their RPEs, and the structure and function of BESTROPHIN1 mutant channels. Our results revealed that the disease-causing mechanism of BEST1 mutations is centered on the indispensable role of BESTROPHIN1 in mediating the long speculated Ca2+-dependent Cl- current in RPE, and demonstrate that the pathological potential of BEST1 mutations can be evaluated and predicted with our iPSC-based 'disease-in-a-dish' approach. Moreover, we demonstrated that patient RPE is rescuable with viral gene supplementation, providing a proof-of-concept for curing BEST1-associated diseases.

Keywords: BEST1; BESTROPHIN1; biophysics; calcium-activated chloride channel (CaCC); human; patient-specific iPSC-RPE; retinal diseases; retinal pigment epithelium (RPE); structural biology.


Conflict of interest statement

No competing interests declared.

Figures

Figure 1.
Figure 1.. Subcellular localization of BEST1 and surface Ca2+-dependent Cl- current in BEST1 WT donor iPSC-RPEs.
(A) Confocal images showing plasma membrane localization of BEST1. Scale bar, 10 μm. (B) Representative current traces recorded from a BEST1 WT donor iPSC-RPEs at various free [Ca2+]i. Voltage protocol used to elicit currents is shown in Insert. Scale bar, 1 nA, 150 ms. (C) Population steady-state current-voltage relationships at different free [Ca2+]i; n = 5–6 for each point. The plot was fitted to the Hill equation. (D) Ca2+-dependent activation of surface current. Steady-state current density recorded at +100 mV plotted vs. free [Ca2+]i; n = 5–6 for each point. See also Figure 1—figure supplements 1 and Figure 1—source data 1.
Figure 1—figure supplement 1.
Figure 1—figure supplement 1.. Characterization of WT iPSC and iPSC-RPE.
(A) Phase picture of established WT iPSC line before differentiation. Scale bar, 400 μm. (B) Immunocytofluorescence images of pluripotency markers in established iPSC. Scale bar, 200 μm. (C) Confocal images showing plasma membrane localization of BEST1. Scale bar, 10 μm. (D) Comparison of current amplitudes in iPSC-RPEs from two BEST1 WT donors. Bar chart showing the steady-state current amplitudes at 0 [Ca2+]i, 1.2 μM [Ca2+]i, and 1.2 μM [Ca2+]i + 100 μM NFA in RPEs from two distinct BEST1 WT human donors; n = 5–6. ∗$p<0.05 compared to current amplitudes at 1.2 μM [Ca2+]i from donor #1 and #2, respectively, using two-tailed unpaired Student t test.
Figure 2.
Figure 2.. Subcellular localization of BEST1 and surface Ca2+-dependent Cl- current in fhRPEs.
(A) Confocal images showing plasma membrane localization of BEST1. Scale bar, 10 μm. (B) Representative current traces recorded from a BEST1 WT fhRPEs at various free [Ca2+]i. Scale bar, 1 nA, 150 ms. (C) Population steady-state current-voltage relationships at different free [Ca2+]i; n = 5–6 for each point. (D) Ca2+-dependent activation of surface currents in fhRPE (●) and iPSC-RPE (●). Steady-state current density recorded at +100 mV plotted vs. free [Ca2+]i; n = 5–6 for each point. The plots were fitted to the Hill equation. (E) Bar chart showing the steady-state current amplitudes at 0 and 18 μM free [Ca2+]i in RPEs from two distinct human fetuses; n = 5–6. ∗$p<0.05 compared to fetus #1 (0.02) and #2 (0.02), respectively, at 18 μM [Ca2+]i using two-tailed unpaired Student t test. See also Figure 2—figure supplement 1.
Figure 2—figure supplement 1.
Figure 2—figure supplement 1.. The Ca2+and time-dependent activation of surface Cl- current in fhRPE.
(A) Representative current traces recorded from fhRPEs at 18 μM [Ca2+]i. Scale bar, 1 nA, 150 ms. (B) Time-dependent activation of surface Cl- current amplitudes when [Ca2+]i is 18 μM. (C) Bar chart showing different time-dependent activation under different [Ca2+]i; n = 5–6 for each bar. *p<0.05 compared to 1 min at 18 μM [Ca2+]i using two-tailed unpaired Student t test.
Figure 3.
Figure 3.. Clinical phenotypes of two patients with BEST1 mutations.
(A) Color fundus photographs from patient 1 (P274R) and patient 2 (I201T), right and left eyes, respectively. Both of the patients’ fundus show bilateral, confluent curvilinear subretinal yellowish vitelliform deposits (red arrow) superior to the optic disks and encircling the maculae. (B) SDOCTs of the macula in patient 1 and patient 2. Scale bar, 200 μm. In Patient 1, there are bilateral, multifocal serous retinal detachments involving the maculae and cystoid deposits in the macula (red arrow). Patient 2 presents a relative preservation of the retina change compared to patient 1. (C) ERGs of patient 1 and patient 2 (red lines), right and left eyes, respectively, show extinguished maximum response amplitudes between a- and b-waves, compared to those from age matched BEST1 WT controls (black lines). See also Figure 3—figure supplement 1.
Figure 3—figure supplement 1.
Figure 3—figure supplement 1.. Reduced EOG light peak in patient with BEST1 I201T mutation.
The EOG of BEST1 I201T patient (red) was compared to that of a similarly aged BEST1 WT person (black). Scale bar, 2 μV/deg, 5 min.
Figure 4.
Figure 4.. Subcellular localization of BEST1 and surface Ca2+-dependent Cl- current in patient-derived iPSC-RPEs.
(A) Western blots show similar BEST1 expression levels in WT and patient-derived iPSC-RPEs. Each sample was from one cell lysis (BEST1 and β-actin, RPE65 and CRALBP were on two gels, respectively). (B) Confocal images showing diminished plasma membrane localizations of BEST1 P274R, and normal plasma membrane localization of BEST1 I201T. Scale bar,15 μm. (C) Representative current traces recorded from patient iPSC-RPEs at 1.2 μM [Ca2+]i. Scale bar, 500 pA, 150 ms. (D) Population steady-state current-voltage relationships in BEST1 WT (●), P274R (▲) and I201T (▼) iPSC-RPEs at 1.2 μM [Ca2+]i; n = 5–6 for each point. p<0.05 (2 × 10⁻⁷ for P274R and 6 × 10⁻⁴ for I201T) compared to WT using two-tailed unpaired Student t test. Insert, confocal images showing P274R iPSC-RPE in bright field. Scale bar,10 μm. (E) CaCC currents in BEST1 P274R patient iPSC-RPE were rescued by complementation with WT BEST1-GFP. Complementation (▲, n = 5–6 for each point), compared to BEST1 P274R (▲, n = 3–5 for each point), and WT (●). The plots were fitted to the Hill equation. Insert, confocal images showing P274R iPSC-RPE complemented with WT BEST1-GFP expressed from a BacMam baculoviral vector. Scale bar,10 μm. (F) Ca2+-dependent currents in BEST1 I201T iPSC-RPE (▼) compared to WT iPSC-RPE (●). Steady-state current density recorded at +100 mV plotted vs. free [Ca2+]i; n = 5–6 for each point. The plots were fitted to the Hill equation. See also Figure 4—figure supplement 1 and Figure 1—source data 1.
Figure 4—figure supplement 1.
Figure 4—figure supplement 1.. CaCC currents in BEST1 patient iPSC-RPEs.
(A–C) P274R patient iPSC-RPE were rescued by complementation with WT BEST1-GFP at 1.2 μM [Ca2+]i. (A) Representative current traces recorded from P274R patient iPSC-RPE over-expressing WT BEST1-GFP. Scale bar, 1 nA, 100 ms. (B) Population steady-state current-voltage relationships in BEST1-GFP complementation (▲), compared to BEST1 P274R (▲) and WT (●); n = 5–6 for each point. #p<0.05 compared to WT (2 × 10⁻⁷) or complementation (0.01) using one-way ANOVA and Bonferroni post hoc analyses. (C) Bar chart showing the steady-state current amplitudes at 1.2 μM [Ca2+]i and 1.2 μM [Ca2+]i +100μM NFA in P274R patient iPSC-RPE over-expressing BEST1-GFP; n = 5–6. p<0.05 compared to current amplitudes at 1.2 μM [Ca2+]i, using two-tailed unpaired Student t test. (D) Normalized Ca2+-dependent currents in BEST1 I201T iPSC-RPE (▼) compared to WT iPSC-RPE (●). The plots were fitted to the Hill equation.
Figure 5.
Figure 5.. Surface Ca2+-dependent Cl- current in HEK293 cells expressing WT and mutant BEST1.
(A) Representative current traces recorded from transfected HEK293 cells at 1.2 μM [Ca2+]i. Scale bar, 150 pA, 150 ms. (B) Population steady-state current-voltage relationships for BEST1 WT (●), P274R (▲) and I201T (▼) at 1.2 μM [Ca2+]i; n = 5–6 for each point. ∗#p<0.05 compared to WT (8 × 10⁻⁴ for P274R and 0.01 for I201T) or to I201T (0.04), respectively, using one-way ANOVA and Bonferroni post hoc analyses. See also Figure 5—figure supplement 1.
Figure 5—figure supplement 1.
Figure 5—figure supplement 1.. Ca2+-dependent Cl- current in BEST1 transfected HEK293 cells.
(A) Representative current traces recorded from untransfected HEK293 cells at 1.2 μM [Ca2+]i. Scale bar, 150 pA, 150 ms. (B) Bar chart showing population steady-state current amplitudes at 100 mV; n = 5–6. p<0.05 compared to current amplitudes at 1.2 μM [Ca2+]i in HEK293 cells transfected with BEST1 WT using two-tailed unpaired Student t test. (C) Western blot showing similar expression levels of transiently transfected BEST1 WT, P274R and I201T in HEK293 cells.
Figure 6.
Figure 6.. Patient mutations in a BEST1 homology model.
(A) Left, ribbon diagram of the BEST1 pentamer with each protomer colored differently, as viewed from the side. Right, ribbon diagram of two oppositely facing (144°) protomers of a BEST1 pentamer are shown with the extracellular side on the top. The side chains of critical residues are in red. (B) Location of the patient mutations in relationship to the channel pore. Left, as viewed from the side; right, from inside the plasma membrane. (C) Visualization of the location of I201T. The side chains of critical residues are in red. See also Figure 6—figure supplements 1 and 2.
Figure 6—figure supplement 1.
Figure 6—figure supplement 1.. Structural analysis of BEST1 mutations in a homology model.
(A) 2D topology of a human BEST1 protomer, colored spectrally from blue at its N-terminal segment to red at its C-terminal segment. (B) Ribbon diagram of a human BEST1 protomer. Colored as in A. (C) Critical residues in hBest1 (BEST1), mBest2 (mouse bestrohpin2), dBest1 (Drosophila melanogaster bestrophin1) and cBest1 (chicken bestrophin1). Numbers showing the positions of residues in hBest1. (D) Visualization of P274 and the predicted steric clash by the P274R mutation. The side chains of critical residues are in red.
Figure 6—figure supplement 2.
Figure 6—figure supplement 2.. Structure-based sequence alignment of KpBest, hBest1 and cBest1.
The KpBest structure has been used to restrict sequence gaps to inter-helical segments. Black background, identical residues in all three sequences; grey background, identical residues in two sequences. The secondary structures of KpBest and cBest1 are labeled above and underneath the sequences, respectively.
Figure 7.
Figure 7.. Influence of patient mutations on single channel conductance.
(A) Bar chart showing purified KpBest WT and mutant pentameric protein per wet cell yields. n = 3 for each bar. p<0.05 compared to WT (2 × 10⁻³) or L177T (0.03) using two-tailed unpaired Student t test. (B) Current trace of KpBest WT and mutant single channels recorded from planar lipid bilayers at 80 mV with 150 mM NaCl in both cis and trans solutions. Scale bar, 2.5 pA, 250 ms. (C) Histograms showing single channel current amplitudes of KpBest WT and the L177T mutant. n = 3.
Figure 8.
Figure 8.. Superposition of KpBest WT with L177T mutant based on regional alignment of residues 174–180.
Ribbon diagram of the KpBest WT chain A (blue) and KpBest L177T chain A (green) with highlighted stick diagram of residue 177. See also Figure 8—figure supplement 1 and Figure 8—source data 1.
Figure 8—figure supplement 1.
Figure 8—figure supplement 1.. Crystal structure of KpBest L177T.
Stereo images of the electron density maps (2Fo-Fc map, 1.2σ level) of KpBest WT (top, 2.3 Å) and L177T (bottom, 3.1 Å) presenting residues 174–180 for divergent ‘wall-eyed’ viewing.

References

    1. Adams PD, Afonine PV, Bunkóczi G, Chen VB, Davis IW, Echols N, Headd JJ, Hung LW, Kapral GJ, Grosse-Kunstleve RW, McCoy AJ, Moriarty NW, Oeffner R, Read RJ, Richardson DC, Richardson JS, Terwilliger TC, Zwart PH. PHENIX: a comprehensive Python-based system for macromolecular structure solution. Acta Crystallographica Section D Biological Crystallography. 2010;66:213–221. doi: 10.1107/S0907444909052925. - DOI - PMC - PubMed
    1. Allikmets R, Seddon JM, Bernstein PS, Hutchinson A, Atkinson A, Sharma S, Gerrard B, Li W, Metzker ML, Wadelius C, Caskey CT, Dean M, Petrukhin K. Evaluation of the Best disease gene in patients with age-related macular degeneration and other maculopathies. Human Genetics. 1999;104:449–453. doi: 10.1007/s004390050986. - DOI - PubMed
    1. Barro-Soria R, Aldehni F, Almaça J, Witzgall R, Schreiber R, Kunzelmann K. ER-localized bestrophin 1 activates Ca2+-dependent ion channels TMEM16A and SK4 possibly by acting as a counterion channel. Pflügers Archiv - European Journal of Physiology. 2010;459:485–497. doi: 10.1007/s00424-009-0745-0. - DOI - PubMed
    1. Boon CJ, Klevering BJ, Leroy BP, Hoyng CB, Keunen JE, den Hollander AI. The spectrum of ocular phenotypes caused by mutations in the BEST1 gene. Progress in Retinal and Eye Research. 2009;28:187–205. doi: 10.1016/j.preteyeres.2009.04.002. - DOI - PubMed
    1. Burgess R, Millar ID, Leroy BP, Urquhart JE, Fearon IM, De Baere E, Brown PD, Robson AG, Wright GA, Kestelyn P, Holder GE, Webster AR, Manson FD, Black GC. Biallelic mutation of BEST1 causes a distinct retinopathy in humans. The American Journal of Human Genetics. 2008;82:19–31. doi: 10.1016/j.ajhg.2007.08.004. - DOI - PMC - PubMed

Publication types

MeSH terms