

Integration of mechanistic and pharmacokinetic information to derive oral reference dose and margin-of-exposure values for hexavalent chromium
- PMID: 29064106
- PMCID: PMC5813206
- DOI: 10.1002/jat.3545
Integration of mechanistic and pharmacokinetic information to derive oral reference dose and margin-of-exposure values for hexavalent chromium
Abstract
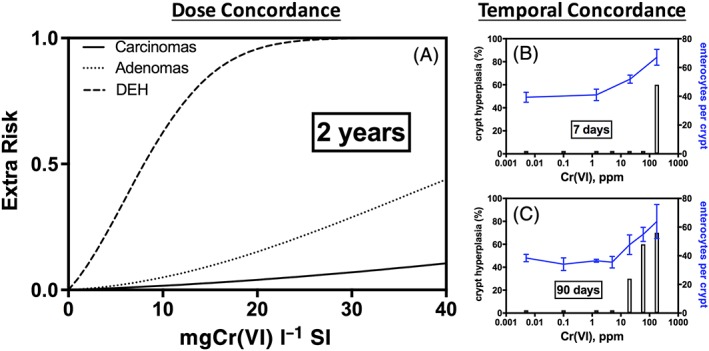
The current US Environmental Protection Agency (EPA) reference dose (RfD) for oral exposure to chromium, 0.003 mg kg-1 day-1 , is based on a no-observable-adverse-effect-level from a 1958 bioassay of rats exposed to ≤25 ppm hexavalent chromium [Cr(VI)] in drinking water. EPA characterizes the confidence in this RfD as "low." A more recent cancer bioassay indicates that Cr(VI) in drinking water is carcinogenic to mice at ≥30 ppm. To assess whether the existing RfD is health protective, neoplastic and non-neoplastic lesions from the 2 year cancer bioassay were modeled in a three-step process. First, a rodent physiological-based pharmacokinetic (PBPK) model was used to estimate internal dose metrics relevant to each lesion. Second, benchmark dose modeling was conducted on each lesion using the internal dose metrics. Third, a human PBPK model was used to estimate the daily mg kg-1 dose that would produce the same internal dose metric in both normal and susceptible humans. Mechanistic research into the mode of action for Cr(VI)-induced intestinal tumors in mice supports a threshold mechanism involving intestinal wounding and chronic regenerative hyperplasia. As such, an RfD was developed using incidence data for the precursor lesion diffuse epithelial hyperplasia. This RfD was compared to RfDs for other non-cancer endpoints; all RfD values ranged 0.003-0.02 mg kg-1 day-1 . The lowest of these values is identical to EPA's existing RfD value. Although the RfD value remains 0.003 mg kg-1 day-1 , the confidence is greatly improved due to the use of a 2-year bioassay, mechanistic data, PBPK models and benchmark dose modeling.
Keywords: benchmark dose (BMD) modeling; hexavalent chromium Cr(VI); margin of exposure (MOE); mode of action; reference dose (RfD); risk assessment.
© 2017 The Authors. Journal of Applied Toxicology Published by John Wiley & Sons Ltd.
Figures


Similar articles
-
A chronic oral reference dose for hexavalent chromium-induced intestinal cancer.J Appl Toxicol. 2014 May;34(5):525-36. doi: 10.1002/jat.2907. Epub 2013 Aug 14. J Appl Toxicol. 2014. PMID: 23943231 Free PMC article.
-
Consideration of non-linear, non-threshold and threshold approaches for assessing the carcinogenicity of oral exposure to hexavalent chromium.Regul Toxicol Pharmacol. 2015 Dec;73(3):834-52. doi: 10.1016/j.yrtph.2015.10.011. Epub 2015 Oct 19. Regul Toxicol Pharmacol. 2015. PMID: 26493004
-
Determination of a site-specific reference dose for methylmercury for fish-eating populations.Toxicol Ind Health. 2000 Nov;16(9-10):335-438. doi: 10.1177/074823370001600901. Toxicol Ind Health. 2000. PMID: 11762928 Review.
-
Comparison of in vivo genotoxic and carcinogenic potency to augment mode of action analysis: Case study with hexavalent chromium.Mutat Res Genet Toxicol Environ Mutagen. 2016 Apr;800-801:28-34. doi: 10.1016/j.mrgentox.2016.01.008. Epub 2016 Mar 6. Mutat Res Genet Toxicol Environ Mutagen. 2016. PMID: 27085472
-
Assessment of the mode of action underlying development of rodent small intestinal tumors following oral exposure to hexavalent chromium and relevance to humans.Crit Rev Toxicol. 2013 Mar;43(3):244-74. doi: 10.3109/10408444.2013.768596. Crit Rev Toxicol. 2013. PMID: 23445218 Free PMC article. Review.
Cited by
-
Chemical Components in the Breast Milk of Passive Smoker Women: A Systematic Review and Health Risks Assessment.Biol Trace Elem Res. 2025 Mar 28. doi: 10.1007/s12011-025-04595-0. Online ahead of print. Biol Trace Elem Res. 2025. PMID: 40153149
-
Analysis of non-carcinogenic health risk assessment of elemental impurities in vitamin C supplements.Iran J Basic Med Sci. 2023 Feb;26(2):216-227. doi: 10.22038/IJBMS.2022.67487.14789. Iran J Basic Med Sci. 2023. PMID: 36742135 Free PMC article.
-
Development of the InTelligence And Machine LEarning (TAME) Toolkit for Introductory Data Science, Chemical-Biological Analyses, Predictive Modeling, and Database Mining for Environmental Health Research.Front Toxicol. 2022 Jun 22;4:893924. doi: 10.3389/ftox.2022.893924. eCollection 2022. Front Toxicol. 2022. PMID: 35812168 Free PMC article.
-
Acetaminophen Modulates the Expression of Steroidogenesis-Associated Genes and Estradiol Levels in Human Placental JEG-3 Cells.Toxicol Sci. 2021 Jan 6;179(1):44-52. doi: 10.1093/toxsci/kfaa160. Toxicol Sci. 2021. PMID: 33098425 Free PMC article.
References
-
- Ayazi, S. , Leers, J. M. , Oezcelik, A. , Abate, E. , Peyre, C. G. , Hagen, J. A. , … Crookes, P. F. (2009). Measurement of gastric pH in ambulatory esophageal pH monitoring. Surgical Endoscopy, 23(9), 1968–1973. - PubMed
-
- Banu, S. K. , Stanley, J. A. , Sivakumar, K. K. , Arosh, J. A. , Taylor, R. J. , & Burghardt, R. C. (2017). Chromium VI‐Induced developmental toxicity of placenta is mediated through spatiotemporal dysregulation of cell survival and apoptotic proteins. Reproductive Toxicology, 68, 171–190. https://doi.org/10.1016/j.reprotox.2016.07.006 - DOI - PMC - PubMed
-
- Barlow, S. , Renwick, A. G. , Kleiner, J. , Bridges, J. W. , Busk, L. , Dybing, E. , … Wurtzen, G. (2006). Risk assessment of substances that are both genotoxic and carcinogenic report of an International Conference organized by EFSA and WHO with support of ILSI Europe. Food and Chemical Toxicology, 44, 1636–1650. https://doi.org/10.1016/j.fct.2006.06.020 - DOI - PubMed
-
- Becker, R. A. , Ankley, G. T. , Edwards, S. W. , Kennedy, S. W. , Linkov, I. , Meek, B. , … Barton‐Maclaren, T. S. (2015). Increasing scientific confidence in adverse outcome pathways: Application of tailored Bradford‐Hill considerations for evaluating weight of evidence. Regulatory Toxicology and Pharmacology, 72, 514–537. https://doi.org/10.1016/j.yrtph.2015.04.004 - DOI - PubMed
-
- Brix, A. E. , Hardisty, J. F. , & McConnell, E. E. (2010). Combining neoplasms for evaluation of rodent carcinogenesis studies In Hsu C. H., & Stedeford T. (Eds.), Cancer Risk Assessment (pp. 699–715). Hoboken, NJ, USA: John Wiley & Sons; https://doi.org/10.1002/9780470622728.ch28 - DOI
Publication types
MeSH terms
Substances
LinkOut - more resources
Full Text Sources
Other Literature Sources
Research Materials
