. 2018 Feb 1;197(3):313-324.
doi: 10.1164/rccm.201706-1070OC.

IFN-stimulated Gene Expression, Type 2 Inflammation, and Endoplasmic Reticulum Stress in Asthma

Affiliations

IFN-stimulated Gene Expression, Type 2 Inflammation, and Endoplasmic Reticulum Stress in Asthma

Nirav R Bhakta et al. Am J Respir Crit Care Med. .

Abstract

Rationale: Quantification of type 2 inflammation provided a molecular basis for heterogeneity in asthma. Non-type 2 pathways that contribute to asthma pathogenesis are not well understood.

Objectives: To identify dysregulated pathways beyond type 2 inflammation.

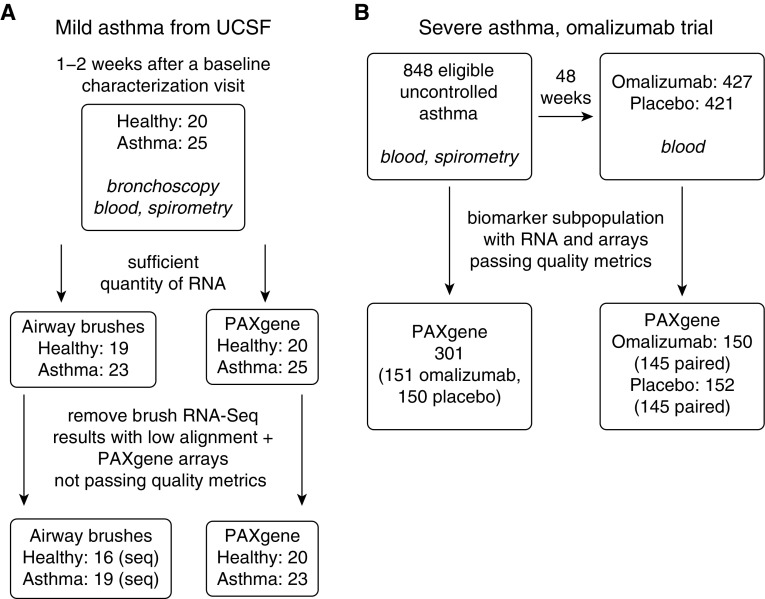
Methods: We applied RNA sequencing to airway epithelial brushings obtained from subjects with stable mild asthma not on corticosteroids (n = 19) and healthy control subjects (n = 16). Sequencing reads were mapped to human and viral genomes. In the same cohort, and in a separate group with severe asthma (n = 301), we profiled blood gene expression with microarrays.

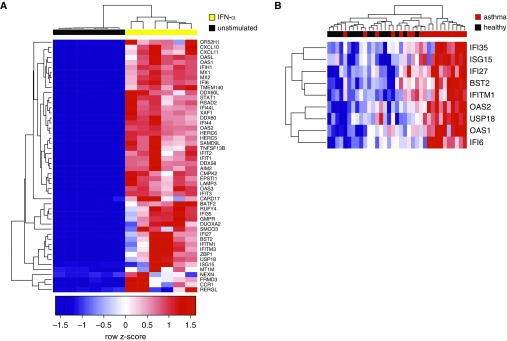
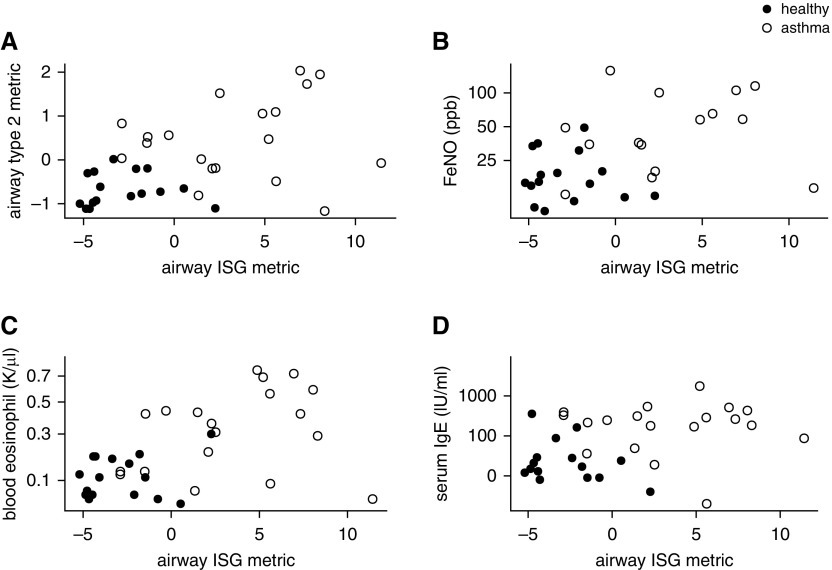
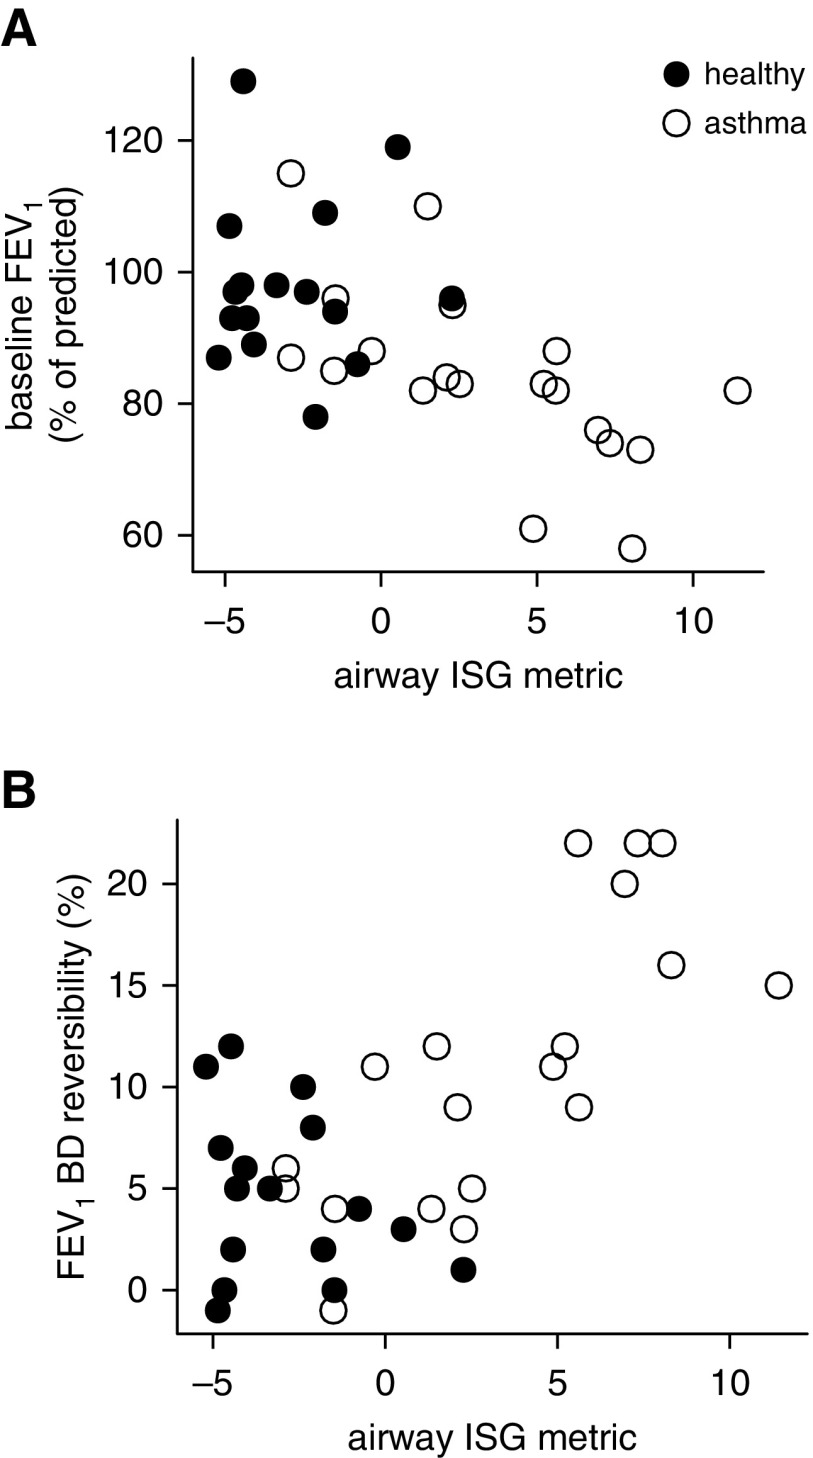
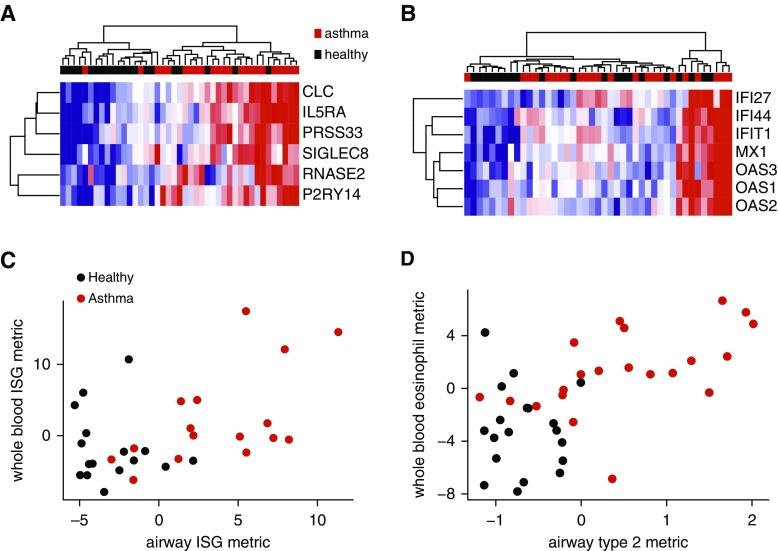
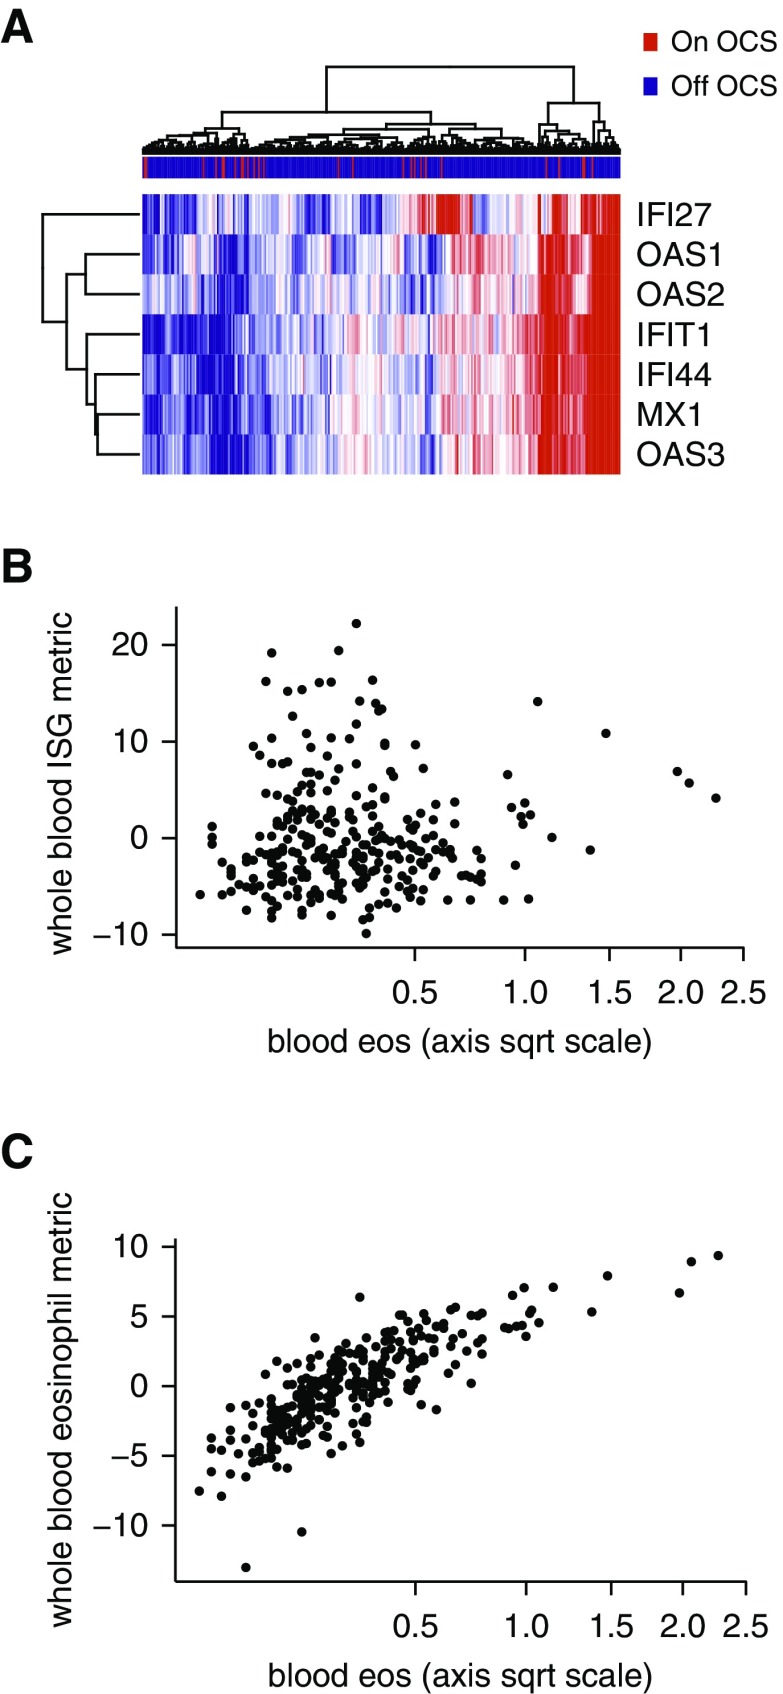
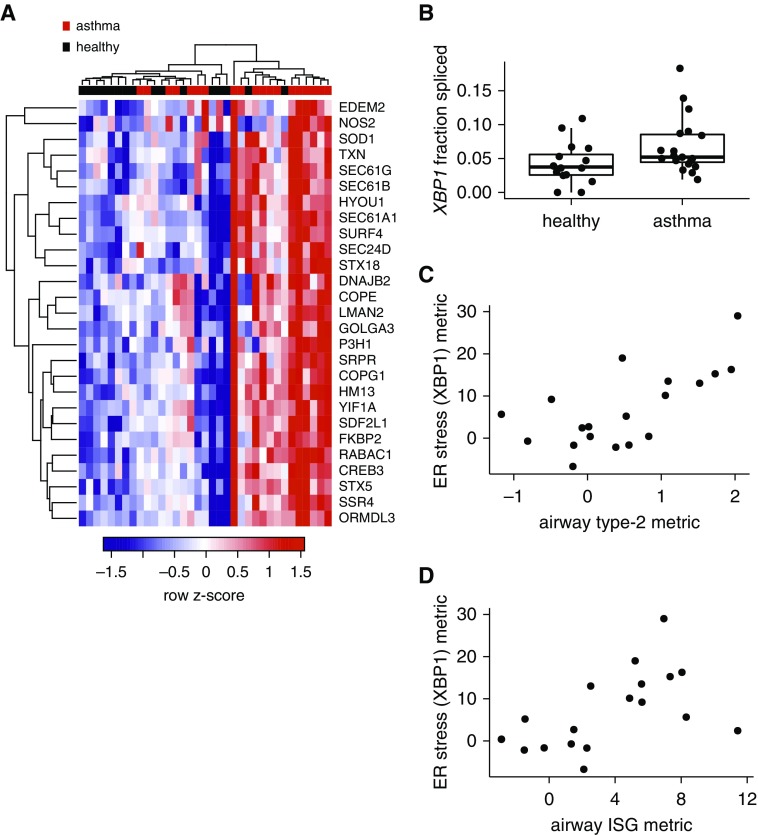
Measurements and main results: In airway brushings from mild asthma on inhaled corticosteroids, RNA sequencing yielded 1,379 differentially expressed genes (false discovery rate < 0.01). Pathway analysis revealed increased expression of type 2 markers, IFN-stimulated genes (ISGs), and endoplasmic reticulum (ER) stress-related genes. Airway epithelial ISG expression was not associated with type 2 inflammation in asthma or with viral transcripts but was associated with reduced lung function by FEV1 (ρ = -0.72; P = 0.0004). ER stress was confirmed by an increase in XBP1 (X-box binding protein 1) splicing in mild asthma and was associated with both type 2 inflammation and ISG expression. ISGs were also the most activated genes in blood cells in asthma and were correlated with airway ISG expression (ρ = 0.55; P = 0.030). High blood ISG expression in severe asthma was similarly unrelated to type 2 inflammation.

Conclusions: ISG activation is prominent in asthma, independent of viral transcripts, orthogonal to type 2 inflammation, and associated with distinct clinical features. ER stress is associated with both type 2 inflammation and ISG expression.

Keywords: IFNs; asthma; blood gene expression; endoplasmic reticulum stress; type 2 inflammation.


Figures

Figure 1.
Figure 1.
Cohorts and samples contributing to the results in this publication. (A) Sample numbers from the mild asthma cohort from University of California, San Francisco (UCSF) before treatment with inhaled corticosteroids. Dropout from low RNA quantity was caused by inadequate RNA remaining for sequencing given that microarray and qPCR studies had used RNA from this study population previously. After sequencing, four subjects with mild asthma and three healthy control samples were removed from further analysis because of high mitochondrial RNA and ribosomal RNA abundance leading to insufficient depth of sequencing of protein coding reads. (B) Sample numbers from the randomized placebo-controlled trial of omalizumab in severe asthma. PAXgene = whole blood RNA collection tube; RNA-seq = RNA sequencing.
Figure 2.
Figure 2.
Development of an airway epithelial brushing IFN-stimulated gene expression metric in mild asthma. (A) Hierarchical clustering of primary human epithelial cells cultured at an air–liquid interface (columns) using the top 50 (by fold-difference) genes (rows) induced by IFN-α (yellow, n = 6) relative to unstimulated (black, n = 6). All gene expression measurements are from RNA sequencing, with blue indicating low relative expression, and red indicating high relative expression. (B) Visualization of intersection of genes upregulated in asthma relative to health (false discovery rate < 0.01) and IFN-α–stimulated genes from A by supervised hierarchical clustering. n = 19 asthma (red); n = 16 healthy (black).
Figure 3.
Figure 3.
Airway IFN-stimulated gene expression is not associated with airway type 2 inflammation. The airway IFN-stimulated gene metric was calculated from the expression of the nine signature genes in airway epithelial brushings acquired at bronchoscopy. Covariates were measured at baseline. Scatterplots of covariates versus the airway IFN-stimulated gene metric are shown for the following variables. (A) Airway epithelial type 2 gene expression metric (n = 16 healthy [solid circles] and n = 19 mild asthma [open circles]; ρ = 0.12; P = 0.62 within asthma). (B) Exhaled nitric oxide on a log10 axis (n = 16 healthy [solid circles] and n = 15 mild asthma [open circles]; ρ = 0.30; P = 0.28 within asthma). (C) Blood eosinophils on a square root axis (n = 16 healthy [solid circles] and n = 19 mild asthma [open circles]; ρ = 0.22; P = 0.36 within asthma). (D) Total serum IgE (n = 15 healthy [solid circles] and n = 19 mild asthma [open circles]; ρ = −0.023; P = 0.93 within asthma). Spearman rank correlation used in all cases. FeNO = fractional exhaled nitric oxide; ISG = IFN-stimulated gene.
Figure 4.
Figure 4.
Relationship of airway IFN-stimulated gene expression to lung function in mild asthma. (A) Baseline FEV1 as a percent of the predicted value, measured immediately before and on the day of bronchoscopy before bronchodilator (BD) (ρ = −0.72; P = 0.0004 within asthma). (B) Change in FEV1 as a percentage of predicted after administration of BD (ρ = 0.75; P = 0.0002 within asthma). Spearman rank correlation used and n = 16 healthy (solid circles) and n = 19 asthma (open circles) in all cases. ISG = IFN-stimulated gene.
Figure 5.
Figure 5.
Whole-blood gene expression reflects airway IFN-stimulated gene expression in mild asthma. (A) Unsupervised hierarchical clustering of whole-blood gene expression by six eosinophil-associated genes differentially expressed in asthma (P < 0.05). Samples (columns) were collected on the day of and immediately preceding bronchoscopy. Gene expression measurements are from microarrays, with blue indicating low relative expression, and red indicating high relative expression. n = 23 asthma (red) and n = 20 healthy (black). (B) Unsupervised hierarchical clustering of whole-blood gene expression by seven IFN-stimulated genes previously identified in whole blood. (C) Whole-blood IFN-stimulated gene metric versus airway (epithelial brushing) IFN-stimulated gene metric (n = 16 asthma; ρ = 0.55; P = 0.030). (D) Whole-blood eosinophil-associated gene metric versus blood eosinophils (n = 21 asthma; ρ = 0.68; P = 0.00094). Whole-blood gene expression metrics were made in the same manner as they were for the airway samples and related across tissues. Spearman rank correlation used in all cases. ISG = IFN-stimulated gene.
Figure 6.
Figure 6.
IFN-stimulated gene (ISG) expression is increased in severe asthma and unrelated to type 2 inflammation. (A) Unsupervised hierarchical clustering of whole-blood gene expression by seven ISGs. Severe asthma samples (columns) were collected at baseline before change in treatment. Gene expression measurements are from microarrays, with blue indicating low relative expression, and red indicating high relative expression, n = 301 severe asthma (color-coded red if on oral corticosteroids). (B) Whole-blood ISG expression is not related to blood eosinophil count, a measure of type 2 inflammation (n = 288 severe asthma; ρ = 0.057; P = 0.34). (C) Whole-blood eosinophil-associated gene expression is associated with blood eosinophil count (n = 288 severe asthma; ρ = 0.82; P < 2.2 × 10−16). Spearman rank correlation was used in both B and C. eos = eosinophils; OCS = oral corticosteroids; sqrt = square root.
Figure 7.
Figure 7.
Epithelial endoplasmic reticulum (ER) stress markers are elevated in mild asthma and associated with both high type 2 inflammation and IFN-stimulated gene expression. (A) Hierarchical clustering of airway epithelial brushing gene expression samples (columns) using genes differentially expressed (false discovery rate < 0.01) in asthma versus health and downstream of XBP1 (X-box binding protein 1) in IPA. (B) XBP1 splicing assessed bioinformatically from RNA sequencing data through use of the rMATS package in R (false discovery rate = 0.0001 for genome-wide splicing analysis). (C) Relationship of an ER stress gene expression metric consisting of genes downstream of XBP1 per IPA, to airway type 2 inflammation (n = 19 mild asthma; ρ = 0.62; P = 0.0058). (D) ER stress gene expression metric versus the airway IFN-stimulated gene metric (n = 19 mild asthma; ρ = 0.62; P = 0.0052). Only asthma shown. IPA = ingenuity pathway analysis; ISG = IFN-stimulated gene.

Comment in

References

    1. Woodruff PG, Modrek B, Choy DF, Jia G, Abbas AR, Ellwanger A, et al. T-helper type 2-driven inflammation defines major subphenotypes of asthma. Am J Respir Crit Care Med. 2009;180:388–395. - PMC - PubMed
    1. Bhakta NR, Solberg OD, Nguyen CP, Nguyen CN, Arron JR, Fahy JV, et al. A qPCR-based metric of Th2 airway inflammation in asthma. Clin Transl Allergy. 2013;3:1–9. - PMC - PubMed
    1. Ray A, Raundhal M, Oriss TB, Ray P, Wenzel SE. Current concepts of severe asthma. J Clin Invest. 2016;126:2394–2403. - PMC - PubMed
    1. Fahy JV. Type 2 inflammation in asthma: present in most, absent in many. Nat Rev Immunol. 2015;15:57–65. - PMC - PubMed
    1. ’t Hoen PA, Friedländer MR, Almlöf J, Sammeth M, Pulyakhina I, Anvar SY, et al. GEUVADIS Consortium. Reproducibility of high-throughput mRNA and small RNA sequencing across laboratories. Nat Biotechnol. 2013;31:1015–1022. - PubMed

Publication types