. 2017 Oct 24:6:e29430.
doi: 10.7554/eLife.29430.

Allosteric fine-tuning of the conformational equilibrium poises the chaperone BiP for post-translational regulation

Affiliations

Allosteric fine-tuning of the conformational equilibrium poises the chaperone BiP for post-translational regulation

Lukasz Wieteska et al. Elife. .

Abstract

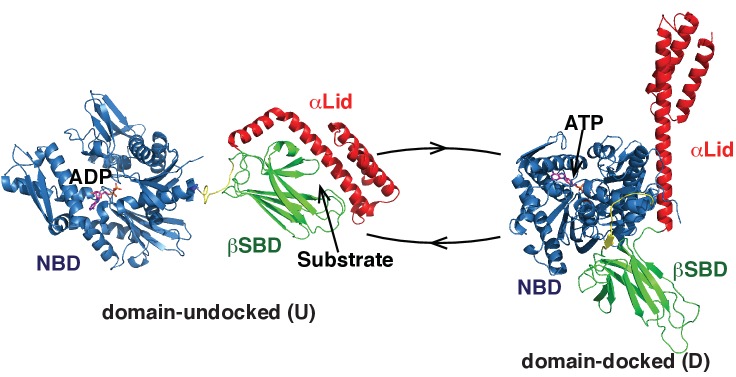
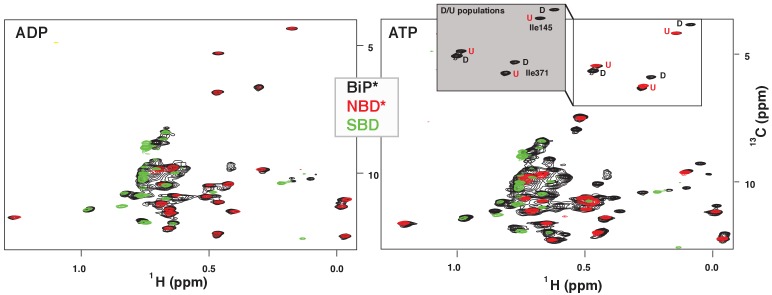
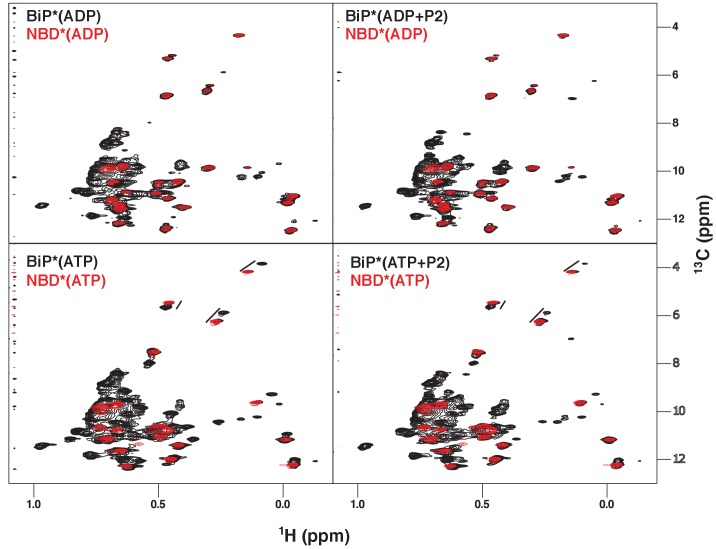
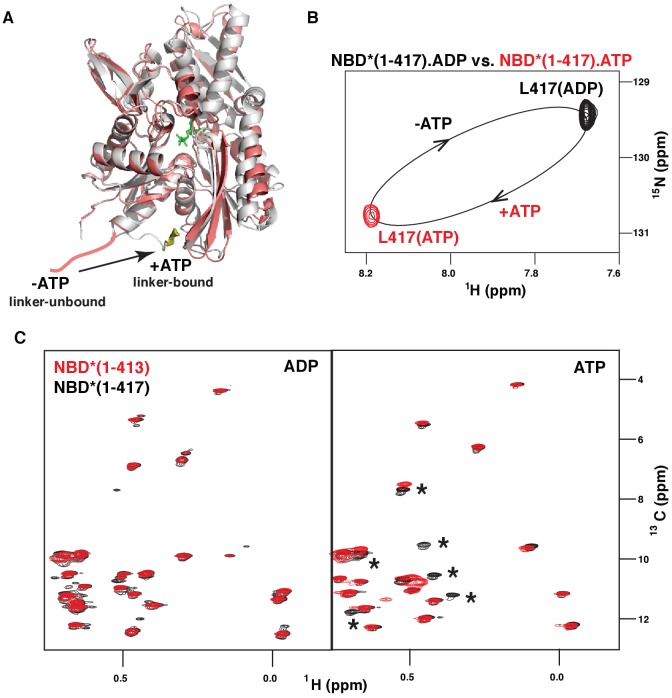
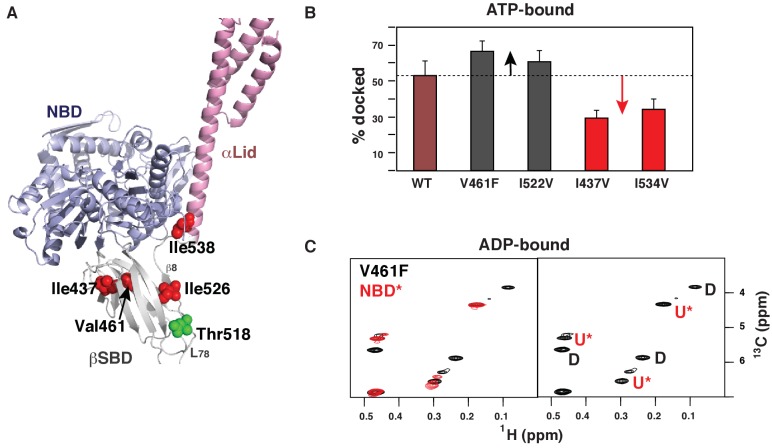
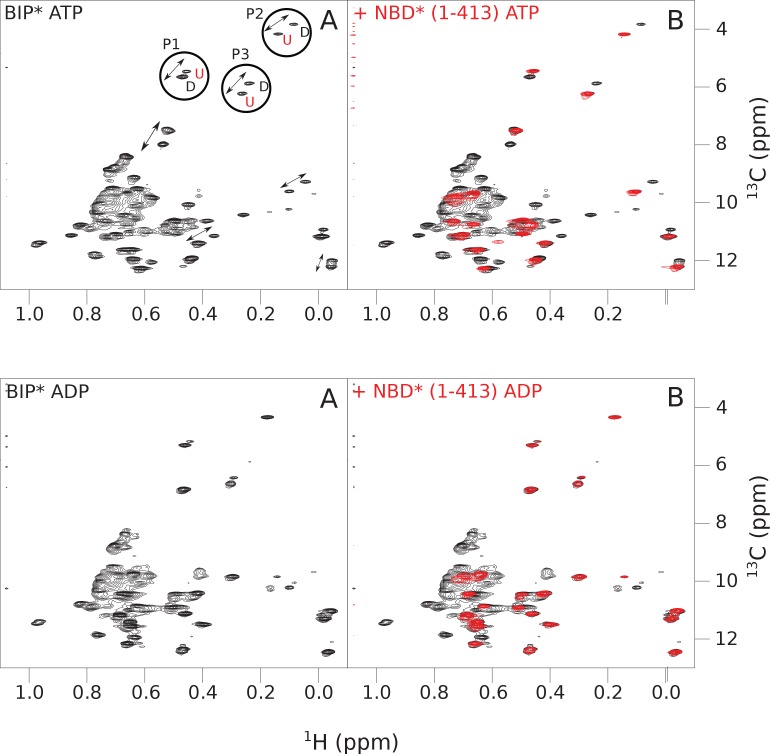
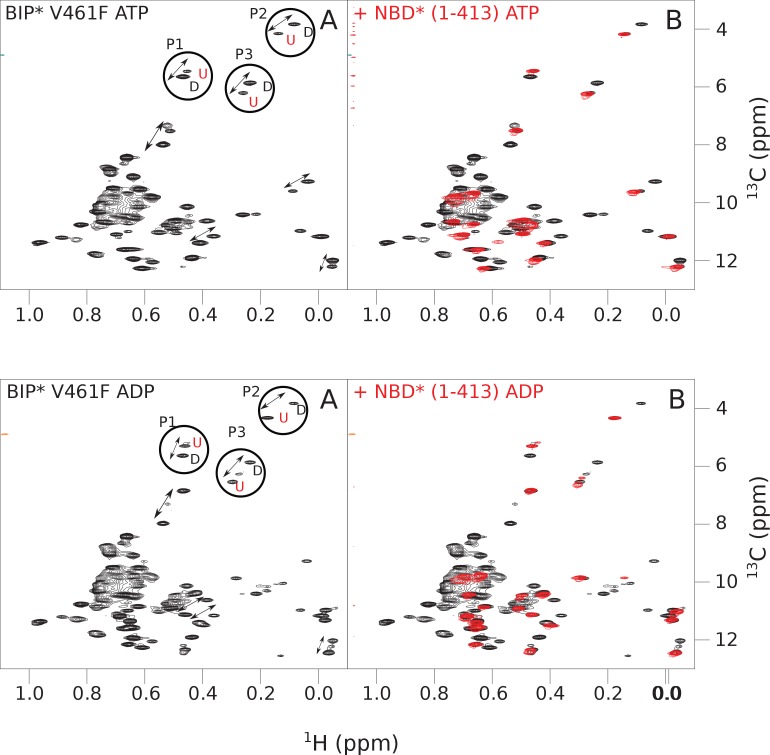
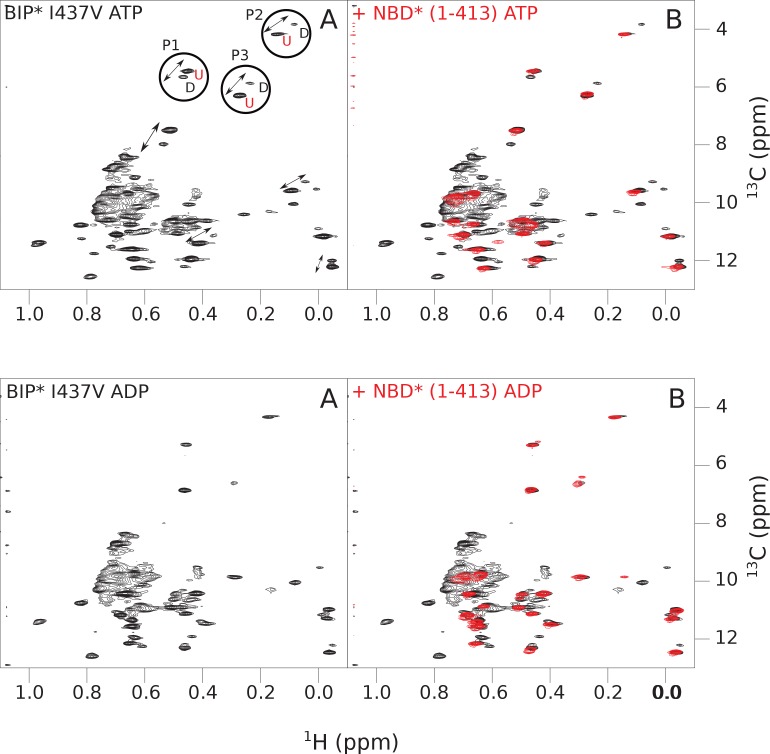
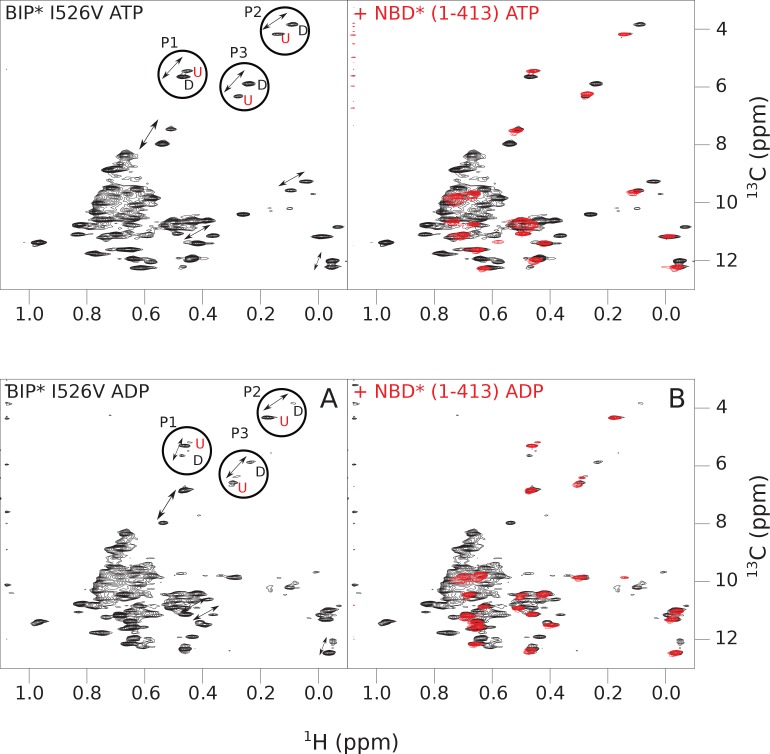
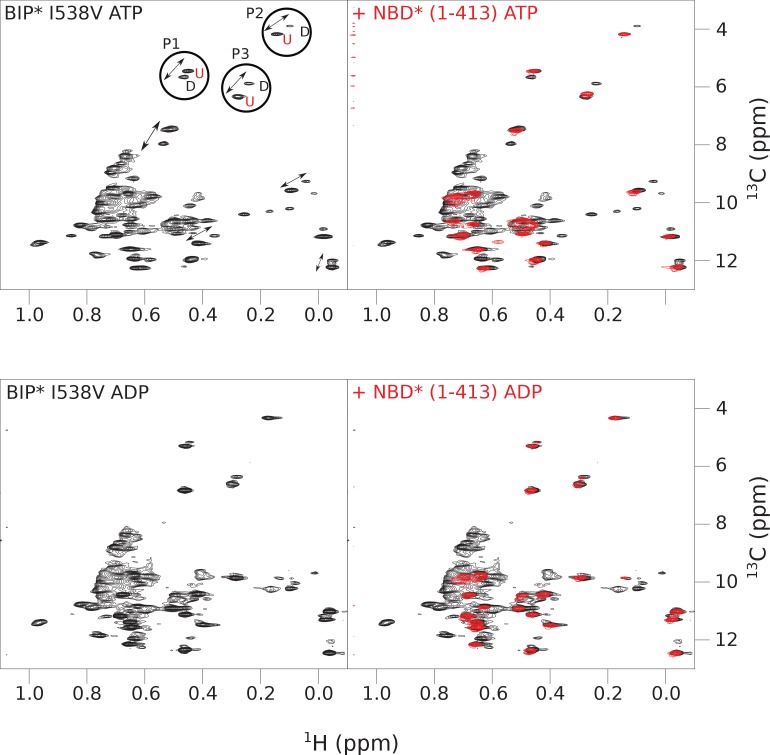
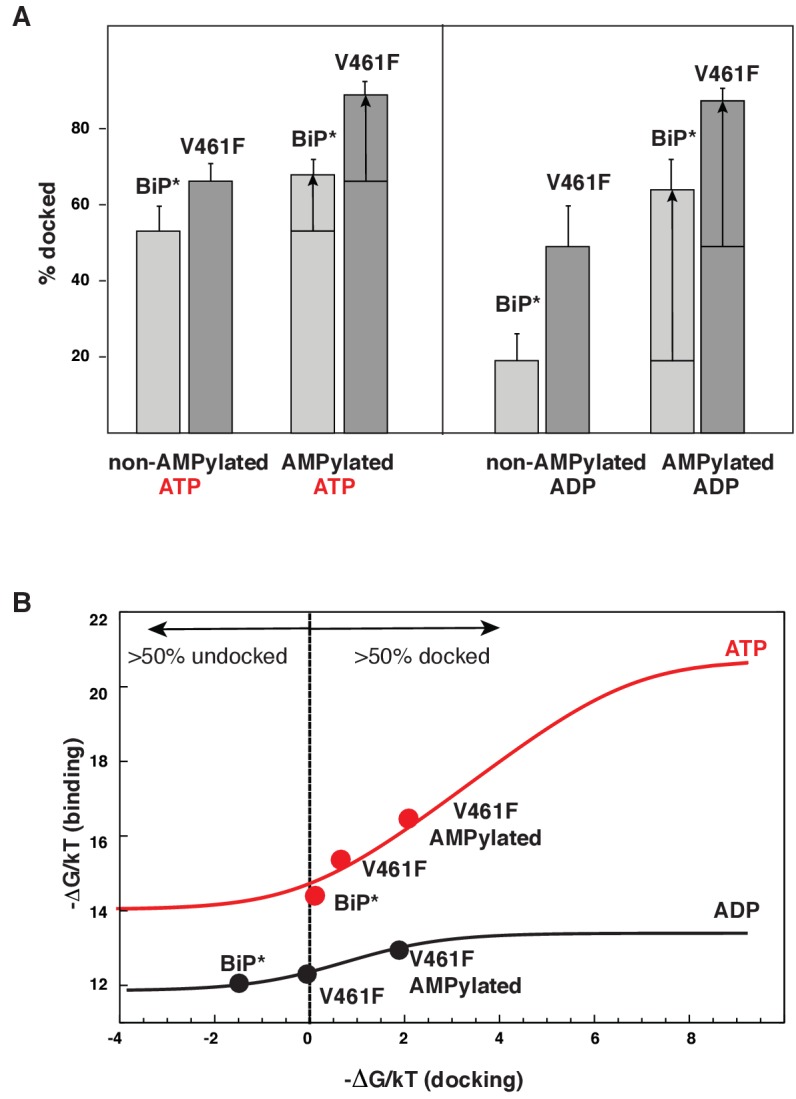
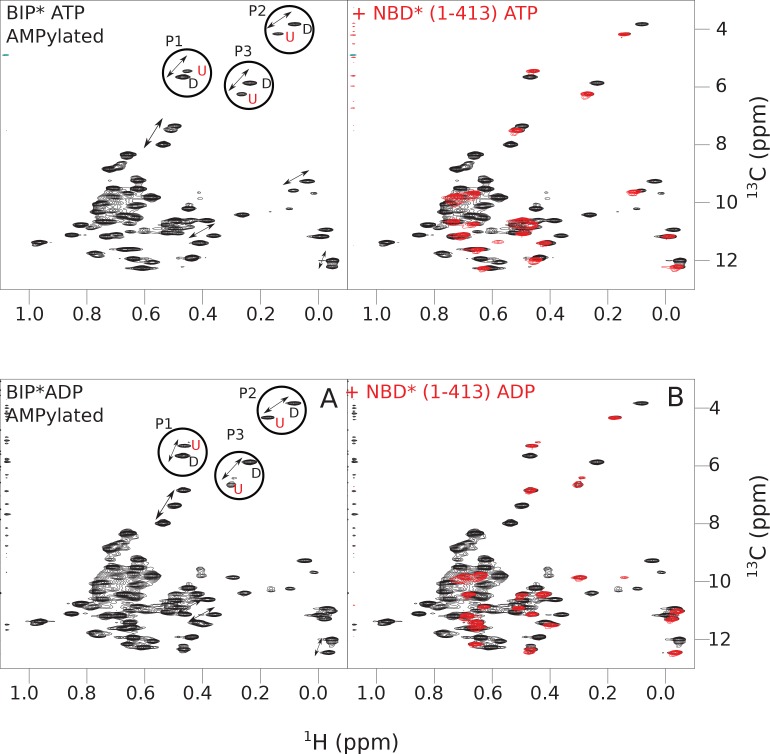
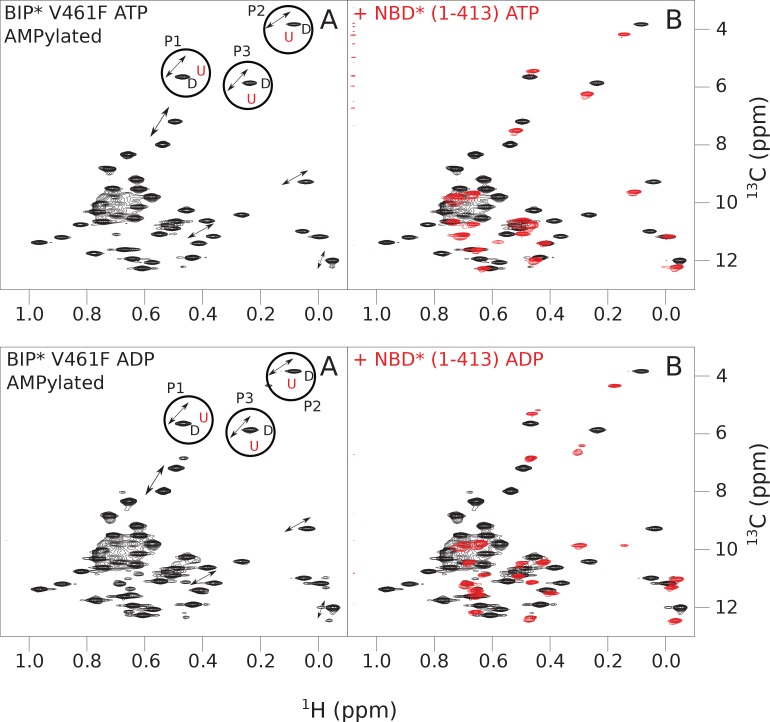
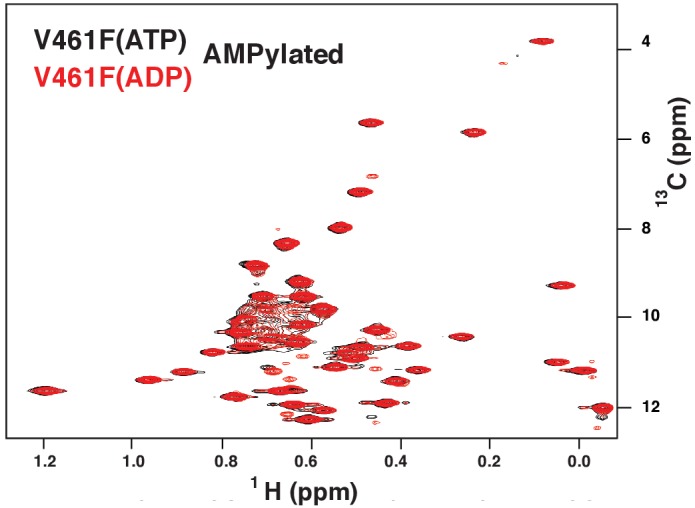
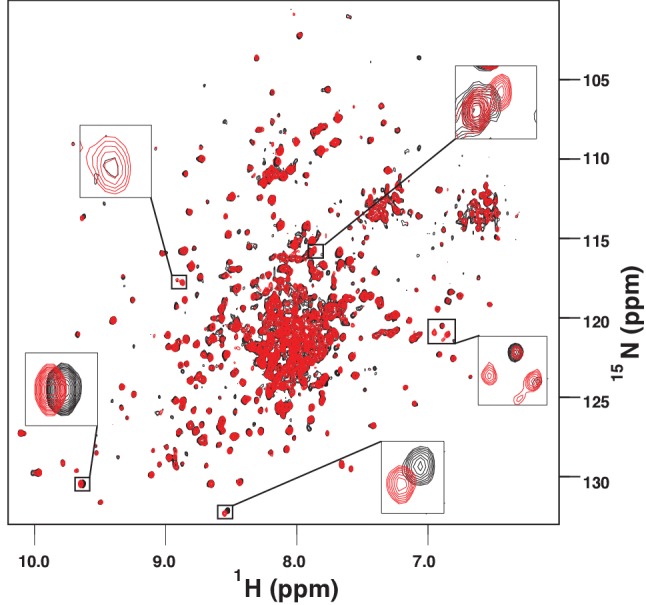
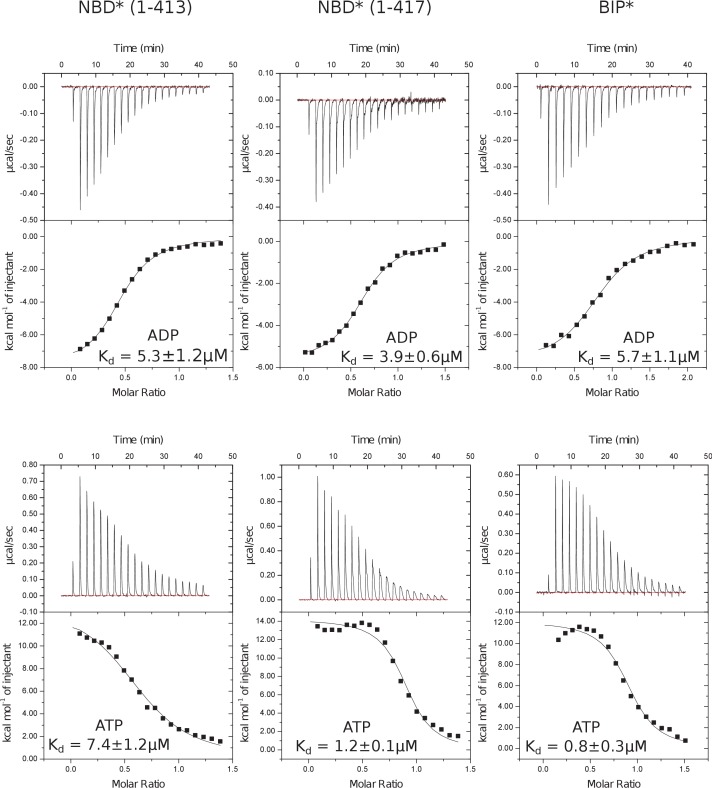
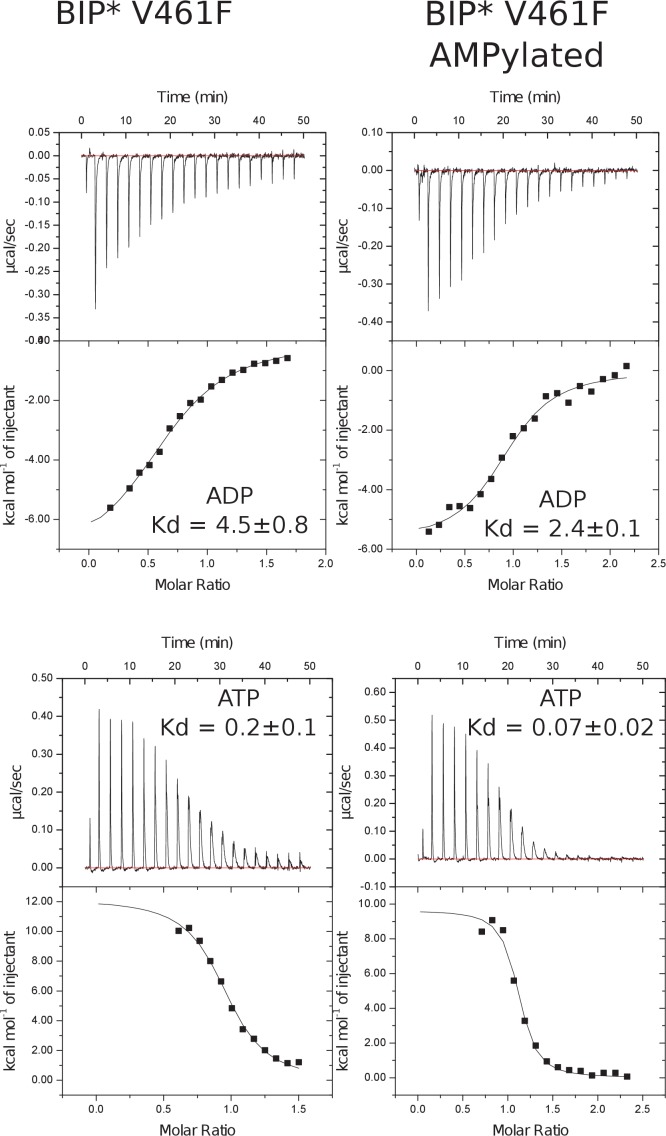
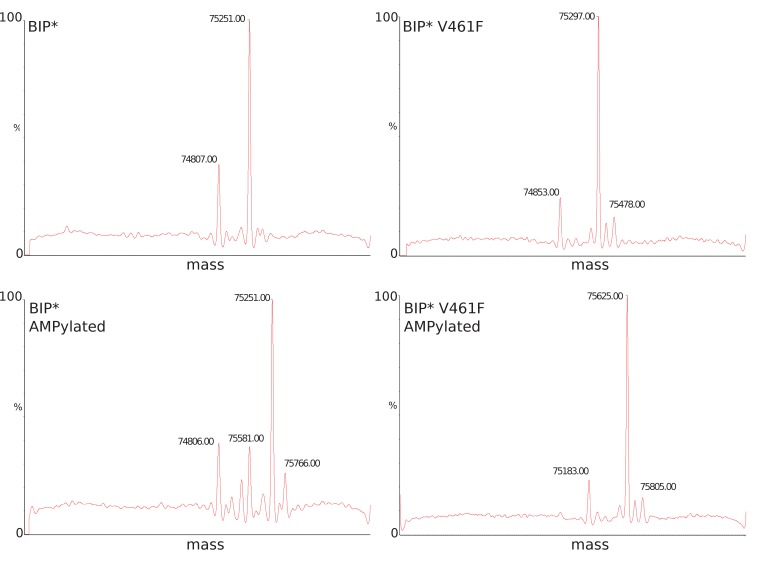
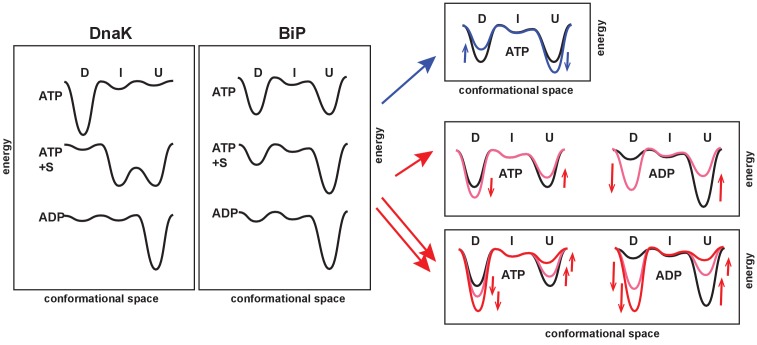
BiP is the only Hsp70 chaperone in the endoplasmic reticulum (ER) and similar to other Hsp70s, its activity relies on nucleotide- and substrate-controllable docking and undocking of its nucleotide-binding domain (NBD) and substrate-binding domain (SBD). However, little is known of specific features of the BiP conformational landscape that tune BiP to its unique tasks and the ER environment. We present methyl NMR analysis of the BiP chaperone cycle that reveals surprising conformational heterogeneity of ATP-bound BiP that distinguishes BiP from its bacterial homologue DnaK. This unusual poise enables gradual post-translational regulation of the BiP chaperone cycle and its chaperone activity by subtle local perturbations at SBD allosteric 'hotspots'. In particular, BiP inactivation by AMPylation of its SBD does not disturb Hsp70 inter-domain allostery and preserves BiP structure. Instead it relies on a redistribution of the BiP conformational ensemble and stabilization the domain-docked conformation in presence of ADP and ATP.

Keywords: AMPylation; E. coli; Hsp70; allostery; biophysics; domain docking; human; methyl NMR; structural biology.


Conflict of interest statement

No competing interests declared.

Figures

Figure 1.
Figure 1.. Two main functional conformations of BiP.
Ribbon representation of the structure of the ATP-bound BiP (PDB 5e84 [(Yang et al., 2015]), referred as the domain-docked conformation, and ADP-bound, which was modeled from the structures of the isolated NBD (PDB 5evz [Hughes et al., 2016]) and (D) SBD (PDB 5e85 [Yang et al., 2015]) and referred as the domain-undocked (U) conformation. The NBD (blue), βSBD (green), and αLid are highlighted by different colors and labeled.
Figure 1—figure supplement 1.
Figure 1—figure supplement 1.. Sequence alignment of eukaryotic and bacterial Hsp70 proteins.
The aligned sequences of the βSBD, including human HSP70s: BiP (GRP78 or HSPA5), HSP70 (HSPA1A or HSP72), HSPA2, HSC70 (HSPA8 or HSP73), HSPA9 (GRP75, Mortalin-2 or MTHSP70), and HSPA6; Hsp70s from eukaryotes: Stratiomys singularior (UniProt: B2CKI9), Plasmodiophora brassicae (UniProt: A0A0G4IKJ2) and Monodelphis domestica (UniProt: F6VP59); and bacterial Hsp70s: HscA and DnaK from Escherichia coli. Secondary structure elements are indicated above the protein sequence. The highly conserved residues are coloured in red, less conserved in orange, non-conserved in black. The positions of ‘soft mutations’ used in this study are indicated by green asterisks; the AMPylation site (Thr 518) is highlighted by a magenta asterisk.
Figure 2.
Figure 2.. NMR fingerprints of two main functional conformations of BiP.
The isoleucine region of methyl-TROSY spectra of ADP-bound (left) and ATP-bound (right) BiP* (the full-length ATPase deficient T229G BiP construct, in black) overlaid with the spectra of corresponding nucleotide-bound state of isolated NBD* (the ATPase deficient NBD construct without the interdomain linker, residues 1–413, in red) and isolated SBD (in green). (Grey box, right) Blowup of the representative region of methyl-TROSY spectra of ATP-bound BiP*, showing three non-overlapping peak doublets, used to calculate the populations domain-docked (D) and -undocked (U) conformations. The U/D assignments details can be found in Materials and methods; briefly, FL BiP* peaks (black) that overlapping with peaks from the NBD*(1-413) spectrum (blue), were assigned to the domain-undocked conformation (labeled ‘U’; that is, for the corresponding conformation the isoleucine chemical environment is very similar in the FL protein and isolated NBD); the second peak from each doublet was assigned to the domain-docked conformation (labeled ‘D’, that is, for the corresponding conformation the isoleucine chemical environment in the FL protein is significantly different from the chemical environment in the isolated NBD).
Figure 2—figure supplement 1.
Figure 2—figure supplement 1.. NMR fingerprints of the main steps of the BiP allosteric cycle.
The isoleucine region of methyl-TROSY spectra of BiP* (the full-length ATPase deficient T229G BiP construct, in black) overlaid with the spectra of corresponding nucleotide-bound state of NBD* (the ATPase deficient NBD construct without the interdomain linker, residues 1–413, in blue), including ADP-bound, ADP- and P2 (a model substrate peptide HTFPAVL [Marcinowski et al., 2011b])-bound, ATP-bound and ATP- and P2-bound.
Figure 3.
Figure 3.. ATP-induced linker binding to the BiP NBD.
(A) Ribbon representation of the structures of two BiP NBD conformations: linker-bound and linker-unbound. The ATP-bound NBD structure (grey, linker bound; the linker is shown in yellow) is taken from the domain-docked structure of FL BiP (PDB 5e84 [Yang et al., 2015]); the ADP-bound structure (pink) is taken from the ADP-bound isolated BiP NBD (residues 1–407) PDB 5evz (Hughes et al., 2016); for ADP-bound conformation the linker region (after residue 407) is schematically shown in pink. (B) Blowup of the representative region of amide TROSY of the ADP-bound (black) and ATP-bound (red) NBD*(1-417) showing the peak corresponding the C-terminal linker residue Leu417. (C) The isoleucine region of the methyl-TROSY spectra of the ADP- and ATP-bound BiP NBD*(1-417) (in black) overlaid with the spectra of the corresponding nucleotide-bound state of BiP NBD*(1-413) (in red). Asterisks highlight changes observed in the presence of the linker.
Figure 4.
Figure 4.. Allosteric regulation of the BiP conformational ensemble.
(A) Ribbon representation of the domain-docked conformations (PDB 5e84 [Yang et al., 2015]). Four ‘soft’ mutations are shown as red spheres. The AMPylation site (Thr 518) is shown in green. (B) Populations of the domain-docked conformation calculated from methyl-TROSY spectra of ATP-bound BiP* ‘soft’ mutants, V461F, I526V, I437V and I538V, using methyl peak intensities of the domain-docked and -undocked conformations. Error bars show SDs from the means for three peak doublets (Materials and methods, Figure 4—figure supplements 1–5 and Figure 4—source data 1). (C) Blowup of the representative region of the methyl-TROSY spectrum of ADP-bound BiP*-V461F (black) overlaid (left) with the spectrum of ADP-bound NBD*(1-413) (red). (Right) For each FL BiP* doublet, the peak overlapping with the ADP-bound NBD* peak is labeled as U* (ADP-bound, domain-undocked) and the second peak is labeled as D (ADP-bound, domain-docked).
Figure 4—figure supplement 1.
Figure 4—figure supplement 1.. The isoleucine regions of methyl-TROSY spectra of ATP- and ADP-bound full-length (FL) BiP* (A, in black), overlaid with the spectra of a corresponding nucleotide-bound state of NBD*(1-413) (B, in red).
Peaks in the spectra of FL BiP* were assigned to the domain-undocked (U) conformation when they were overlapped with peaks in the spectrum of the isolated NBD*(1-413) in the corresponding nucleotide state (ADP or ATP-bound). When two sets of peaks were observed in the NMR methyl spectra of ATP-bound FL BiP*, the second peak with distinct chemical shifts from those observed for the isolated NBD*(1-413), was assigned to the domain-docked conformation (D). The three representative peak doublets used to calculate the population of the domain-docked conformation (Figure 4—source data 1) were labeled as P1 (an unassigned NBD Ile peak), P2 (Ile145) and P3 (Ile371).
Figure 4—figure supplement 2.
Figure 4—figure supplement 2.. The isoleucine regions of methyl-TROSY spectra of ATP- and ADP-bound states of the V461F variant of full-length (FL) BiP* (A, in black), overlaid with the spectra of a corresponding nucleotide-bound state of NBD*(1-413) (B, in red).
Peaks in the spectra of the FL protein were assigned to the domain-undocked (U) conformation when they were overlapped with peaks in the spectrum of the isolated NBD*(1-413) in the corresponding nucleotide state (ADP or ATP-bound). When two sets of peaks were observed in the NMR methyl spectra of the FL protein, the second peak with distinct chemical shifts from those observed for the isolated NBD*(1-413), was assigned to the domain-docked conformation (D). The three representative peak doublets used to calculate the population of the domain-docked conformation (Figure 4—source data 1) were labeled as P1 (an unassigned NBD Ile peak), P2 (Ile145) and P3 (Ile371).
Figure 4—figure supplement 3.
Figure 4—figure supplement 3.. The isoleucine regions of methyl-TROSY spectra of ATP- and ADP-bound states of the I437V variant of full-length (FL) BiP* (A, in black), overlaid with the spectra of a corresponding nucleotide-bound state of NBD*(1-413) (B, in red).
Peaks in the spectra of the FL protein were assigned to the domain-undocked (U) conformation when they were overlapped with peaks in the spectrum of the isolated NBD*(1-413) in the corresponding nucleotide state (ADP or ATP-bound). When two sets of peaks were observed in the NMR methyl spectra of the FL protein, the second peak with distinct chemical shifts from those observed for the isolated NBD*(1-413), was assigned to the domain-docked conformation (D). The three representative peak doublets used to calculate the population of the domain-docked conformation (Figure 4—source data 1) were labeled as P1 (an unassigned NBD Ile peak), P2 (Ile145) and P3 (Ile371).
Figure 4—figure supplement 4.
Figure 4—figure supplement 4.. The isoleucine regions of methyl-TROSY spectra of ATP- and ADP-bound states of the I526V variant of full-length (FL) BiP* (A, in black), overlaid with the spectra of a corresponding nucleotide-bound state of NBD*(1-413) (B, in red).
Peaks in the spectra of the FL protein were assigned to the domain-undocked (U) conformation when they were overlapped with peaks in the spectrum of the isolated NBD*(1-413) in the corresponding nucleotide state (ADP or ATP-bound). When two sets of peaks were observed in the NMR methyl spectra of the FL protein, the second peak with distinct chemical shifts from those observed for the isolated NBD*(1-413), was assigned to the domain-docked conformation (D). The three representative peak doublets used to calculate the population of the domain-docked conformation (Figure 4—source data 1) were labeled as P1 (an unassigned NBD Ile peak), P2 (Ile145) and P3 (Ile371).
Figure 4—figure supplement 5.
Figure 4—figure supplement 5.. The isoleucine regions of methyl-TROSY spectra of ATP- and ADP-bound states of the I538V variant of full-length (FL) BiP* (A, in black), overlaid with the spectra of a corresponding nucleotide-bound state of NBD*(1-413) (B, in red).
Peaks in the spectra of the FL protein were assigned to the domain-undocked (U) conformation when they were overlapped with peaks in the spectrum of the isolated NBD*(1-413) in the corresponding nucleotide state (ADP or ATP-bound). When two sets of peaks were observed in the NMR methyl spectra of the FL protein, the second peak with distinct chemical shifts from those observed for the isolated NBD*(1-413), was assigned to the domain-docked conformation (D). The three representative peak doublets used to calculate the population of the domain-docked conformation (Figure 4—source data 1) were labeled as P1 (an unassigned NBD Ile peak), P2 (Ile145) and P3 (Ile371).
Figure 5.
Figure 5.. Allosteric regulation of the BiP by AMPylation.
(A) Populations of the domain-docked conformation for AMPylated and non-AMPylated BiP* and its V461F variant in the presence of ATP and ADP, calculated using methyl peak intensities of the domain-docked and -undocked conformations. Error bars show SDs from the means for three peak doublets (Materials and methods, Figure 5—figure supplements 1–2 and Figure 5—source data 1). (B) The thermodynamic linkage between domain docking and nucleotide binding: Plot of the experimental free energy of ATP (red dots) and ADP (black dots) binding against the experimental free energy of domain docking for BiP* and its non-AMPylated and AMPylated V461F variant. For each construct, the free energy of nucleotide binding was obtained from the ITC data and the free energy of domain docking was calculated from NMR peak intensities (see Figure 5—source data 2 and Materials and methods for details). The red (for ATP) and black (for ADP) curves show the theoretical plots of the free energy of ATP (red) and ADP (black) binding against the free energy of domain docking under assumption that BiP co-exists as an ensemble of the domain-undocked and -docked conformations (see Materials and methods).
Figure 5—figure supplement 1.
Figure 5—figure supplement 1.. The isoleucine regions of methyl-TROSY spectra of ATP- and ADP-bound states of AMPylated full-length (FL) BiP* (A, in black), overlaid with the spectra of a corresponding nucleotide-bound state of NBD*(1-413) (B, in red).
Peaks in the spectra of the FL protein were assigned to the domain-undocked (U) conformation when they were overlapped with peaks in the spectrum of the isolated NBD*(1-413) in the corresponding nucleotide state (ADP or ATP-bound). When two sets of peaks were observed in the NMR methyl spectra of the FL protein, the second peak with distinct chemical shifts from those observed for the isolated NBD*(1-413), was assigned to the domain-docked conformation (D). The three representative peak doublets used to calculate the population of the domain-docked conformation (Figure 5—source data 1) were labeled as P1 (an unassigned NBD Ile peak), P2 (Ile145) and P3 (Ile371).
Figure 5—figure supplement 2.
Figure 5—figure supplement 2.. The isoleucine regions of methyl-TROSY spectra of ATP- and ADP-bound states of AMPylated full-length (FL) V461F BiP* (A, in black), overlaid with the spectra of a corresponding nucleotide-bound state of NBD*(1-413) (B, in red).
Peaks in the spectra of the FL protein were assigned to the domain-undocked (U) conformation when they were overlapped with peaks in the spectrum of the isolated NBD*(1-413) in the corresponding nucleotide state (ADP or ATP-bound). When two sets of peaks were observed in the NMR methyl spectra of the FL protein, the second peak with distinct chemical shifts from those observed for the isolated NBD*(1-413), was assigned to the domain-docked conformation (D). The three representative peak doublets used to calculate the population of the domain-docked conformation (Figure 5—source data 1) were labeled as P1 (an unassigned NBD Ile peak), P2 (Ile145) and P3 (Ile371).
Figure 5—figure supplement 3.
Figure 5—figure supplement 3.. The methyl TROSY spectrum of ATP-bound AMPylated BiP*-V461F (black) overlaid with the spectrum of ADP-bound AMPylated BiP*-V461F (red).
Figure 5—figure supplement 4.
Figure 5—figure supplement 4.. The amide TROSY spectrum of ATP-bound AMPylated BiP*-V461F (black) overlaid with the spectrum of ADP-bound AMPylated BiP*-V461F (red).
Blowups of the representative regions of the TROSY spectra highlighting local chemical shift perturbations between ADP- and ATP-bound states.
Figure 5—figure supplement 5.
Figure 5—figure supplement 5.. Representative panels showing nucleotide (ATP or ADP) binding to BiP* and isolated NBD*(1-413) and NBD*(1-417) measured by ITC.
Experiments were performed at 25°C using 20–80 μM protein in the cell and 0.1–0.4 mM ADP (or ATP) injected from the syringe. The top panels show raw data and the bottom panels show integrated normalized data.
Figure 5—figure supplement 6.
Figure 5—figure supplement 6.. Representative panels showing nucleotide (ATP or ADP) binding to non-AMPylated and AMPylated V461F BiP* measured by ITC.
Experiments were performed at 25°C using 30 μM protein in the cell and 0.25–0.35 mM ADP (or ATP) injected from the syringe. Top panels show raw data, and bottom panels show integrated normalized data.
Figure 5—figure supplement 7.
Figure 5—figure supplement 7.. LC-MS data for molecular mass determination of unmodified (panels A-B) and AMPylated (panels C-D) BiP.
Molecular mass difference of ~330 Da as reported before (Preissler et al., 2015) corresponds to modification by AMPlation. An additional peak at ±180 Da corresponds to α-N-Glucosylation of the His-tag.
Figure 6.
Figure 6.. The unique features of the BiP conformational landscape and its posttranslational regulation: Schematic illustration of three key ligand-bound states (ATP-, ATP- and substrate-, and ADP-bound) of DnaK and BiP. For both chaperones the conformational landscapes comprises three structurally and functionally distinct conformations: domain-docked (D), intermediate domain-undocked linker-bound (I), and domain-undocked linker-unbound (U).
Blue and red arrows illustrate how local perturbations of the SBD affect the BiP conformational landscape: the I437V and I538V substitutions favor domain undocking (blue arrows, Figure 4), while the V461F and I526V substitutions (Figure 4) as well as AMPylation of Thr518 (Figure 5) stabilize the domain-docked conformation in the presence of ATP and ADP. The additive effect, for example, upon the V461F substitution and AMPylation, is also shown (double red arrows).

References

    1. Ahmad A, Bhattacharya A, McDonald RA, Cordes M, Ellington B, Bertelsen EB, Zuiderweg ER. Heat shock protein 70 kDa chaperone/DnaJ cochaperone complex employs an unusual dynamic interface. PNAS. 2011;108:18966–18971. doi: 10.1073/pnas.1111220108. - DOI - PMC - PubMed
    1. Araki K, Nagata K. Protein folding and quality control in the ER. Cold Spring Harbor Perspectives in Biology. 2011;3:a007526. doi: 10.1101/cshperspect.a007526. - DOI - PMC - PubMed
    1. Behnke J, Feige MJ, Hendershot LM. BiP and its nucleotide exchange factors Grp170 and Sil1: mechanisms of action and biological functions. Journal of Molecular Biology. 2015;427:1589–1608. doi: 10.1016/j.jmb.2015.02.011. - DOI - PMC - PubMed
    1. Bertelsen EB, Chang L, Gestwicki JE, Zuiderweg ER. Solution conformation of wild-type E. coli Hsp70 (DnaK) chaperone complexed with ADP and substrate. PNAS. 2009b;106:8471–8476. doi: 10.1073/pnas.0903503106. - DOI - PMC - PubMed
    1. Bertelsen EB, Chang L, Gestwicki JE, Zuiderweg ERP. Solution conformation of wild-type E. coli Hsp70 (DnaK) chaperone complexed with ADP and substrate. PNAS. 2009a;106:8471–8476. doi: 10.1073/pnas.0903503106. - DOI - PMC - PubMed

Substances