. 2018 Mar;32(3):736-743.
doi: 10.1038/leu.2017.287. Epub 2017 Sep 28.

JAM-A as a prognostic factor and new therapeutic target in multiple myeloma

Affiliations

JAM-A as a prognostic factor and new therapeutic target in multiple myeloma

A G Solimando et al. Leukemia. 2018 Mar.

Abstract

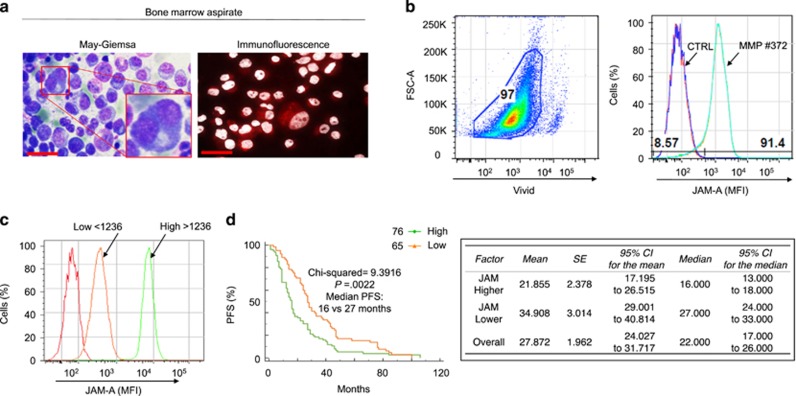
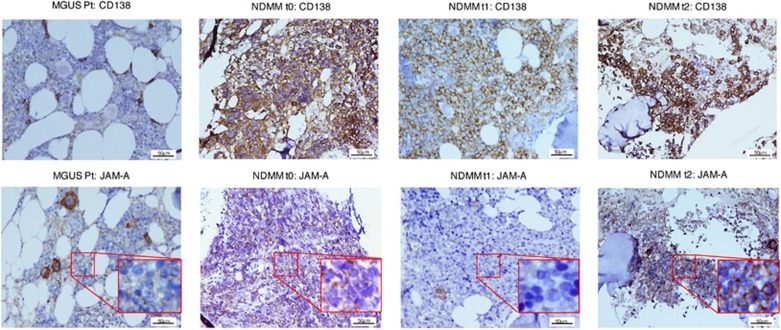
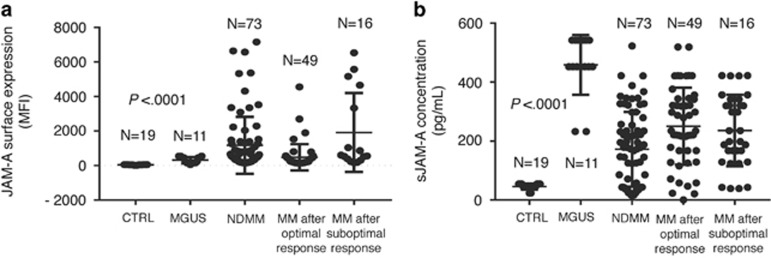
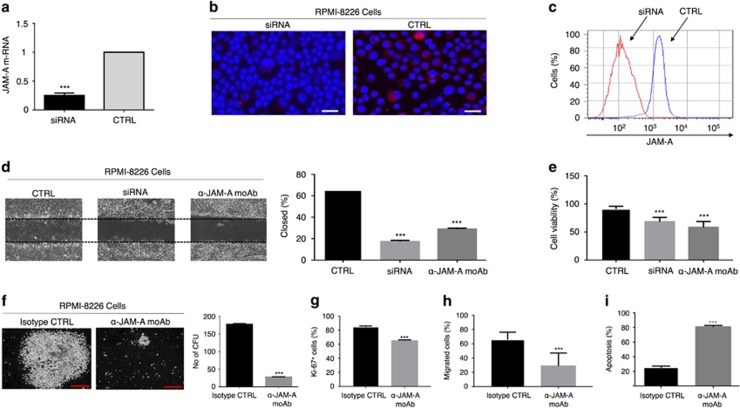
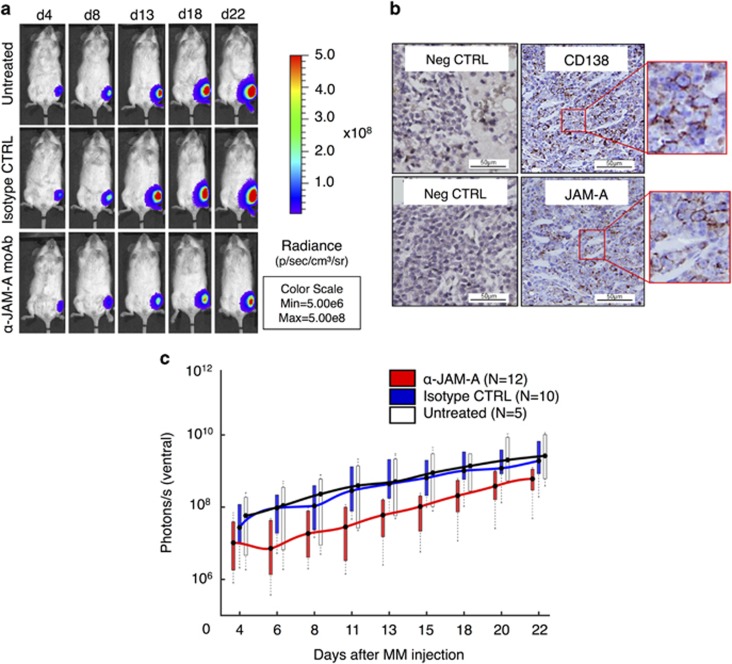
Cell adhesion in the multiple myeloma (MM) microenvironment has been recognized as a major mechanism of MM cell survival and the development of drug resistance. Here we addressed the hypothesis that the protein junctional adhesion molecule-A (JAM-A) may represent a novel target and a clinical biomarker in MM. We evaluated JAM-A expression in MM cell lines and in 147 MM patient bone marrow aspirates and biopsies at different disease stages. Elevated JAM-A levels in patient-derived plasma cells were correlated with poor prognosis. Moreover, circulating soluble JAM-A (sJAM-A) levels were significantly increased in MM patients as compared with controls. Notably, in vitro JAM-A inhibition impaired MM migration, colony formation, chemotaxis, proliferation and viability. In vivo treatment with an anti-JAM-A monoclonal antibody (αJAM-A moAb) impaired tumor progression in a murine xenograft MM model. These results demonstrate that therapeutic targeting of JAM-A has the potential to prevent MM progression, and lead us to propose JAM-A as a biomarker in MM, and sJAM-A as a serum-based marker for clinical stratification.


Conflict of interest statement

The authors declare no conflict of interest.

Figures

Figure 1
Figure 1
JAM-A is overexpressed in MM patient-derived primary plasma cells. (a) MM primary plasma cells (MM-PCs): May–Giemsa and immunofluorescence staining of JAM-A expression from a representative patient. Scale bar, 10 μm. (b) FACS analysis of cell JAM-A surface expression from representative patient-derived, immunoselected MM-PCs, gated on live cells, identified as CD138+ cells. Red and dark blue curves indicate isotype staining and unstained controls. (c) Representative patients with low versus high JAM-A level (FACS). (d) Patients with low expression had a better PFS than patients with high JAM-A expression (log-rank test—left panel). Detailed information for PFS of patients with JAM-A surface expression (right panel). For 5 out of 147 patients JAM-A surface expression was unobtainable and for 1 patient complete information regarding date of disease progression and death was not available.
Figure 2
Figure 2
JAM-A is overexpressed in bone marrow biopsies of MM patients. JAM-A immunohistochemical staining of BM trephines from a single representative MM patient (at t0, t1 and t2) compared with MGUS control. Depending on the disease stage, different JAM-A expression patterns become overt: weak JAM-A staining in MGUS samples, JAM-A expression detectable at the time of recruitment in NDMM, weak after therapy but even stronger at disease relapse. MGUS Pt=MGUS-patient, NDMM=newly diagnosed MM patient. t0=at the time of recruitment; t1=after treatment; t2=at disease relapse. Original magnification × 200, scale bar, 50 μm.
Figure 3
Figure 3
JAM-A overexpression correlates with aggressive disease. (a) t0: differences in the expression of JAM-A between MM-PCs from NDMM, MM patients after optimal or suboptimal response and PCs obtained from healthy adults and MGUS patients determined by FACS (Kruskal–Wallis test). (b) t0: differences in the serum sJAM-A concentration between NDMM, MM patients after optimal or suboptimal response and serum obtained from healthy adults and MGUS patients. Determined by ELISA (Kruskal–Wallis test). t0=at time of recruitment.
Figure 4
Figure 4
JAM-A inhibition impairs key tumorigenic functions of MM cells in vitro. (a) The relative quantity of JAM-A mRNA normalized to GAPDH in the siRNA-transfected group was 75% lower compared with the negative controls (Student’s t-test). (b) Immunofluorescence analysis of the JAM-A signal in RPMI-8226 cells after siRNA treatment. Scale bar, 20 μm. (c) FACS analysis of JAM-A surface expression depletion efficiency. (d) Scratch assay. siRNA- and αJAM-A moAb treatment reduced the capacity of MM cell migration (one-way analysis of variance (ANOVA)). (e) Cell survival function assessed by trypan blue exclusion assay. JAM-A impairs cell viability (Kruskal–Wallis test). (f) Colony-forming unit assay. αJAM-A moAb treatment reduced the ability of cell colony formation when compared with treatment with an isotype control. Scale bar, 100 μm (Student’s t-test). Data are presented as mean±s.d. of triplicate cultures (g) Ki-67 proliferation assay. αJAM-A moAb treatment reduces cell proliferation in treated cells compared with treatment with an isotype control (one-way ANOVA). (h) Chemotaxis assay. αJAM-A moAb treatment reduces the chemotaxis ability of the cells compared with treatment with an isotype control (Kruskal–Wallis test). (i) Effect of JAM-A on cell death evaluated with Annexin (Student’s t-test). ***P<0.0001.
Figure 5
Figure 5
In vivo MM progression is inhibited by αJAM-A moAb treatment. (a) Blocking JAM-A impairs proliferation of luc+ RMPI-8226 cells in vivo. In vivo BLI imaging from RPMI-8226 tumor-bearing mice. Images show ventral views of one representative mouse from each group. (b) Histologic analysis reveals CD138/JAM-A double-positive cells (right panels and magnified boxes) within the BM localized as small clusters and comprising ~70% of cellular elements in total, as analyzed by two independent pathologists. Control staining with monoclonal isotype antibody (Neg. CTRL, left panels). Scale bar, 50 μm. (c) Absolute light-emission (photons/s/animal) during the treatment period. BLI signals markedly increased in control animals (isotype and untreated). αJAM-A moAb treatment impaired disease progression, with the first significant differences appearing on day 8 after MM cell injection (one-way ANOVA; P=0.014) and dorsal (iso-CTRL versus αJAM-A P<0.0001) images.

References

    1. Cavo M, Rajkumar SV, Palumbo A, Moreau P, Orlowski R, Bladé J et al. International Myeloma Working Group consensus approach to the treatment of multiple myeloma patients who are candidates for autologous stem cell transplantation. Blood 2011; 117: 6063–6073. - PMC - PubMed
    1. Mikhael JR, Dingli D, Roy V, Reeder CB, Buadi FK, Hayman SR et al. Management of newly diagnosed symptomatic multiple myeloma: updated Mayo Stratification of Myeloma and Risk-Adapted Therapy (mSMART) consensus guidelines 2013. Mayo Clin Proc 2013; 88: 360–376. - PubMed
    1. Fairfield H, Falank C, Avery L, Reagan MR. Multiple myeloma in the marrow: pathogenesis and treatments. Ann N Y Acad Sci 2016; 1364: 32–51. - PMC - PubMed
    1. Damiano JS, Cress AE, Hazlehurst LA, Shtil AA, Dalton WS. Cell adhesion mediated drug resistance (CAM-DR): role of integrins and resistance to apoptosis in human myeloma cell lines. Blood 1999; 93: 1658–1667. - PMC - PubMed
    1. Mutlu P, Ural AU, Gunduz U. Differential gene expression analysis related to extracellular matrix components in drug-resistant RPMI-8226 cell line. Biomed Pharmacother Biomed Pharmacother 2012; 66: 228–231. - PubMed

Publication types

MeSH terms

Substances