

Global genotype flow in Cercospora beticola populations confirmed through genotyping-by-sequencing
- PMID: 29065114
- PMCID: PMC5655429
- DOI: 10.1371/journal.pone.0186488
Global genotype flow in Cercospora beticola populations confirmed through genotyping-by-sequencing
Abstract
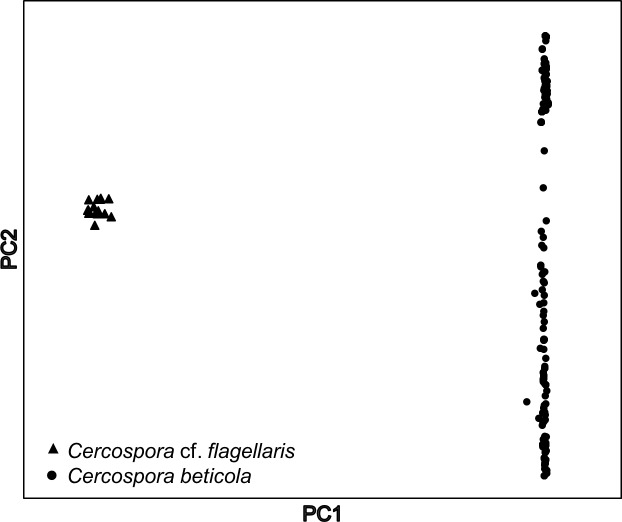
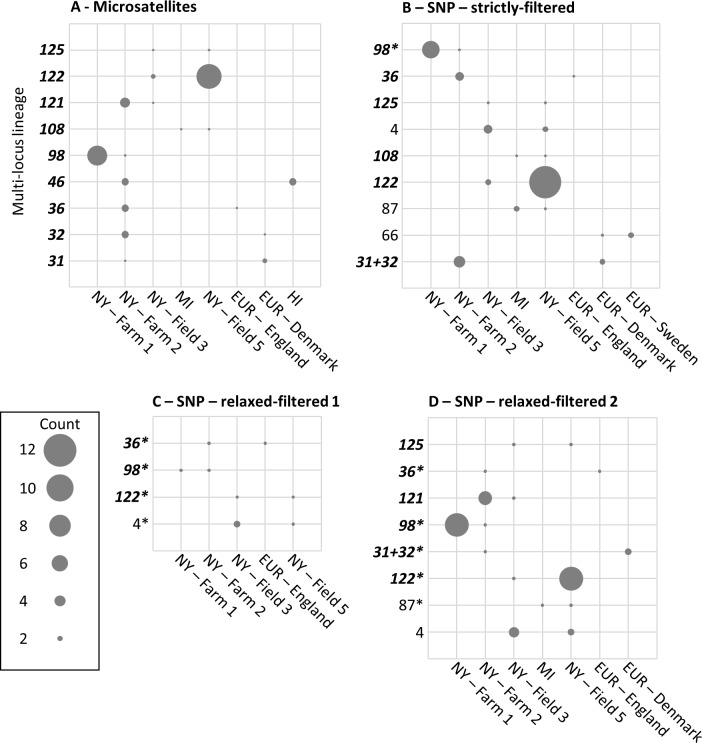
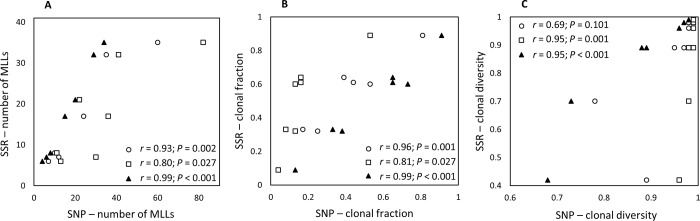
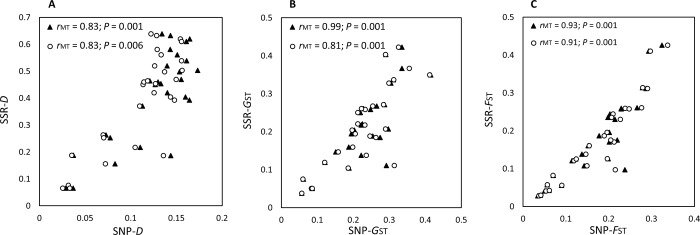
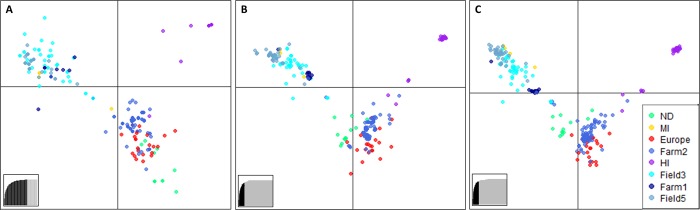
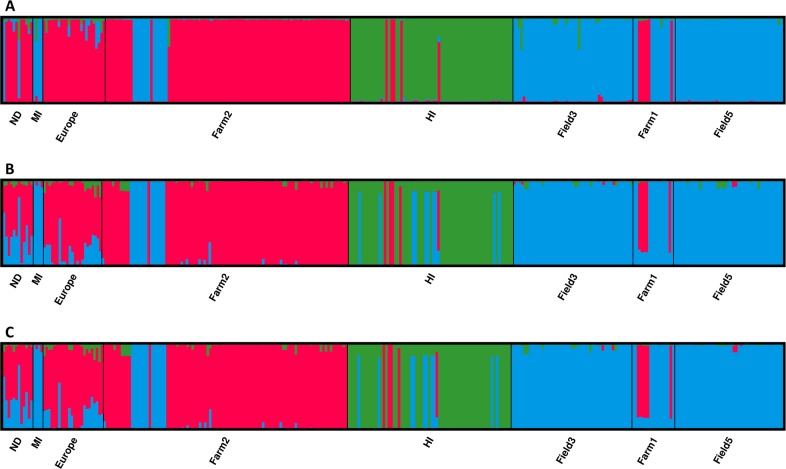
Genotyping-by-sequencing (GBS) was conducted on 333 Cercospora isolates collected from Beta vulgaris (sugar beet, table beet and swiss chard) in the USA and Europe. Cercospora beticola was confirmed as the species predominantly isolated from leaves with Cercospora leaf spot (CLS) symptoms. However, C. cf. flagellaris also was detected at a frequency of 3% in two table beet fields in New York. Resolution of the spatial structure and identification of clonal lineages in C. beticola populations using genome-wide single nucleotide polymorphisms (SNPs) obtained from GBS was compared to genotyping using microsatellites. Varying distance thresholds (bitwise distance = 0, 1.854599 × 10⁻⁴, and 1.298 × 10⁻³) were used for delineation of clonal lineages in C. beticola populations. Results supported previous reports of long distance dispersal of C. beticola through genotype flow. The GBS-SNP data set provided higher resolution in discriminating clonal lineages; however, genotype identification was impacted by filtering parameters and the distance threshold at which the multi-locus genotypes (MLGs) were contracted to multi-locus lineages. The type of marker or different filtering strategies did not impact estimates of population differentiation and structure. Results emphasize the importance of robust filtering strategies and designation of distance thresholds for delineating clonal lineages in population genomics analyses that depend on individual assignment and identification of clonal lineages. Detection of recurrent clonal lineages shared between the USA and Europe, even in the relaxed-filtered SNP data set and with a conservative distance threshold for contraction of MLGs, provided strong evidence for global genotype flow in C. beticola populations. The implications of intercontinental migration in C. beticola populations for CLS management are discussed.
Conflict of interest statement
Figures
Similar articles
-
Cercospora leaf spot disease of sugar beet.Plant Signal Behav. 2023 Dec 31;18(1):2214765. doi: 10.1080/15592324.2023.2214765. Plant Signal Behav. 2023. PMID: 37209061 Free PMC article. Review.
-
Genetic structure of Cercospora beticola populations on Beta vulgaris in New York and Hawaii.Sci Rep. 2017 May 11;7(1):1726. doi: 10.1038/s41598-017-01929-4. Sci Rep. 2017. PMID: 28496148 Free PMC article.
-
Cryptic diversity, pathogenicity, and evolutionary species boundaries in Cercospora populations associated with Cercospora leaf spot of Beta vulgaris.Fungal Biol. 2018 Apr;122(4):264-282. doi: 10.1016/j.funbio.2018.01.008. Epub 2018 Feb 9. Fungal Biol. 2018. PMID: 29551200
-
Temporal Genetic Differentiation of Cercospora beticola Populations in New York Table Beet Fields.Plant Dis. 2018 Nov;102(11):2074-2082. doi: 10.1094/PDIS-01-18-0175-RE. Epub 2018 Aug 27. Plant Dis. 2018. PMID: 30156961
-
Seedborne Cercospora beticola Can Initiate Cercospora Leaf Spot from Sugar Beet (Beta vulgaris) Fruit Tissue.Phytopathology. 2022 May;112(5):1016-1028. doi: 10.1094/PHYTO-03-21-0113-R. Epub 2022 Apr 6. Phytopathology. 2022. PMID: 34844416
Cited by
-
IMA Genome-F 9: Draft genome sequence of Annulohypoxylon stygium, Aspergillus mulundensis, Berkeleyomyces basicola (syn. Thielaviopsis basicola), Ceratocystis smalleyi, two Cercospora beticola strains, Coleophoma cylindrospora, Fusarium fracticaudum, Phialophora cf. hyalina, and Morchella septimelata.IMA Fungus. 2018 Jun;9(1):199-223. doi: 10.5598/imafungus.2018.09.01.13. Epub 2018 Jun 11. IMA Fungus. 2018. PMID: 30018880 Free PMC article.
-
Cercospora leaf spot disease of sugar beet.Plant Signal Behav. 2023 Dec 31;18(1):2214765. doi: 10.1080/15592324.2023.2214765. Plant Signal Behav. 2023. PMID: 37209061 Free PMC article. Review.
-
Cercospora beticola: The intoxicating lifestyle of the leaf spot pathogen of sugar beet.Mol Plant Pathol. 2020 Aug;21(8):1020-1041. doi: 10.1111/mpp.12962. Mol Plant Pathol. 2020. PMID: 32681599 Free PMC article.
-
An in-field heat treatment to reduce Cercospora beticola survival in plant residue and improve Cercospora leaf spot management in sugarbeet.Front Plant Sci. 2023 May 9;14:1100595. doi: 10.3389/fpls.2023.1100595. eCollection 2023. Front Plant Sci. 2023. PMID: 37229110 Free PMC article.
-
Population-level whole-genome sequencing of Ascochyta rabiei identifies genomic loci associated with isolate aggressiveness.Microb Genom. 2024 Nov;10(11):001326. doi: 10.1099/mgen.0.001326. Microb Genom. 2024. PMID: 39576742 Free PMC article.
References
-
- McDonald BA. How can research on pathogen population biology suggest disease management strategies? The example of barley scald (Rhynchosporium commune). Plant Pathol. 2015; 64:1005–1013.
-
- Milgroom MG, Peever TL. Population biology of plant pathogens: the synthesis of plant disease epidemiology and population genetics. Plant Dis. 2003; 87:608–617. - PubMed
-
- Biasi A, Martin FN, Cacciola SO, di San Lio GM, Grünwald NJ, Schena L. Genetic analysis of Phytophthora nicotianae populations from different hosts using microsatellite markers. Phytopathology 2016; 106:1006–1014. doi: 10.1094/PHYTO-11-15-0299-R - DOI - PubMed
-
- Lehner MS, de Paula Júnior TJ, Del Ponte EM, Mizubuti ESG, Pethybridge SJ. Independently founded populations of Sclerotinia sclerotiorum from a tropical and a temperate region have similar genetic structure. PloS One 2017; 12:e0173915 doi: 10.1371/journal.pone.0173915 - DOI - PMC - PubMed
-
- Mascheretti S, Croucher PJP, Vettraino A, Prospero S, Garbelotto M. Reconstruction of the Sudden Oak Death epidemic in California through microsatellite analysis of the pathogen Phytophthora ramorum. Mol. Ecol. 2008; 17:2755–2768. doi: 10.1111/j.1365-294X.2008.03773.x - DOI - PubMed
MeSH terms
LinkOut - more resources
Full Text Sources
Other Literature Sources
