Clinical Trial
. 2017 Oct 24;12(10):e0186602.
doi: 10.1371/journal.pone.0186602. eCollection 2017.

Safety and vaccine-induced HIV-1 immune responses in healthy volunteers following a late MVA-B boost 4 years after the last immunization

Affiliations
Clinical Trial

Safety and vaccine-induced HIV-1 immune responses in healthy volunteers following a late MVA-B boost 4 years after the last immunization

Alberto C Guardo et al. PLoS One. .

Erratum in

Abstract

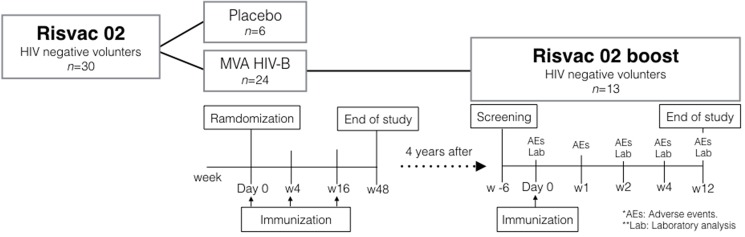
Background: We have previously shown that an HIV vaccine regimen including three doses of HIV-modified vaccinia virus Ankara vector expressing HIV-1 antigens from clade B (MVA-B) was safe and elicited moderate and durable (1 year) T-cell and antibody responses in 75% and 95% of HIV-negative volunteers (n = 24), respectively (RISVAC02 study). Here, we describe the long-term durability of vaccine-induced responses and the safety and immunogenicity of an additional MVA-B boost.

Methods: 13 volunteers from the RISVAC02 trial were recruited to receive a fourth dose of MVA-B 4 years after the last immunization. End-points were safety, cellular and humoral immune responses to HIV-1 and vector antigens assessed by ELISPOT, intracellular cytokine staining (ICS) and ELISA performed before and 2, 4 and 12 weeks after receiving the boost.

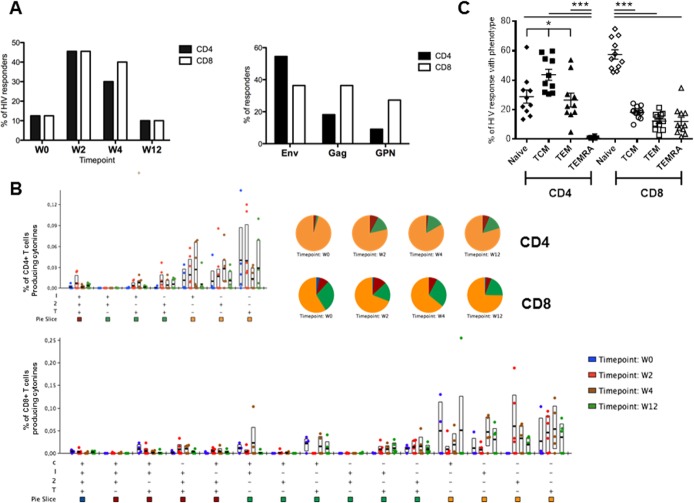
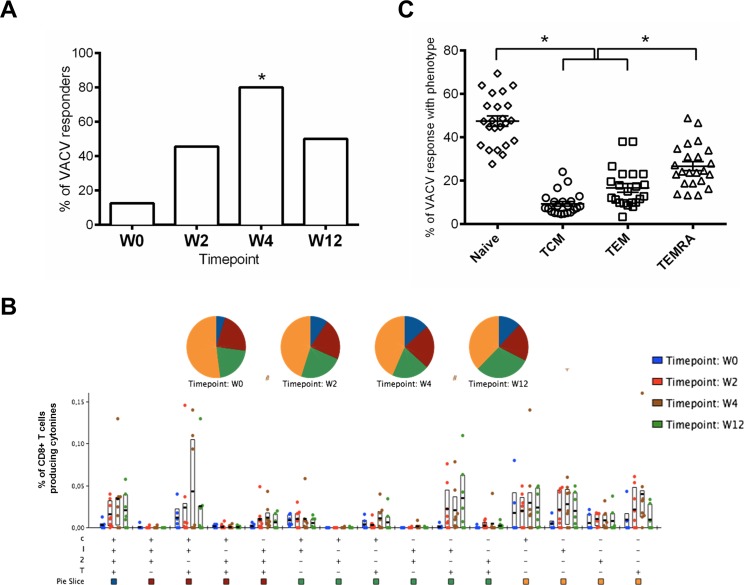
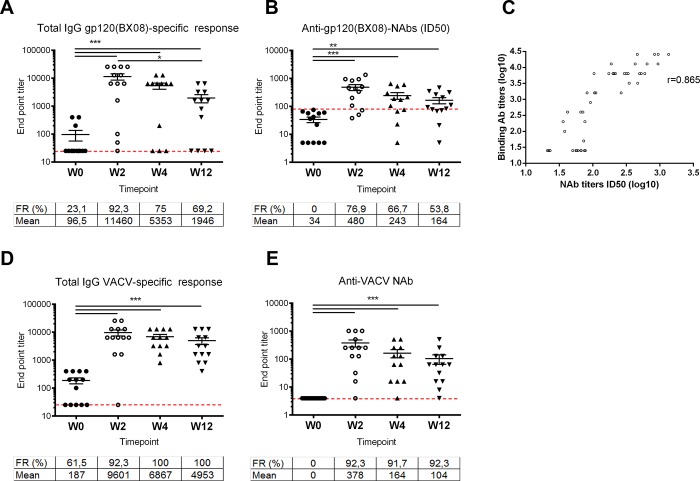
Results: Volunteers reported 64 adverse events (AEs), although none was a vaccine-related serious AE. After 4 years from the 1st dose of the vaccine, only 2 volunteers maintained low HIV-specific T-cell responses. After the late MVA-B boost, a modest increase in IFN-γ T-cell responses, mainly directed against Env, was detected by ELISPOT in 5/13 (38%) volunteers. ICS confirmed similar results with 45% of volunteers showing that CD4+ T-cell responses were mainly directed against Env, whereas CD8+ T cell-responses were similarly distributed against Env, Gag and GPN. In terms of antibody responses, 23.1% of the vaccinees had detectable Env-specific binding antibodies 4 years after the last MVA-B immunization with a mean titer of 96.5. The late MVA-B boost significantly improved both the response rate (92.3%) and the magnitude of the systemic binding antibodies to gp120 (mean titer of 11460). HIV-1 neutralizing antibodies were also enhanced and detected in 77% of volunteers. Moreover, MVA vector-specific T cell and antibody responses were boosted in 80% and 100% of volunteers respectively.

Conclusions: One boost of MVA-B four years after receiving 3 doses of the same vaccine was safe, induced moderate increases in HIV-specific T cell responses in 38% of volunteers but significantly boosted the binding and neutralizing antibody responses to HIV-1 and to the MVA vector.

Trial registration: ClinicalTrials.gov NCT01923610.


Conflict of interest statement

Competing Interests: The authors have declared that no competing interests exist.

Figures

Fig 1
Fig 1. Disposition of participants and study flow chart.
A total of 24 HIV-negative volunteers were vaccinated with MVA-B in the RISVAC02 study. Four years later, 13 of these volunteers were recruited to receive a single intramuscular boost of MVA-B vaccination in the RISVAC02boost clinical trial. Adverse Events (AEs), laboratory analyses and immunogenicity endpoints were tested as scheduled in the flow chart.
Fig 2
Fig 2. ELISPOT results.
Magnitude of HIV-1-specific T cell responses measured by IFN-γ-based ELISPOT is shown. A) Total responses, represented as the sum of positive responses to Gag, GPN and Env peptide pools; B) T-cell responses to Gag peptide pools; C) Positive responses to GPN peptide pools, and D) T-cell responses to Env peptide pools. The graphs show the frequency of HIV-1-specific T cell responses by SFC/106 PBMC at different time-points (-3, w0, w2, w4 and w12). Week -3 corresponds to w48 of follow-up of RISVAC02 clinical trial. Median and IQR are represented in all the graphs for the different time-points evaluated.
Fig 3
Fig 3. Frequency, function and phenotype of HIV-specific T cell responses.
A: Percentage of responders with positive ICS responses against Env+Gag+GPN at the different time points (left panel) and distribution of the CD4+ and CD8+ T cells by antigen (right panel). B: Functional profile of vaccine-induced T cells. The quality of the HIV-specific CD4 or CD8 T cell response is characterized by the proportion of cells making every possible combination of the measured cytokines: IFN-γ (I); IL-2 (2); TNF-α (T) and CD107a (C). Responses are grouped and colour coded on the basis of the number of functions. The bar charts show the mean values and interquartile ranges (IQR) and the pie charts show the average proportion of the HIV-specific CD4 or CD8 T cell responses according to the functions at weeks 0, 2, 4 and 12. “+”distributions that are different from the earliest time point (W0) within each category at p<0.05 (Student's T test). C: Phenotype of vaccine-induced T cells. The graphic represents the distribution of the responding HIV-specific CD4 and CD8 T cells at any time point based on CCR7 expression in combination with CD45RA within the Naïve (CD45RA+ CCR7+), T central memory (TCM: CD45RA- CCR7+), T effector memory (TEM: CD45RA- CCR7-) or terminally differentiated T effector memory (TEMRA: CD45RA+ CCR7-) phenotypes. Statistical differences were determined using ANOVA test (using the linear model y ~ x_patient + x_cellType + epsilon) followed by Tukey's honest significant difference criterion. *p<0.05, ***p<0.005.
Fig 4
Fig 4. Frequency, function and phenotype of VACV-specific CD8 T cell responses.
A: Percentage of responders with positive ICS responses against MVA infected cells at the different time points. The equality of proportion between groups was determined using the function prop.test. *p = 0.017. B: Functional profile of VACV-specific CD8 T cells. The quality of the VACV-specific CD8 T cell response is characterized by the proportion of cells making every possible combination of the measured cytokines: IFN-γ (I); IL-2 (2); TNF-α (T) and CD107a (C). Responses are grouped and colour coded on the basis of the number of functions. The bar charts show the mean values and interquartile ranges (IQR) and the pie charts show the average proportion of the VACV-specific CD8 T cell responses according to the functions at weeks 0, 2, 4 and 12. “+”distributions that are different from the earliest time point (W0) within each category at p<0.05 using Student's T test or “#” Wilcoxon signed rank test. C: Phenotype of VACV-specific CD8 T cells. The graphic represents the distribution of the VACV-specific CD8 T cells at any time point based on CCR7 expression in combination with CD45RA within the Naïve (CD45RA+ CCR7+), T central memory (TCM: CD45RA- CCR7+), T effector memory (TEM: CD45RA- CCR7-) or terminally differentiated T effector memory (TEMRA: CD45RA+ CCR7-) phenotypes. Statistical differences were determined using ANOVA test (using the linear model y ~ x_patient + x_cellType + epsilon) followed by Tukey's honest significant difference criterion. *p<0.05.
Fig 5
Fig 5. Humoral responses.
A: Total IgG binding antibody titers against HIV-1 gp120 (BX08). B: BX08 neutralization ID50 titers. C: Correlation between BX08 binding IgG and neutralizing ID50 titers. D: Total IgG binding titers against VACV proteins. E: VACV neutralization ID50 titers. The frequency of responders and the mean titers at the different time points are shown in each graph. Dashed line represents the threshold considered as positive response. Statistical differences were evaluated by one way ANOVA test (using the linear model log10(y) ~ x_patient + x_week + epsilon) followed by Tukey's honest significant difference criterion. *p<0.05, **p<0.01, *** p<0.005 (***4). Pearson’s correlation coefficient (r value) was calculated between BX08 binding IgG and neutralizing ID50 titers.

References

    1. Rerks-Ngarm S, Pitisuttithum P, Nitayaphan S, Kaewkungwal J, Chiu J, Paris R, et al. Vaccination with ALVAC and AIDSVAX to prevent HIV-1 infection in Thailand. N Engl J Med 2009; 361(23):2209–2220. doi: 10.1056/NEJMoa0908492 - DOI - PubMed
    1. Antoine G, Scheiflinger F, Dorner F, Falkner FG. The complete genomic sequence of the modified vaccinia Ankara strain: comparison with other orthopoxviruses. Virology 1998; 244(2):365–396. doi: 10.1006/viro.1998.9123 - DOI - PubMed
    1. Pantaleo G, Esteban M, Jacobs B, Tartaglia J. Poxvirus vector-based HIV vaccines. Curr Opin HIV AIDS 2010; 5(5):391–396. doi: 10.1097/COH.0b013e32833d1e87 - DOI - PubMed
    1. Gomez CE, Perdiguero B, Garcia-Arriaza J, Esteban M. Poxvirus vectors as HIV/AIDS vaccines in humans. Hum Vaccin Immunother 2012; 8(9):1192–1207. doi: 10.4161/hv.20778 - DOI - PMC - PubMed
    1. Sanchez-Sampedro L, Perdiguero B, Mejias-Perez E, Garcia-Arriaza J, Di PM, Esteban M. The evolution of poxvirus vaccines. Viruses 2015; 7(4):1726–1803. doi: 10.3390/v7041726 - DOI - PMC - PubMed

Publication types

Associated data