

Endosphere microbiome comparison between symptomatic and asymptomatic roots of Brassica napus infected with Plasmodiophora brassicae
- PMID: 29065162
- PMCID: PMC5655474
- DOI: 10.1371/journal.pone.0185907
Endosphere microbiome comparison between symptomatic and asymptomatic roots of Brassica napus infected with Plasmodiophora brassicae
Abstract
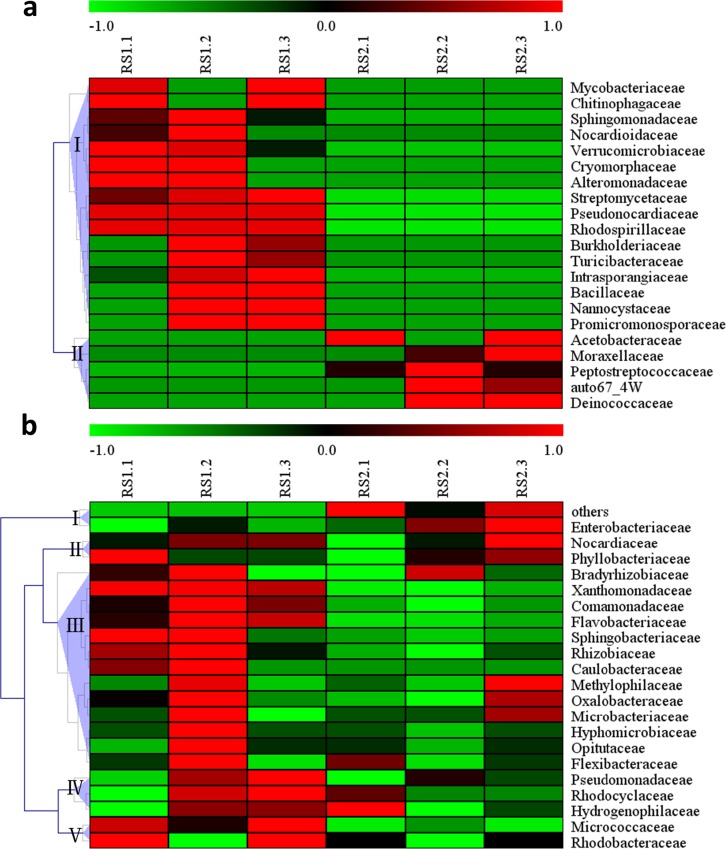
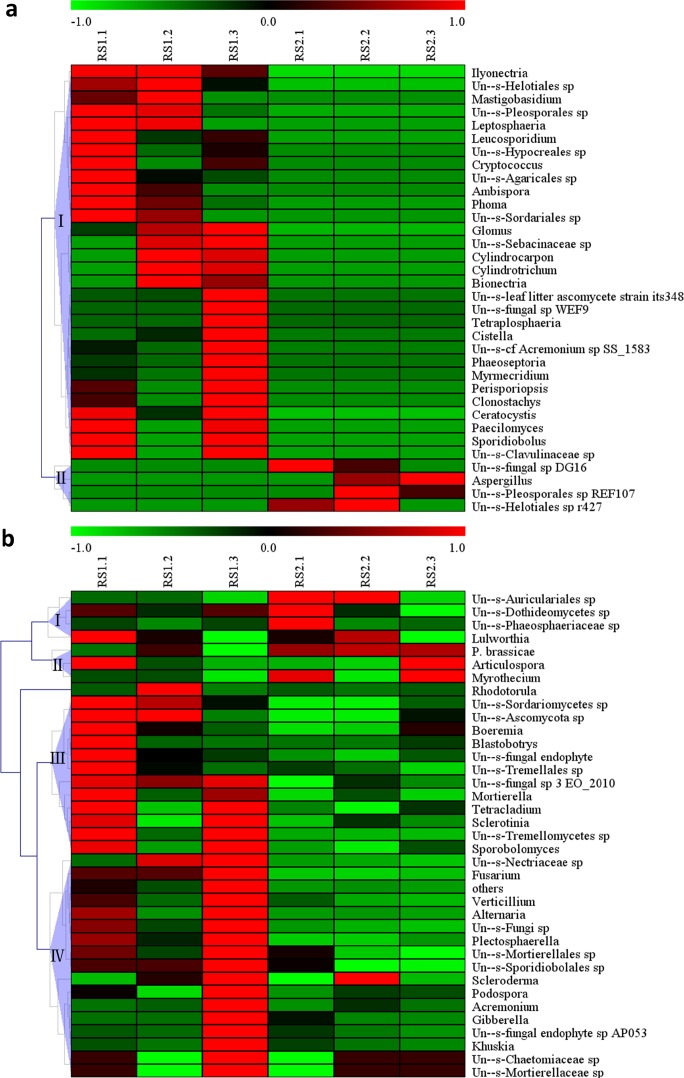
Clubroot caused by Plasmodiophora brassicae, is a severe disease of cruciferous crops that causes large hypertrophic galls in the roots. The plant microbiome is important for growth promotion and disease suppression. In this study, using 16S rRNA and internal transcribed spacer (ITS) sequencing techniques, we compared the endosphere microbiome of symptomatic and asymptomatic B. napus roots infected with P. brassicae collected from the same natural clubroot field. The results showed that the microbial population and its relative abundance in the asymptomatic roots was far higher than that in the symptomatic roots, and that many microorganisms in asymptomatic roots have biological control and plant growth promotion functions that may be related to clubroot symptoms. These results suggest the importance of the endosphere microbiome in clubroot disease and provide potential bio-control resources for its prevention.
Conflict of interest statement
Figures


Similar articles
-
The clubroot pathogen Plasmodiophora brassicae: A profile update.Mol Plant Pathol. 2023 Feb;24(2):89-106. doi: 10.1111/mpp.13283. Epub 2022 Nov 29. Mol Plant Pathol. 2023. PMID: 36448235 Free PMC article. Review.
-
Plasmodiophora brassicae: a review of an emerging pathogen of the Canadian canola (Brassica napus) crop.Mol Plant Pathol. 2012 Feb;13(2):105-13. doi: 10.1111/j.1364-3703.2011.00729.x. Epub 2011 Jun 1. Mol Plant Pathol. 2012. PMID: 21726396 Free PMC article. Review.
-
First Report of Clubroot on Capsella bursa-pastoris Caused by Plasmodiophora brassicae in Sichuan Province of China.Plant Dis. 2014 May;98(5):687. doi: 10.1094/PDIS-04-13-0395-PDN. Plant Dis. 2014. PMID: 30708514
-
Evidence that the biofungicide Serenade (Bacillus subtilis) suppresses clubroot on canola via antibiosis and induced host resistance.Phytopathology. 2013 Mar;103(3):245-54. doi: 10.1094/PHYTO-06-12-0123-R. Phytopathology. 2013. PMID: 23113546
-
Exogenous inoculation of endophytic bacterium Bacillus cereus suppresses clubroot (Plasmodiophora brassicae) occurrence in pak choi (Brassica campestris sp. chinensis L.).Planta. 2021 Jan 6;253(2):25. doi: 10.1007/s00425-020-03546-4. Planta. 2021. PMID: 33404767
Cited by
-
Bacillus amyloliquefaciens FH-1 significantly affects cucumber seedlings and the rhizosphere bacterial community but not soil.Sci Rep. 2021 Jun 8;11(1):12055. doi: 10.1038/s41598-021-91399-6. Sci Rep. 2021. PMID: 34103586 Free PMC article.
-
The clubroot pathogen Plasmodiophora brassicae: A profile update.Mol Plant Pathol. 2023 Feb;24(2):89-106. doi: 10.1111/mpp.13283. Epub 2022 Nov 29. Mol Plant Pathol. 2023. PMID: 36448235 Free PMC article. Review.
-
What Can We Learn from -Omics Approaches to Understand Clubroot Disease?Int J Mol Sci. 2022 Jun 4;23(11):6293. doi: 10.3390/ijms23116293. Int J Mol Sci. 2022. PMID: 35682976 Free PMC article. Review.
-
The Brassica napus seed microbiota is cultivar-specific and transmitted via paternal breeding lines.Microb Biotechnol. 2022 Sep;15(9):2379-2390. doi: 10.1111/1751-7915.14077. Epub 2022 May 20. Microb Biotechnol. 2022. PMID: 35593114 Free PMC article.
-
Fecal Microbiota Transplantation Is Associated With Reduced Morbidity and Mortality in Porcine Circovirus Associated Disease.Front Microbiol. 2018 Jul 23;9:1631. doi: 10.3389/fmicb.2018.01631. eCollection 2018. Front Microbiol. 2018. PMID: 30083142 Free PMC article.
References
-
- Lebeis SL, Rott M, Dangl JL, Schulze-Lefert. Culturing a plant microbiome community at the cross-Rhodes. New Phytol 2012; 196: 341–344. doi: 10.1111/j.1469-8137.2012.04336.x - DOI - PubMed
-
- Bulgarelli D, Schlaeppi K, Spaepen S, Ver Loren van Themaat E, Schulze-Lefert P. Structure and functions of the bacterial microbiota of plants. Annu Rev Plant Biol 2013; 64: 807–838. doi: 10.1146/annurev-arplant-050312-120106 - DOI - PubMed
-
- Turner TR, James EK, Poole PS. The plant microbiome. Genome Biol 2013; 14: 209 doi: 10.1186/gb-2013-14-6-209 - DOI - PMC - PubMed
-
- Vandenkoornhuyse P, Quaiser A, Duhamel M, Le Van A, Dufresne A. The importance of the microbiome of the plant holobiont. New Phytol 2015; 206: 1196–1206. doi: 10.1111/nph.13312 - DOI - PubMed
-
- Berendsen RL, Pieterse CM, Bakker PA. The rhizosphere microbiome and plant health. Trends Plant Sci 2012; 17: 478–486. doi: 10.1016/j.tplants.2012.04.001 - DOI - PubMed
Publication types
MeSH terms
LinkOut - more resources
Full Text Sources
Other Literature Sources
