

Cellular bioenergetics is impaired in patients with chronic fatigue syndrome
- PMID: 29065167
- PMCID: PMC5655451
- DOI: 10.1371/journal.pone.0186802
Cellular bioenergetics is impaired in patients with chronic fatigue syndrome
Erratum in
-
Correction: Cellular bioenergetics is impaired in patients with chronic fatigue syndrome.PLoS One. 2018 Feb 8;13(2):e0192817. doi: 10.1371/journal.pone.0192817. eCollection 2018. PLoS One. 2018. PMID: 29420633 Free PMC article.
Abstract
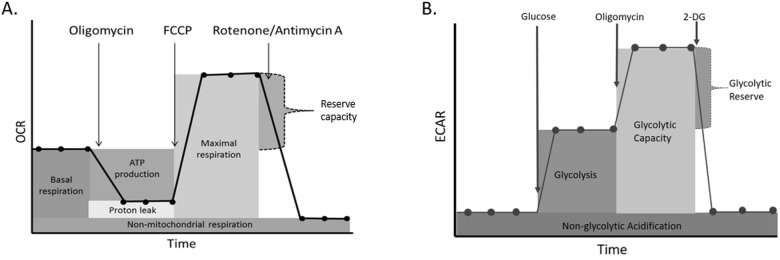
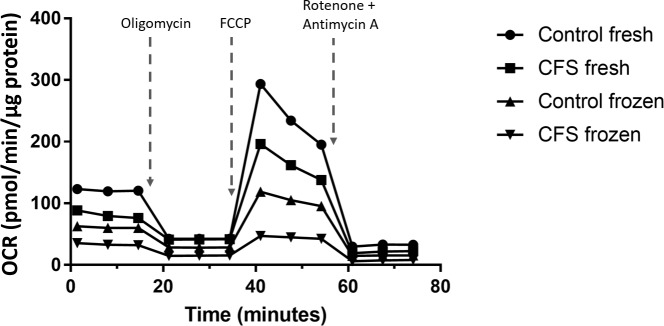
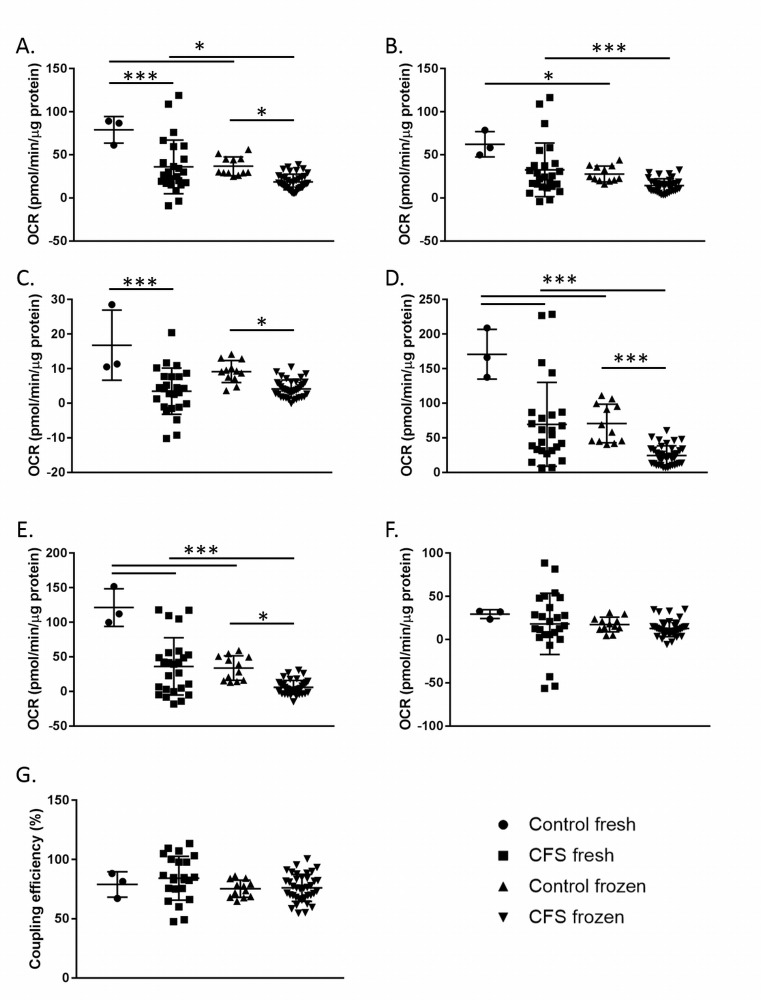
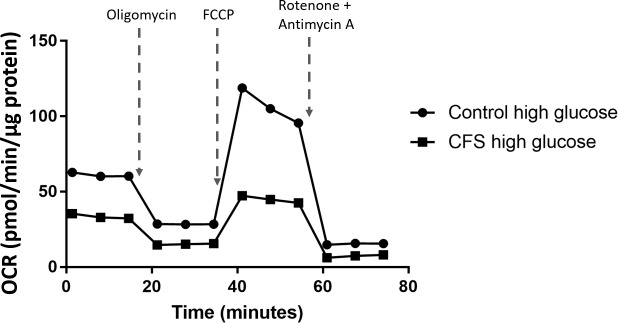
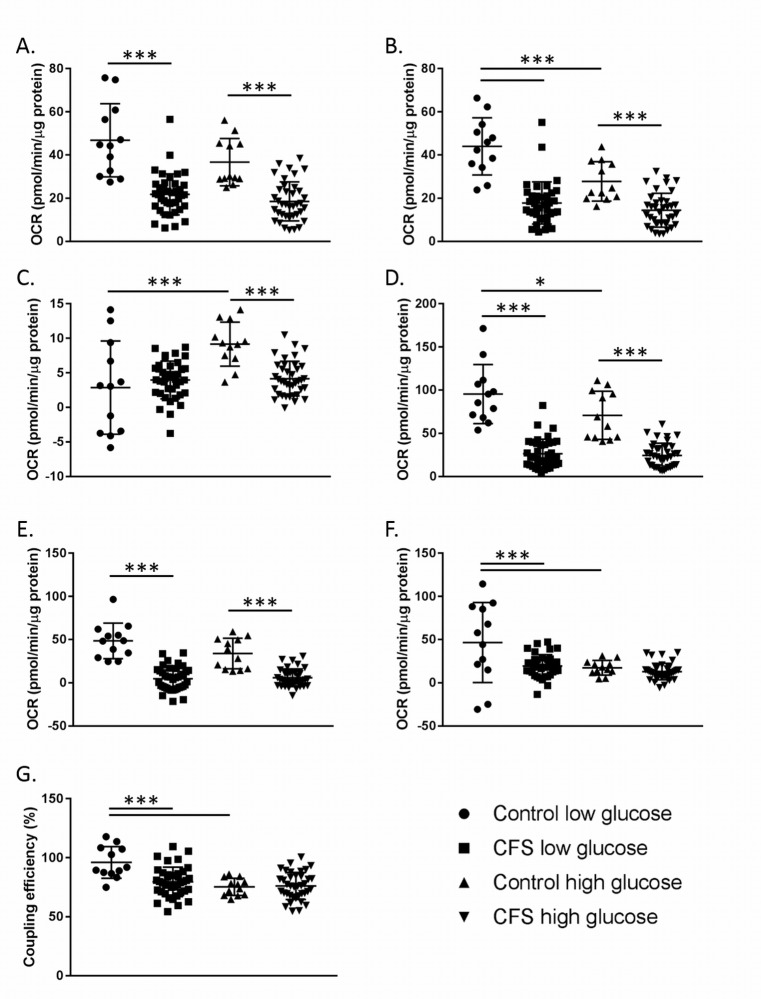
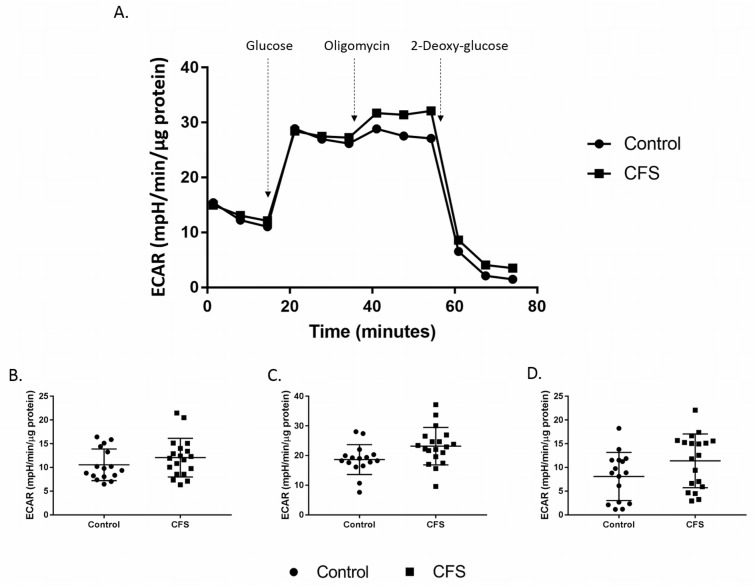
Chronic fatigue syndrome (CFS) is a highly debilitating disease of unknown aetiology. Abnormalities in bioenergetic function have been cited as one possible cause for CFS. Preliminary studies were performed to investigate cellular bioenergetic abnormalities in CFS patients. A series of assays were conducted using peripheral blood mononuclear cells (PBMCs) from CFS patients and healthy controls. These experiments investigated cellular patterns in oxidative phosphorylation (OXPHOS) and glycolysis. Results showed consistently lower measures of OXPHOS parameters in PBMCs taken from CFS patients compared with healthy controls. Seven key parameters of OXPHOS were calculated: basal respiration, ATP production, proton leak, maximal respiration, reserve capacity, non-mitochondrial respiration, and coupling efficiency. While many of the parameters differed between the CFS and control cohorts, maximal respiration was determined to be the key parameter in mitochondrial function to differ between CFS and control PBMCs due to the consistency of its impairment in CFS patients found throughout the study (p≤0.003). The lower maximal respiration in CFS PBMCs suggests that when the cells experience physiological stress they are less able to elevate their respiration rate to compensate for the increase in stress and are unable to fulfil cellular energy demands. The metabolic differences discovered highlight the inability of CFS patient PBMCs to fulfil cellular energetic demands both under basal conditions and when mitochondria are stressed during periods of high metabolic demand.
Conflict of interest statement
Figures
References
-
- Board on the Health of Select Populations Institute of Medicine. Beyond Myalgic Encephalomyelitis/Chronic Fatigue Syndrome: Redefining an Illness. National Academies Press; (US: )2015. - PubMed
-
- Ottenweller JE, Sisto SA, McCarty RC, Natelson BH. Hormonal responses to exercise in chronic fatigue syndrome. Neuropsychobiology. 2001;43:34–41. - PubMed
-
- VanNess JM, Snell CR, Stevens SR. Diminished cardiopulmonary capacity during post-exertional malaise. Journal of Chronic Fatigue Syndrome. 2008;14:77–85.
-
- Anderson JS, Ferrans CE. The quality of life of persons with chronic fatigue syndrome. Journal of Nervous and Mental Disease. 1997;185:359–67. - PubMed
MeSH terms
Substances
Grants and funding
LinkOut - more resources
Full Text Sources
Other Literature Sources
Medical
