. 2017 Oct 24;12(10):e0186846.
doi: 10.1371/journal.pone.0186846. eCollection 2017.

Intravital imaging of osteocytes in mouse calvaria using third harmonic generation microscopy

Affiliations

Intravital imaging of osteocytes in mouse calvaria using third harmonic generation microscopy

Danielle Tokarz et al. PLoS One. .

Abstract

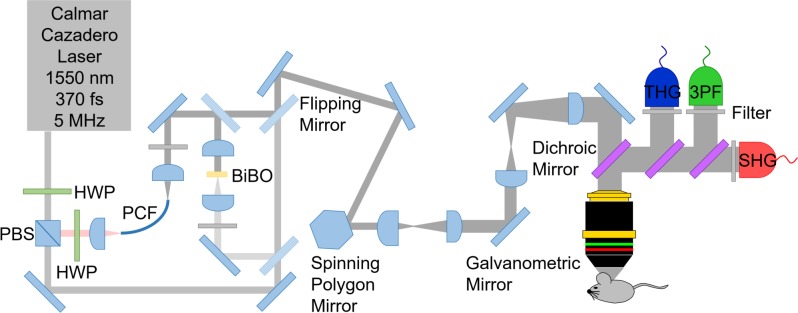
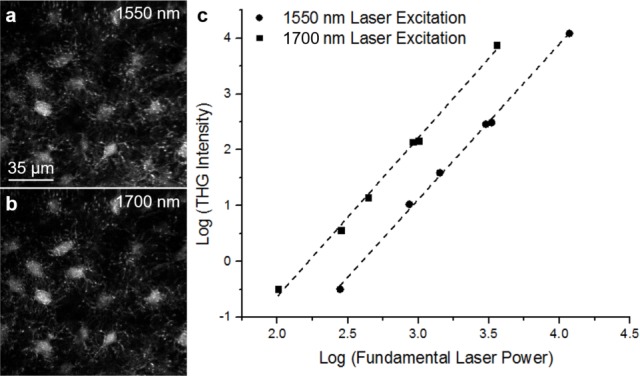
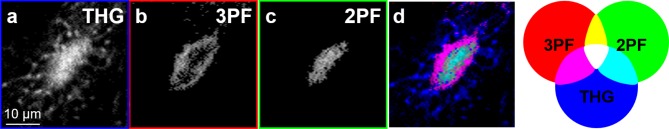
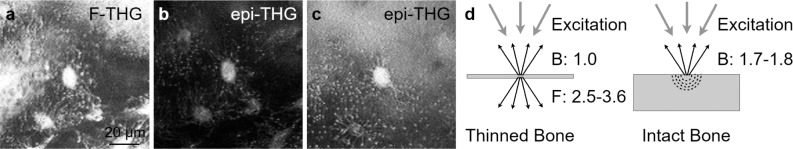
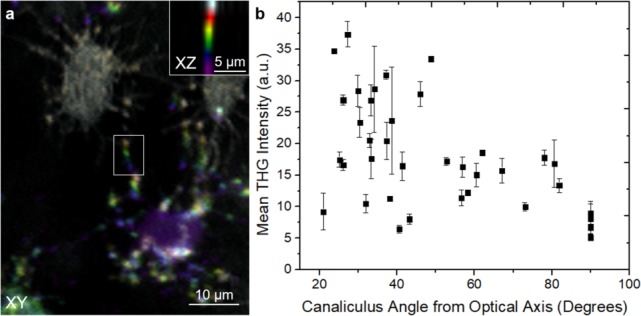
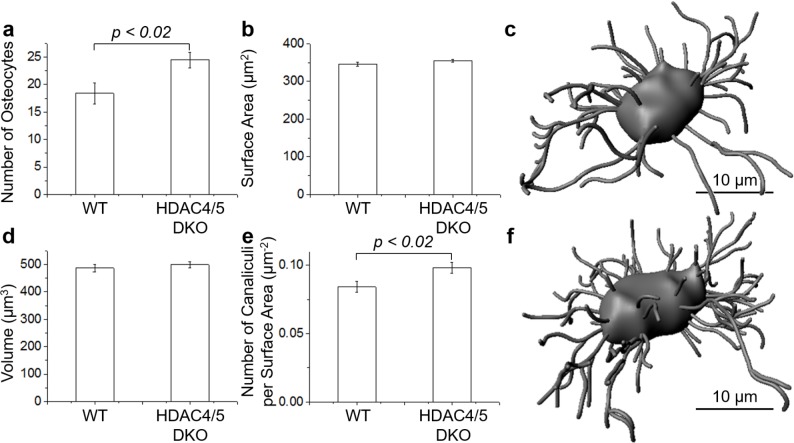
Osteocytes are the most abundant cell in the bone, and have multiple functions including mechanosensing and regulation of bone remodeling activities. Since osteocytes are embedded in the bone matrix, their inaccessibility makes in vivo studies problematic. Therefore, a non-invasive technique with high spatial resolution is desired. The purpose of this study is to investigate the use of third harmonic generation (THG) microscopy as a noninvasive technique for high-resolution imaging of the lacunar-canalicular network (LCN) in live mice. By performing THG imaging in combination with two- and three-photon fluorescence microscopy, we show that THG signal is produced from the bone-interstitial fluid boundary of the lacuna, while the interstitial fluid-osteocyte cell boundary shows a weaker THG signal. Canaliculi are also readily visualized by THG imaging, with canaliculi oriented at small angles relative to the optical axis exhibiting stronger signal intensity compared to those oriented perpendicular to the optical axis (parallel to the image plane). By measuring forward- versus epi-detected THG signals in thinned versus thick bone samples ex vivo, we found that the epi-collected THG from the LCN of intact bone contains a superposition of backward-directed and backscattered forward-THG. As an example of a biological application, THG was used as a label-free imaging technique to study structural variations in the LCN of live mice deficient in both histone deacetylase 4 and 5 (HDAC4, HDAC5). Three-dimensional analyses were performed and revealed statistically significant differences between the HDAC4/5 double knockout and wild type mice in the number of osteocytes per volume and the number of canaliculi per lacunar surface area. These changes in osteocyte density and dendritic projections occurred without differences in lacunar size. This study demonstrates that THG microscopy imaging of the LCN in live mice enables quantitative analysis of osteocytes in animal models without the use of dyes or physical sectioning.


Conflict of interest statement

Competing Interests: The authors have declared that no competing interests exist.

Figures

Fig 1
Fig 1. A schematic of the laser microscope for three-photon imaging using 1550 nm and 1700 nm.
Second and third harmonic generation (SHG and THG) as well as three photon excitation fluorescence (3PF) are collected while the laser is scanned with a polygonal and galvanometric mirror pair. HWP represents half-wave plates, PCF represents a polarization maintaining large mode area single mode photonic crystal fiber for generation of 1700 nm, while BiBO represents a bismuth borate crystal for frequency doubling of 1700 nm.
Fig 2
Fig 2. THG power dependency plot.
THG images of osteocytes obtained at 1550 nm (a) and 1700 nm (b) excitation in vivo as well as a logarithmic plot (c) of the THG intensity of an osteocyte with fundamental laser power for both 1550 nm and 1700 nm excitation. The data was fit with a line corresponding to a slope of 2.8 ± 0.2 for 1550 nm excitation and 2.9 ± 0.2 for 1700 nm excitation.
Fig 3
Fig 3. Images of a lacuna and canaliculi in the calvarial bone of a transgenic 2.3ColGFP mouse.
THG (a) and 3PF of SR101 dye (b) were imaged with 1700 nm excitation while 2PF from GFP (c) was imaged with 850 nm excitation. A structural image cross-correlation analysis [31, 32] between 3PF, 2PF, and THG was performed (d).
Fig 4
Fig 4. Forward-THG versus epi-THG from the LCN.
Forward-THG (F-THG) (a) and epi-THG (epi-THG) (b) images of lacunae and canaliculi in thinned calvarial bone from a WT mouse taken with 1550 nm excitation and compared to an epi-THG image of the calvarial bone of WT mouse in vivo without bone thinning (c). The results are summarized in (d) showing that epi-collected THG is a combination of backwards-directed and backscattered forward-generated signals.
Fig 5
Fig 5. THG signal intensity from canaliculi oriented at a number of angles to the optical axis.
From optical sections of epi-THG collected signal from a WT mouse in vivo, a summed image of 6 consecutive XY slices which are 2 μm apart in Z were colored in such a way that the top slice is white, second slice is red, third slice is yellow, fourth slice is green, fifth slice is blue and the bottom slice is purple (a). A summed image of 6 consecutive XZ slices of the area of the canaliculus outlined in a white box is shown in the inset of (a) demonstrating that the canaliculus is parallel to laser propagation which is along Z. The tilt angle between bright areas within a canaliculus was calculated and the corresponding average THG intensities were plotted (b).
Fig 6
Fig 6. LCN parameters for WT and HDAC4/5 DKO mice.
Measurement of the number of osteocytes in a volume consisting of 100 × 100 × 10 μm3 (a), lacunar surface area (b) and lacunar volume (d) per osteocyte as well as the number of canaliculi per lacunar surface area (e) in WT and HDAC4/5 DKO mice. Data are represented as the mean ± standard deviation (error bar). A statistically significant difference was not found in the lacunar surface area and volume measurements. The lacunar surface area, lacunar volume and number of canaliculi were determined from 3D renderings generated with Imaris software where an example osteocyte in WT (c) and HDAC4/5 DKO (f) mice is shown.

References

    1. Webster DJ, Schneider P, Dallas SL, Muller R. Studying osteocytes within their environment. Bone. 2013;54: 285–295. doi: 10.1016/j.bone.2013.01.004 - DOI - PMC - PubMed
    1. Berke IM, Miola JP, David MA, Smith MK, Price C. Seeing through musculokeletal tissues: Improving in situ imaging of bone and the lacunar canalicular system through optical clearing. PLoS ONE. 2016;11: e01502681– e015026829. - PMC - PubMed
    1. Kagayama M, Sasano Y, Mizoguchi I, Takahashi I. Confocal microscopy of cementocytes and their lacunae and canaliculi in rat molars. Anat Embryol. 1997;195: 491–496. - PubMed
    1. Knothe Tate ML, Niederer P, Knothe U. In vivo tracer transport through the lacunocanalicular system of rat bone in an environment devoid of mechanical loading. Bone. 1998;22: 107–117. - PubMed
    1. Feng JQ, Ward LM, Liu S, Lu Y, Xie Y, Yuan B, et al. Loss of DMP1 causes rickets and osteomalacia and identifies a role for osteocytes in mineral metabolism. Nat. Genet. 2006;38: 1310–1315. doi: 10.1038/ng1905 - DOI - PMC - PubMed

LinkOut - more resources