. 2017 Oct 21;7(10):339.
doi: 10.3390/nano7100339.

Few-Flakes Reduced Graphene Oxide Sensors for Organic Vapors with a High Signal-to-Noise Ratio

Affiliations

Few-Flakes Reduced Graphene Oxide Sensors for Organic Vapors with a High Signal-to-Noise Ratio

Nowzesh Hasan et al. Nanomaterials (Basel). .

Abstract

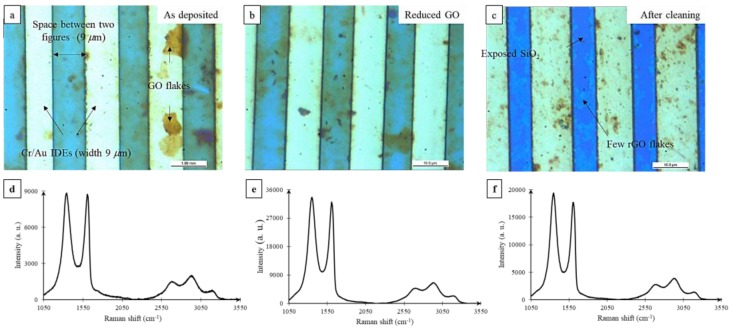
This paper reports our findings on how to prepare a graphene oxide-based gas sensor for sensing fast pulses of volatile organic compounds with a better signal-to-noise ratio. We use rapid acetone pulses of varying concentrations to test the sensors. First, we compare the effect of graphene oxide deposition method (dielectrophoresis versus solvent evaporation) on the sensor's response. We find that dielectrophoresis yields films with uniform coverage and better sensor response. Second, we examine the effect of chemical reduction. Contrary to prior reports, we find that graphene oxide reduction leads to a reduction in sensor response and current noise, thus keeping the signal-to-noise ratio the same. We found that if we sonicated the sensor in acetone, we created a sensor with a few flakes of reduced graphene oxide. Such sensors provided a higher signal-to-noise ratio that could be correlated to the vapor concentration of acetone with better repeatability. Modeling shows that the sensor's response is due to one-site Langmuir adsorption or an overall single exponent process. Further, the desorption of acetone as deduced from the sensor recovery signal follows a single exponent process. Thus, we show a simple way to improve the signal-to-noise ratio in reduced graphene oxide sensors.

Keywords: graphene gas sensor; graphene oxide; reduced graphene oxide.


Conflict of interest statement

The authors declare no conflict of interest.

Figures

Figure 1
Figure 1
Optical microscope images of graphene oxide (GO) films deposited via (a) the solvent evaporation method; and (b) the DEP method. Response (%) is the percentage variation of the electrical resistance from GO-coated sensors as a function of direct current (DC) voltage (V) when exposed to 2 s acetone vapor (partial pressure, P/Po = 0.2, 25 °C, 1 atm) pulses in two independent experiments (c,d). The error bars represent the maximum and minimum values of Response (%) obtained from five vapor pulses.
Figure 1
Figure 1
Optical microscope images of graphene oxide (GO) films deposited via (a) the solvent evaporation method; and (b) the DEP method. Response (%) is the percentage variation of the electrical resistance from GO-coated sensors as a function of direct current (DC) voltage (V) when exposed to 2 s acetone vapor (partial pressure, P/Po = 0.2, 25 °C, 1 atm) pulses in two independent experiments (c,d). The error bars represent the maximum and minimum values of Response (%) obtained from five vapor pulses.
Figure 2
Figure 2
Effect of chemical reduction on a GO sensor’s response to 2 s of acetone vapor pulses (P/Po = 0.2, 25 °C, 1 atm). Plot of Response (%) versus DC bias for three different GO sensors (ac), before and after a hydrazine vapor-assisted reduction for varying times. (a) Response (%) from sensor S1 without any reduction (open squares), and after 30 min of reduction (open circles); (b) Response (%) from sensor S2 without any reduction (open squares), after 30 min of reduction (open circles), after 1 h of reduction (open triangles), and after 3 h of reduction (open diamonds); (c) Response (%) from sensor S3 without reduction (open squares), after 3 h of reduction (open circles), and after 5 h of reduction (open triangles). The error bars represent the maximum and minimum values of Response (%) obtained from five vapor pulses.
Figure 2
Figure 2
Effect of chemical reduction on a GO sensor’s response to 2 s of acetone vapor pulses (P/Po = 0.2, 25 °C, 1 atm). Plot of Response (%) versus DC bias for three different GO sensors (ac), before and after a hydrazine vapor-assisted reduction for varying times. (a) Response (%) from sensor S1 without any reduction (open squares), and after 30 min of reduction (open circles); (b) Response (%) from sensor S2 without any reduction (open squares), after 30 min of reduction (open circles), after 1 h of reduction (open triangles), and after 3 h of reduction (open diamonds); (c) Response (%) from sensor S3 without reduction (open squares), after 3 h of reduction (open circles), and after 5 h of reduction (open triangles). The error bars represent the maximum and minimum values of Response (%) obtained from five vapor pulses.
Figure 3
Figure 3
Optical image (a) of interdigitated electrodes (IDEs) with as-deposited GO; (b) IDEs with reduced graphene oxide (rGO); and (c) IDEs with solvent-exfoliated rGO. Raman spectra of (d) as-deposited GO; (e) rGO; and (f) solvent-exfoliated rGO.
Figure 4
Figure 4
Scanning electron microscope (SEM) image (ac) of IDEs with as-deposited GO; and (df) IDEs with solvent-exfoliated rGO.
Figure 5
Figure 5
Atomic force microscopy images of few-flakes GO on (a) the IDE; (b) between two electrodes; and (c) on a flat piece of silicon. The label “1” indicates the sectioning line along with the height profile that was obtained as shown below each image.
Figure 6
Figure 6
Sensor current in response to 2 s of acetone vapor (P/Po = 0.2, 25 °C, 1 atm) pulses observed on GO sensor S3 (a) as-deposited; (b) after 5 h of reduction with hydrazine vapor; and (c) after solvent exfoliation. DC bias was held constant at 400 mV. (d) Current responses to four acetone vapor pulses obtained from the solvent-exfoliated rGO sensor (different colored lines represent different trials). (e) Current response to 2 s of acetone vapor pulses of varying partial pressure from the solvent-exfoliated rGO sensor. (f) Response (%) calculated for signals in (e) plotted versus the partial pressure of acetone used to test response. SNR: signal-to-noise ratio.
Figure 6
Figure 6
Sensor current in response to 2 s of acetone vapor (P/Po = 0.2, 25 °C, 1 atm) pulses observed on GO sensor S3 (a) as-deposited; (b) after 5 h of reduction with hydrazine vapor; and (c) after solvent exfoliation. DC bias was held constant at 400 mV. (d) Current responses to four acetone vapor pulses obtained from the solvent-exfoliated rGO sensor (different colored lines represent different trials). (e) Current response to 2 s of acetone vapor pulses of varying partial pressure from the solvent-exfoliated rGO sensor. (f) Response (%) calculated for signals in (e) plotted versus the partial pressure of acetone used to test response. SNR: signal-to-noise ratio.
Figure 7
Figure 7
Effect of solvent-mediated cleaning on the response of GO sensors S3 and S4 to 2 s of acetone vapor pulses (P/Po = 0.2, 25 °C, 1 atm). Response (%) (a,b) and SNR (c,d) from two different sensors with as-deposited GO film, after 5 h of reduction with hydrazine vapor, and solvent-mediated cleaning of the reduced GO film. (a) Response (%) from first sensor without any reduction (open squares), after 5 h of reduction (open triangles), and after cleaning (asterisks). (b) Response (%) from the second sensor without any reduction (open squares), after 5 h of reduction (open triangles), and after cleaning (asterisks). (c) SNR from the first sensor without any reduction (open squares), after 5 h of reduction (open triangles), and after cleaning (asterisks). (d) SNR from the second sensor without any reduction (open squares), after 5 h of reduction (open triangles), and after cleaning (asterisks). The error bars represent the maximum and minimum values of the Response (%) and SNR obtained from five vapor pulses. Some error bars for the SNR are difficult to see on the semi-log plot.
Figure 8
Figure 8
(a) Image of the chip with a 3 × 3 array of IDEs. The chip is 2.8 cm in length and 1.4 cm in width. Circular windows of 1.3 mm diameter were opened in the insulator layer over each IDE to expose electrodes for GO deposition. (b) Exploded view of the IDE fabricated on a silicon/silicon dioxide substrate consisting of a Cr/Au IDE pair coated with an oxide layer. (c) Depiction of the non-uniform electric field applied horizontally during DEP deposition of GO. Blue particles have material properties that result in a Clausius–Mossotti (CM) factor, κ >0, which results in a DEP force directing it towards the chip surface, also known as positive DEP. Red particles have material properties that result in a CM factor, κ <0, which results in a DEP force directing it away from the chip surface, also known as negative DEP. At 1 MHz, the CM factor for GO leads to a positive DEP leading to GO deposition between the IDE fingers. (d) Image of the test setup with a gas outlet positioned at a fixed distance over a selected IDE. (e) Image of the measurement setup where IDE arrays were electrically connected through a high-density card edge connector to CompactStat® (Ivium Technologies, Eindhoven, the Netherlands) for amperometric detection. The device was set inside a Faraday cage. Chemical vapors were injected using a glass syringe and polytetrafluoroethylene (PTFE) tubing. (f) Sample sensor response to acetone vapor injection and graphical illustration of how Isignal, Iinitial, and Imin were measured. PC: personal computer.

Similar articles

Cited by

References

    1. Borini S., White R., Wei D., Astley M., Haque S., Spigone E., Harris N., Kivioja J., Ryhanen T. Ultrafast graphene oxide humidity sensors. ACS Nano. 2013;7:11166–11173. doi: 10.1021/nn404889b. - DOI - PubMed
    1. Bo Z., Shuai X., Mao S., Yang H., Qian J., Chen J., Yan J., Cen K. Green preparation of reduced graphene oxide for sensing and energy storage applications. Sci. Rep. 2014;4:4684. doi: 10.1038/srep04684. - DOI - PMC - PubMed
    1. How G.T.S., Pandikumar A., Ming H.N., Ngee L.H. Highly exposed {001} facets of titanium dioxide modified with reduced graphene oxide for dopamine sensing. Sci. Rep. 2014;4:5044. doi: 10.1038/srep05044. - DOI - PMC - PubMed
    1. Bi H., Yin K., Xie X., Ji J., Wan S., Sun L., Terrones M., Dresselhaus M.S. Ultrahigh humidity sensitivity of graphene oxide. Sci. Rep. 2013;3:2714. doi: 10.1038/srep02714. - DOI - PMC - PubMed
    1. Novoselov K.S., Fal V., Colombo L., Gellert P., Schwab M., Kim K. A roadmap for graphene. Nature. 2012;490:192–200. doi: 10.1038/nature11458. - DOI - PubMed

LinkOut - more resources