

Effects of Scan Resolutions and Element Sizes on Bovine Vertebral Mechanical Parameters from Quantitative Computed Tomography-Based Finite Element Analysis
- PMID: 29065624
- PMCID: PMC5474284
- DOI: 10.1155/2017/5707568
Effects of Scan Resolutions and Element Sizes on Bovine Vertebral Mechanical Parameters from Quantitative Computed Tomography-Based Finite Element Analysis
Abstract
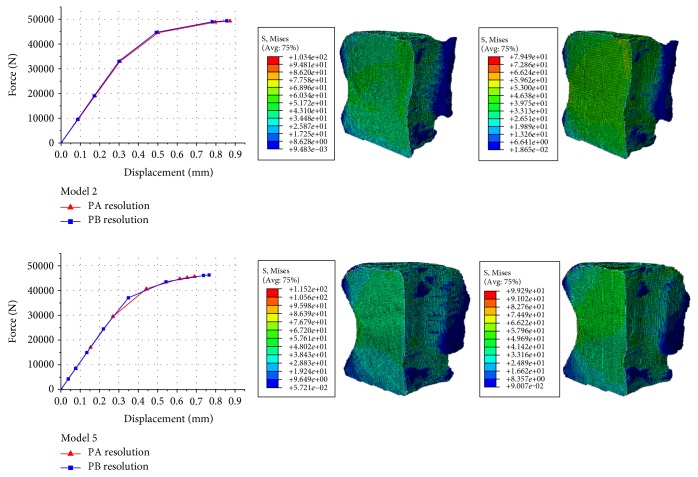
Quantitative computed tomography-based finite element analysis (QCT/FEA) has been developed to predict vertebral strength. However, QCT/FEA models may be different with scan resolutions and element sizes. The aim of this study was to explore the effects of scan resolutions and element sizes on QCT/FEA outcomes. Nine bovine vertebral bodies were scanned using the clinical CT scanner and reconstructed from datasets with the two-slice thickness, that is, 0.6 mm (PA resolution) and 1 mm (PB resolution). There were significantly linear correlations between the predicted and measured principal strains (R2 > 0.7, P < 0.0001), and the predicted vertebral strength and stiffness were modestly correlated with the experimental values (R2 > 0.6, P < 0.05). Two different resolutions and six different element sizes were combined in pairs, and finite element (FE) models of bovine vertebral cancellous bones in the 12 cases were obtained. It showed that the mechanical parameters of FE models with the PB resolution were similar to those with the PA resolution. The computational accuracy of FE models with the element sizes of 0.41 × 0.41 × 0.6 mm3 and 0.41 × 0.41 × 1 mm3 was higher by comparing the apparent elastic modulus and yield strength. Therefore, scan resolution and element size should be chosen optimally to improve the accuracy of QCT/FEA.
Figures


Similar articles
-
Influence of 3D QCT scan protocol on the QCT-based finite element models of human vertebral cancellous bone.Med Eng Phys. 2014 Aug;36(8):1069-73. doi: 10.1016/j.medengphy.2014.05.001. Epub 2014 Jun 2. Med Eng Phys. 2014. PMID: 24894031
-
The effect of in situ/in vitro three-dimensional quantitative computed tomography image voxel size on the finite element model of human vertebral cancellous bone.Proc Inst Mech Eng H. 2014 Nov;228(11):1208-13. doi: 10.1177/0954411914558654. Proc Inst Mech Eng H. 2014. PMID: 25500865
-
Quantitative Computed Tomography Protocols Affect Material Mapping and Quantitative Computed Tomography-Based Finite-Element Analysis Predicted Stiffness.J Biomech Eng. 2016 Sep 1;138(9):0910031-7. doi: 10.1115/1.4034172. J Biomech Eng. 2016. PMID: 27428281 Free PMC article.
-
Quantitative Computed Tomography (QCT) derived Bone Mineral Density (BMD) in finite element studies: a review of the literature.J Exp Orthop. 2016 Dec;3(1):36. doi: 10.1186/s40634-016-0072-2. Epub 2016 Dec 9. J Exp Orthop. 2016. PMID: 27943224 Free PMC article. Review.
-
Computed tomography-based finite element analysis to assess fracture risk and osteoporosis treatment.World J Exp Med. 2015 Aug 20;5(3):182-7. doi: 10.5493/wjem.v5.i3.182. eCollection 2015 Aug 20. World J Exp Med. 2015. PMID: 26309819 Free PMC article. Review.
Cited by
-
Patient-Specific Bone Multiscale Modelling, Fracture Simulation and Risk Analysis-A Survey.Materials (Basel). 2019 Dec 24;13(1):106. doi: 10.3390/ma13010106. Materials (Basel). 2019. PMID: 31878356 Free PMC article. Review.
References
-
- Lochmüller E. M., Bürklein D., Kuhn V., et al. Mechanical strength of the thoracolumbar spine in the elderly: prediction from in situ dual-energy X-ray absorptiometry, quantitative computed tomography (QCT), upper and lower limb peripheral QCT, and quantitative ultrasound. Bone. 2002;31(1):77–84. doi: 10.1016/S8756-3282(02)00792-5. - DOI - PubMed
Publication types
MeSH terms
LinkOut - more resources
Full Text Sources
Other Literature Sources
Medical
