. 2017:2017:7406896.
doi: 10.1155/2017/7406896. Epub 2017 May 9.

A Real-Time Analysis Method for Pulse Rate Variability Based on Improved Basic Scale Entropy

Affiliations

A Real-Time Analysis Method for Pulse Rate Variability Based on Improved Basic Scale Entropy

Yongxin Chou et al. J Healthc Eng. 2017.

Abstract

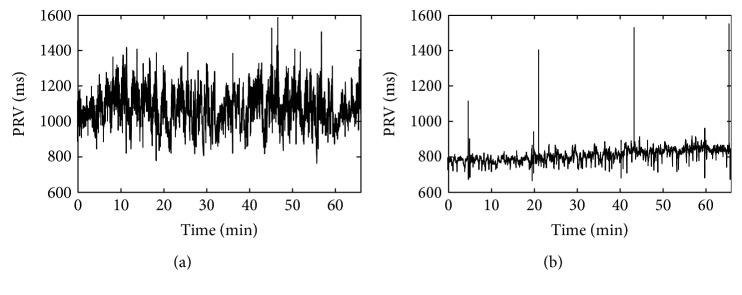
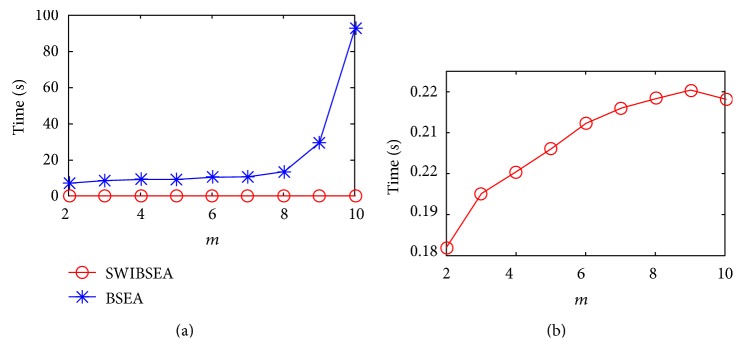
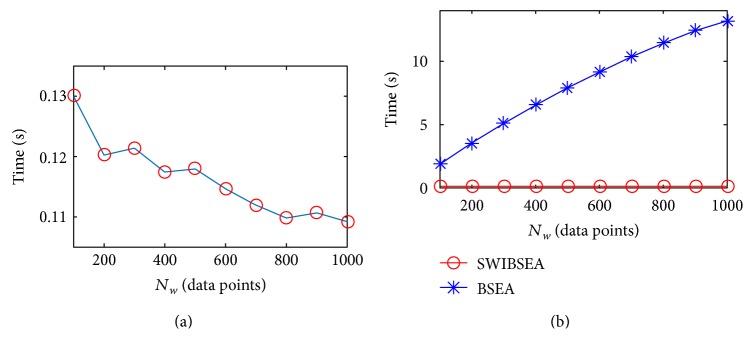
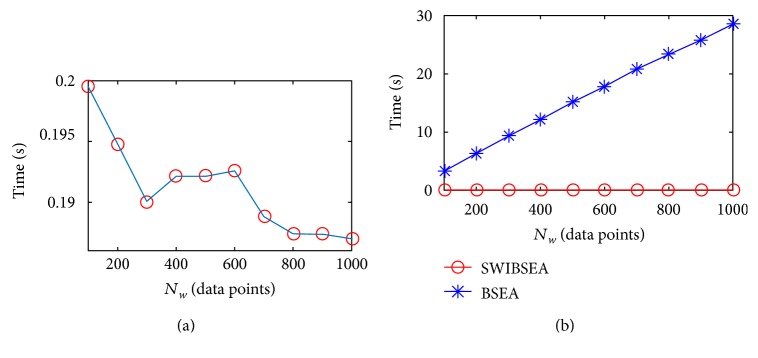
Base scale entropy analysis (BSEA) is a nonlinear method to analyze heart rate variability (HRV) signal. However, the time consumption of BSEA is too long, and it is unknown whether the BSEA is suitable for analyzing pulse rate variability (PRV) signal. Therefore, we proposed a method named sliding window iterative base scale entropy analysis (SWIBSEA) by combining BSEA and sliding window iterative theory. The blood pressure signals of healthy young and old subjects are chosen from the authoritative international database MIT/PhysioNet/Fantasia to generate PRV signals as the experimental data. Then, the BSEA and the SWIBSEA are used to analyze the experimental data; the results show that the SWIBSEA reduces the time consumption and the buffer cache space while it gets the same entropy as BSEA. Meanwhile, the changes of base scale entropy (BSE) for healthy young and old subjects are the same as that of HRV signal. Therefore, the SWIBSEA can be used for deriving some information from long-term and short-term PRV signals in real time, which has the potential for dynamic PRV signal analysis in some portable and wearable medical devices.


Figures

Figure 1
Figure 1
The process of SWIBSEA.
Figure 2
Figure 2
The PRV signal of a young subject (a) and an old subject (b).
Figure 3
Figure 3
The comparison of BSEA and SWIBSEA for a young subject (a) and an old subject (b), when α = 0.5, Nw = 300, and m = 3.
Figure 4
Figure 4
The time consumption of SWIBSEA (b) and BSEA (a) under the different length of SSVs for a young subject, when Nw = 300 and α = 0.5.
Figure 5
Figure 5
The time consumption of SWIBSEA (b) and BSEA (a) under the different length of SSV for an old subject, when Nw = 300 and α = 0.5.
Figure 6
Figure 6
The BSE under different m's, the results are shown with mean ± std, Nw = 300 and α = 0.5. “∗” is the BSE of old subjects; “o” is the BSE of young subjects.
Figure 7
Figure 7
The time consumption of SWIBSEA (a) and BSEA (b) under the different Nw for a young subject, when m = 3, α = 0.5.
Figure 8
Figure 8
The time consumption of SWIBSEA (a) and BSEA (b) under the different Nw for an old subject, when m = 3, α = 0.5.
Figure 9
Figure 9
The BSE under different Nw. The results are shown with mean ± std. m = 3 and α = 0.5. “∗” is the BSE of an old subject; “o” is the BSE of a young subject.
Figure 10
Figure 10
The SSE results of young subjects and old subjects. “o” is the young subjects, and “∗” is the old subjects. Solid line is the linear fitting result of BSE changed with age. Chain dotted line is the 95% confidential region.

Comment in

Similar articles

Cited by

References

    1. Kleiger R. E., Stein P. K., Bigger J. T. Heart rate variability: measurement and clinical utility. Annals of Noninvasive Electrocardiology. 2005;10(1):88–101. doi: 10.1111/j.1542-474X.2005.10101.x. - DOI - PMC - PubMed
    1. Hamilton J. L., Alloy L. B. Atypical reactivity of heart rate variability to stress and depression across development: systematic review of the literature and directions for future research. Clinical Psychology Review. 2016;50:67–79. doi: 10.1016/j.cpr.2016.09.003. - DOI - PMC - PubMed
    1. Schuster A. K., Fisher J. E., Thayer J. F., Mauss D., Jarczok M. N. Decreased heart rate variability correlates to increased cardiovascular risk. International Journal of Cardiology. 2015;203:728–730. doi: 10.1016/j.ijcard.2015.11.027. - DOI - PubMed
    1. Ebrahimzadeh E., Pooyan M., Bijar A. A novel approach to predict sudden cardiac death (SCD) using nonlinear and time-frequency analyses from HRV signals. PLoS One. 2014;9(2, article e81896) doi: 10.1371/journal.pone.0081896. - DOI - PMC - PubMed
    1. Zahedi E., Sohani V., Ali M. A., Chellappan K., Beng G. K. Experimental feasibility study of estimation of the normalized central blood pressure waveform from radial photoplethysmogram. Journal of Healthcare Engineering. 2015;6(1):121–144. doi: 10.1260/2040-2295.6.1.121. - DOI - PubMed

Publication types

LinkOut - more resources