. 2017 Oct 24;8(5):e01514-17.
doi: 10.1128/mBio.01514-17.

Role of Granulocyte-Macrophage Colony-Stimulating Factor Production by T Cells during Mycobacterium tuberculosis Infection

Affiliations

Role of Granulocyte-Macrophage Colony-Stimulating Factor Production by T Cells during Mycobacterium tuberculosis Infection

Alissa C Rothchild et al. mBio. .

Abstract

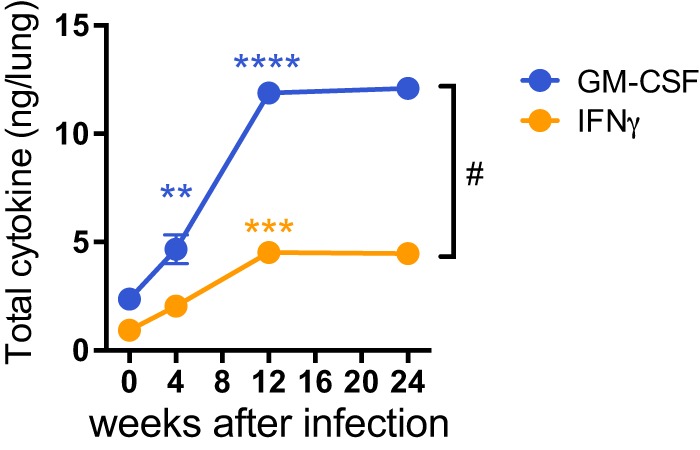
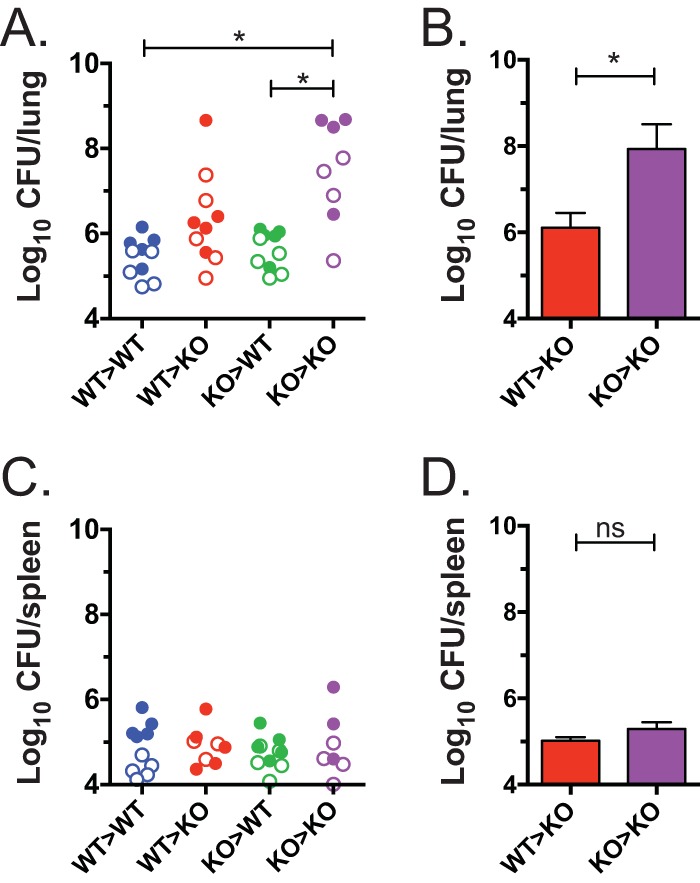
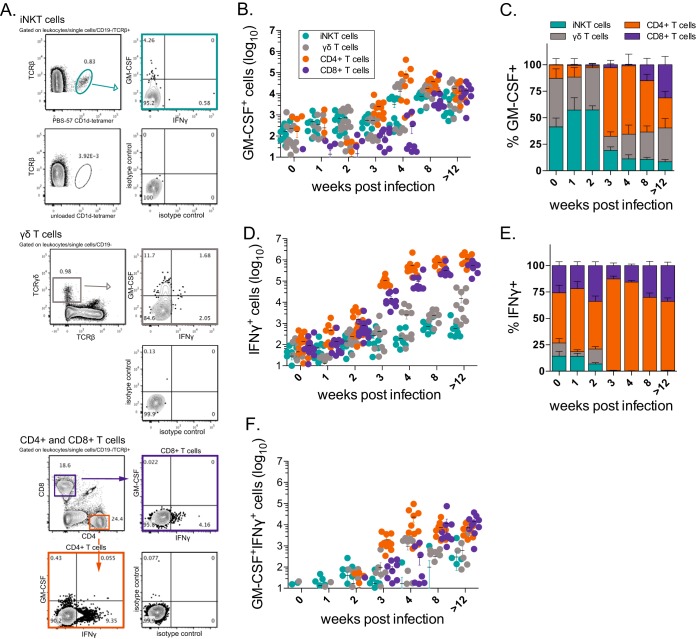
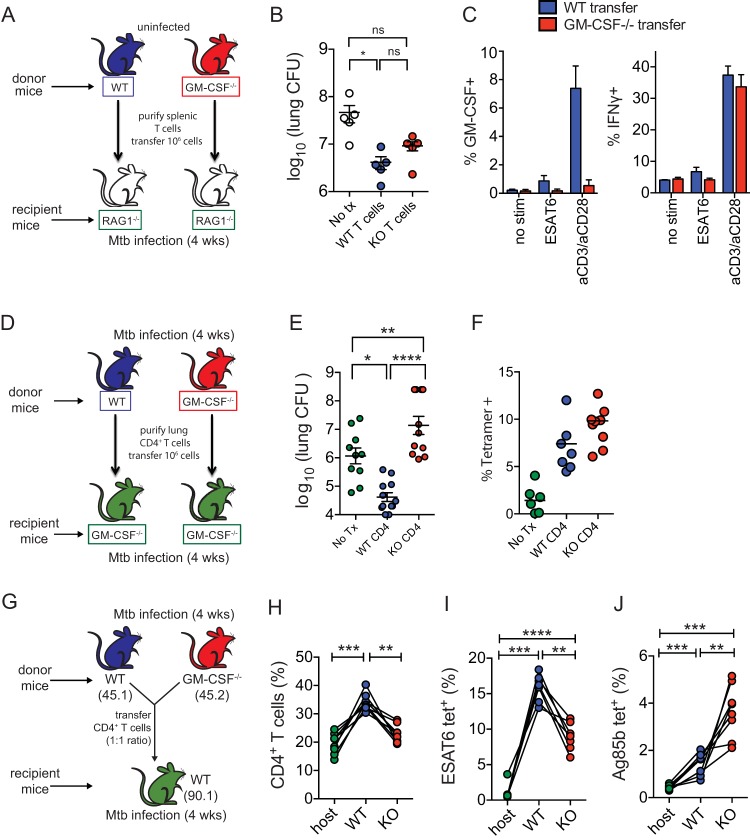
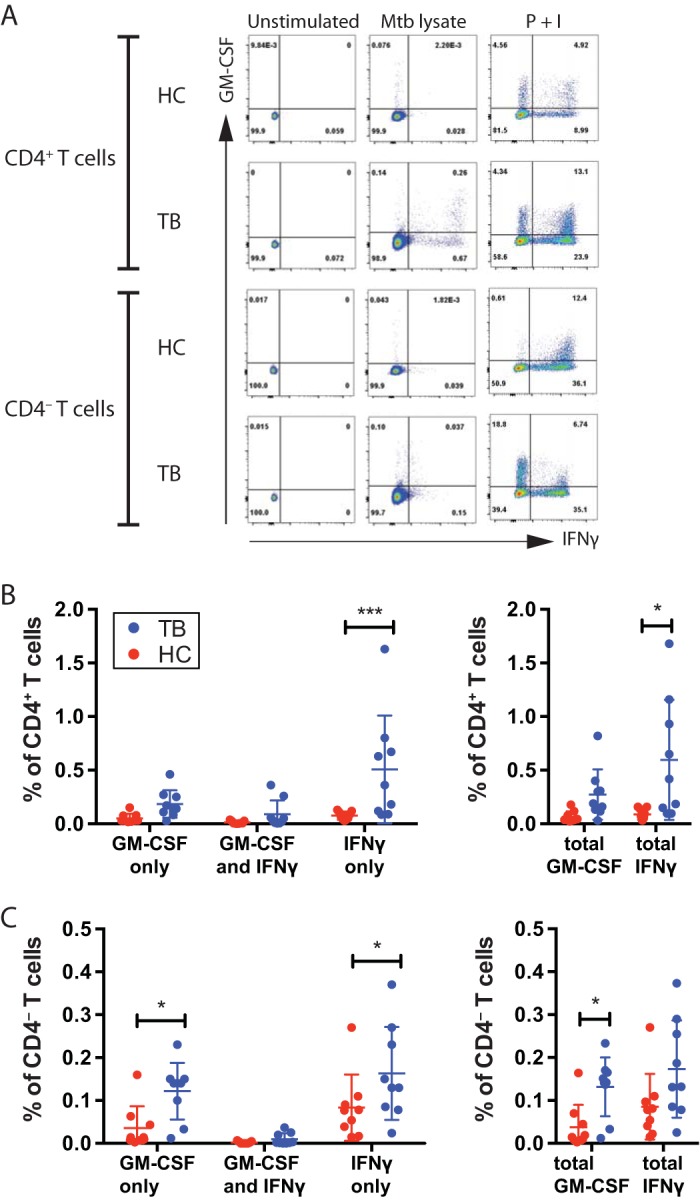
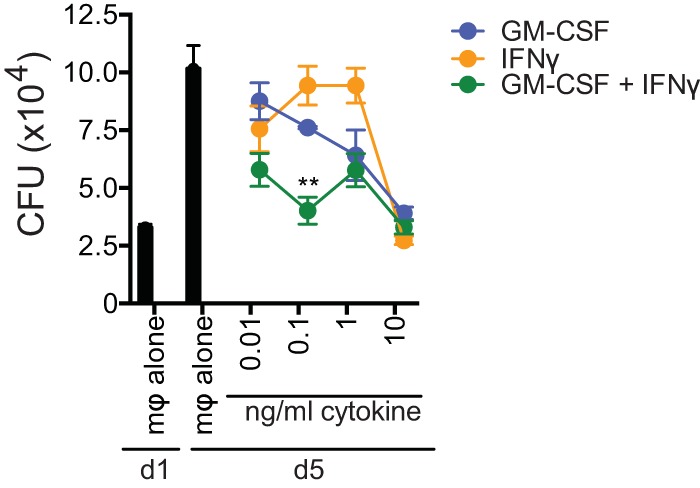
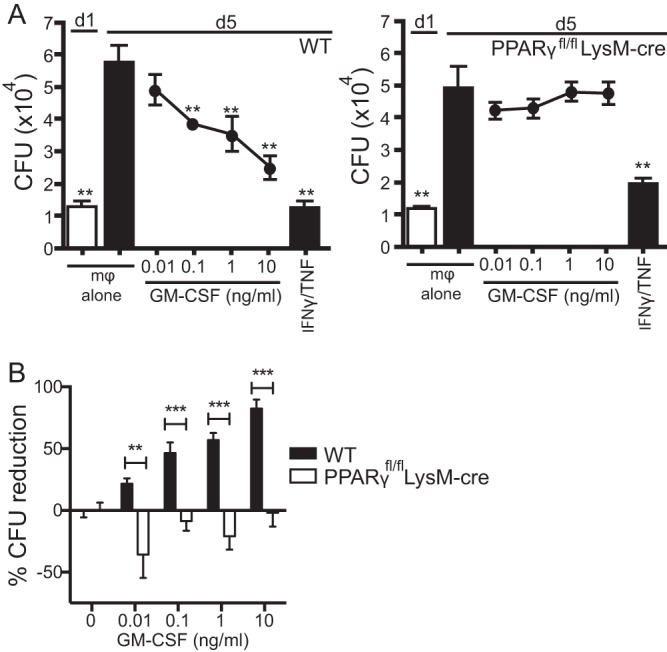
Mice deficient for granulocyte-macrophage colony-stimulating factor (GM-CSF-/-) are highly susceptible to infection with Mycobacterium tuberculosis, and clinical data have shown that anti-GM-CSF neutralizing antibodies can lead to increased susceptibility to tuberculosis in otherwise healthy people. GM-CSF activates human and murine macrophages to inhibit intracellular M. tuberculosis growth. We have previously shown that GM-CSF produced by iNKT cells inhibits growth of M. tuberculosis However, the more general role of T cell-derived GM-CSF during infection has not been defined and how GM-CSF activates macrophages to inhibit bacterial growth is unknown. Here we demonstrate that, in addition to nonconventional T cells, conventional T cells also produce GM-CSF during M. tuberculosis infection. Early during infection, nonconventional iNKT cells and γδ T cells are the main source of GM-CSF, a role subsequently assumed by conventional CD4+ T cells as the infection progresses. M. tuberculosis-specific T cells producing GM-CSF are also detected in the peripheral blood of infected people. Under conditions where nonhematopoietic production of GM-CSF is deficient, T cell production of GM-CSF is protective and required for control of M. tuberculosis infection. However, GM-CSF is not required for T cell-mediated protection in settings where GM-CSF is produced by other cell types. Finally, using an in vitro macrophage infection model, we demonstrate that GM-CSF inhibition of M. tuberculosis growth requires the expression of peroxisome proliferator-activated receptor gamma (PPARγ). Thus, we identified GM-CSF production as a novel T cell effector function. These findings suggest that a strategy augmenting T cell production of GM-CSF could enhance host resistance against M. tuberculosisIMPORTANCEMycobacterium tuberculosis is the bacterium that causes tuberculosis, the leading cause of death by any infection worldwide. T cells are critical components of the immune response to Mycobacterium tuberculosis While gamma interferon (IFN-γ) is a key effector function of T cells during infection, a failed phase IIb clinical trial and other studies have revealed that IFN-γ production alone is not sufficient to control M. tuberculosis In this study, we demonstrate that CD4+, CD8+, and nonconventional T cells produce GM-CSF during Mycobacterium tuberculosis infection in mice and in the peripheral blood of infected humans. Under conditions where other sources of GM-CSF are absent, T cell production of GM-CSF is protective and is required for control of infection. GM-CSF activation of macrophages to limit bacterial growth requires host expression of the transcription factor PPARγ. The identification of GM-CSF production as a T cell effector function may inform future host-directed therapy or vaccine designs.

Keywords: GM-CSF; Mycobacterium tuberculosis; T cells; cytokines; lung infection; macrophages.


Figures

FIG 1
FIG 1
GM-CSF production in the lung increases over the course of M. tuberculosis infection. GM-CSF was measured in a Bioplex immunoassay in lung homogenates at certain weeks post-aerosol infection with the Erdman strain in WT C57BL/6J mice. GM-CSF and IFN-γ protein levels were normalized per lung. **, P < 0.01; ***, P < 0.001; ****, P < 0.0001 (compared to previous time point). #, P < 0.05 for GM-CSF versus IFN-γ.
FIG 2
FIG 2
GM-CSF production by either radioresistant or radiosensitive cells promotes mycobacterial control. (A and C) Reciprocal radiation chimeric mice (donor BM → recipient) were allowed to reconstitute for 8 weeks and then challenged with aerosolized M. tuberculosis, and lung (A) and spleen (C) CFU were determined after 4 weeks. Each group contained 4 to 5 mice, and data were combined from 2 independent experiments (results of the first experiment are shown as open symbols, and those from the second experiment are shown as closed symbols). A one-way ANOVA was used. *, P < 0.05. See Table S1 for statistical analysis of each experiment’s data, analyzed separately and also combined. (B and D) A third experiment was done to compare the how WT → KO and KO → KO BM chimeras controlled M. tuberculosis infection in the lungs (B) and spleen (D). The groups contained 7 and 5 mice, respectively. Bars represent means ± SEM. Analysis was performed using an unpaired t test. *, P < 0.05 (WT versus C57BL/6 mice and KO versus GM-CSF−/− mice).
FIG 3
FIG 3
Multiple T cell subsets produce GM-CSF in the lung during M. tuberculosis infection. (A) Representative flow cytometry plots after gating of iNKT cells, γδ T cells, and CD4+ and CD8+ T cells. Controls for CD1d tetramer and GM-CSF and IFN-γ ICS staining are included. (B and C) Absolute cell numbers (B) and the relative frequency of GM-CSF+ T cells in C57BL/6J mice at various time points after aerosol infection with M. tuberculosis Erdman (C). (D and E) Absolute cell numbers (D) and relative frequencies of IFN-γ+ T cells (E). (F) Absolute numbers of GM-CSF+ IFN-γ+ T cells. Each point represents the result for an individual mouse. Lung cells were cultured in brefeldin A without additional stimulation, and then intracellular cytokine staining was performed. iNKT cells (TCR-β+ CD1d tetramer+), γδ T cells (CD3+ TCR-β TCR-γδ+), CD4+ (TCR-β CD4+ CD8), and CD8+ (TCR-β CD4 CD8+) were evaluated. Data were compiled from 2 or 3 independent experiments for each time point.
FIG 4
FIG 4
T cell-derived GM-CSF controls M. tuberculosis growth. (A) Experimental strategy for transfer of donor WT or GM-CSF−/− T cells into RAG−/− recipient mice, followed by M. tuberculosis aerosol infection. (B) CFU in lungs 4 weeks postinfection after WT or GM-CSF−/− T cells were transferred into RAG−/− recipients. Data are representative of five independent experiments. (C) Percentage of CD4+ T cells producing IFN-γ or GM-CSF after 5 h of ESAT61-20 peptide stimulation or anti-CD3/anti-CD28 stimulation with brefeldin A and IL-2 at 4 weeks postinfection. (D) Experimental strategy for adoptive transfer experiments using sublethally irradiated GM-CSF−/− mice as recipients, who were then infected with M. tuberculosis via aerosol. (E) CFU in lungs 4 weeks postinfection after WT or GM-CSF−/− CD4+ T cells were transferred into GM-CSF−/− recipients. Data were compiled from 4 independent infections with a total of n = 16 to 19 mice per condition. (F) Frequency of ESAT63-17 tetramer-positive CD4+ T cells from donor WT and GM-CSF−/− infected mice 4 weeks after sublethal irradiation, adoptive transfer, and aerosol infection. (G) Experimental strategy for adoptive cotransfer of CD4+ T cells from donor WT and GM-CSF−/− Thy1.1 recipients 4 weeks after infection (at a 1:1 ratio) with M. tuberculosis infection via aerosol. (H) Origin of CD4+ T cells based on congenic markers 4 weeks after infection. (I and J) Frequency of ESAT63-17-positive (I) or Ag85b241-256 tetramer-positive (J) CD4+ T cells among total host (e.g., endogenous), WT, or KO CD4+ T cells. Statistical testing was performed by using a paired 1-way ANOVA. *, P < 0.05; **, P < 0.01; ****, P < 0.0001. Error bars indicate SEM.
FIG 5
FIG 5
GM-CSF production by human T cells. (A) Representative flow cytometric analysis results for GM-CSF and IFN-γ production by unstimulated human peripheral blood CD4+ and CD4 T cells, or after stimulation with M. tuberculosis lysate (Mtb lysate), or after treatment with PMA plus ionomycin (P + I). (B and C) The frequency of CD4+ (B) or CD4 (C) T cells producing GM-CSF only, both GM-CSF and IFN-γ, or IFN-γ only (left), or the total GM-CSF or total IFN-γ (right), from healthy controls (n = 9) or active TB patients (n = 9) stimulated with M. tuberculosis lysate. Red circles, HC; blue circles, TB patients. Lines indicate means ± standard deviations. Statistical testing was performed with a two-way ANOVA. *, P < 0.05; **, P < 0.01; ****, P < 0.0001.
FIG 6
FIG 6
GM-CSF and IFN-γ have an additive antimicrobial effect. Mycobacterial growth inhibition was performed using H37Rv-infected C57BL/6 macrophages, which were infected overnight as described elsewhere (23). CFU were measured on day 1 (macrophages [mφ] alone, baseline) and on day 5 postinfection. Recombinant GM-CSF and/or IFN-γ was added on day 1 postinfection. Error bars indicate means ± SEM. **, P < 0.01. One-way ANOVA with Dunnett’s posttest was used to compare combination treatment with individual cytokine treatment at each concentration. Data are representative of two independent experiments.
FIG 7
FIG 7
GM-CSF antimicrobial activity requires PPARγ expression in macrophages. (A) Mycobacterial growth inhibition was performed using H37Rv-infected macrophages from C57BL/6 mice (e.g., WT) (left) or PPARγfl/fl; LysM-cre mice (right). Baseline CFU were measured on day 1 in the absence of GM-CSF. Recombinant cytokines, including GM-CSF (0.01 to 10 ng/ml), were added on day 1, and bacterial growth was determined on day 5. Recombinant IFN-γ (10 U/ml) and TNF (10 ng/ml) were used as positive controls. (B) The percent CFU reduction compiled from 4 independent experiments. Error bars indicate means ± SEM. **, P < 0.01; ***, P < 0.001. One-way ANOVA with Dunnett’s posttest was used to compare day 5 untreated macrophages for the data in panel A; multiple Student’s t tests were used for the data in panel B. Data are representative of four independent experiments with three replicates each. mφ, macrophages.

Comment in

Similar articles

Cited by

References

    1. Barry CE III, Boshoff HI, Dartois V, Dick T, Ehrt S, Flynn J, Schnappinger D, Wilkinson RJ, Young D. 2009. The spectrum of latent tuberculosis: rethinking the biology and intervention strategies. Nat Rev Microbiol 7:845–855. doi: 10.1038/nrmicro2236. - DOI - PMC - PubMed
    1. Fine PE. 1995. Variation in protection by BCG: implications of and for heterologous immunity. Lancet 346:1339–1345. doi: 10.1016/S0140-6736(95)92348-9. - DOI - PubMed
    1. Mogues T, Goodrich ME, Ryan L, LaCourse R, North RJ. 2001. The relative importance of T cell subsets in immunity and immunopathology of airborne Mycobacterium tuberculosis infection in mice. J Exp Med 193:271–280. doi: 10.1084/jem.193.3.271. - DOI - PMC - PubMed
    1. Orme IM. 1987. The kinetics of emergence and loss of mediator T lymphocytes acquired in response to infection with Mycobacterium tuberculosis. J Immunol 138:293–298. - PubMed
    1. Orme IM. 1988. Characteristics and specificity of acquired immunologic memory to Mycobacterium tuberculosis infection. J Immunol 140:3589–3593. - PubMed

Publication types

MeSH terms

Substances