. 2017 Oct 24;8(5):e01593-17.
doi: 10.1128/mBio.01593-17.

Selective Proteomic Analysis of Antibiotic-Tolerant Cellular Subpopulations in Pseudomonas aeruginosa Biofilms

Affiliations

Selective Proteomic Analysis of Antibiotic-Tolerant Cellular Subpopulations in Pseudomonas aeruginosa Biofilms

Brett M Babin et al. mBio. .

Abstract

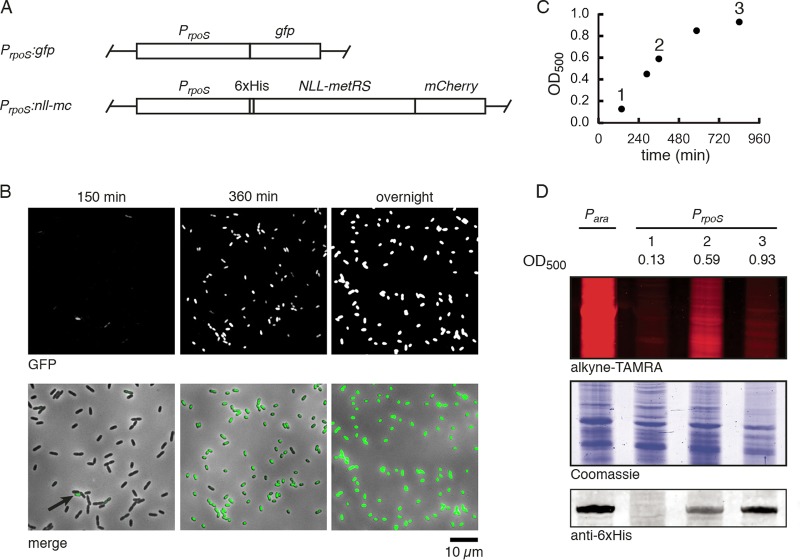
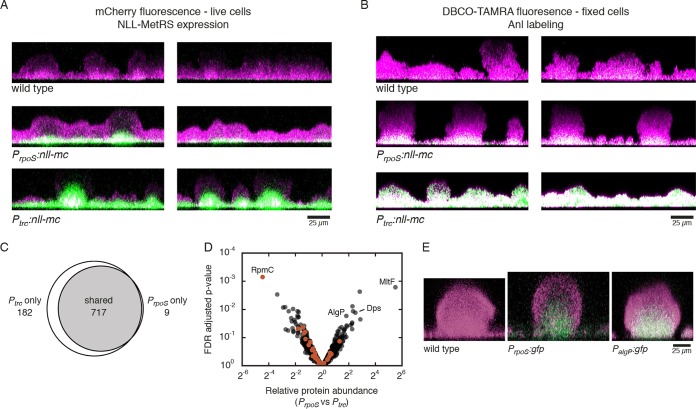
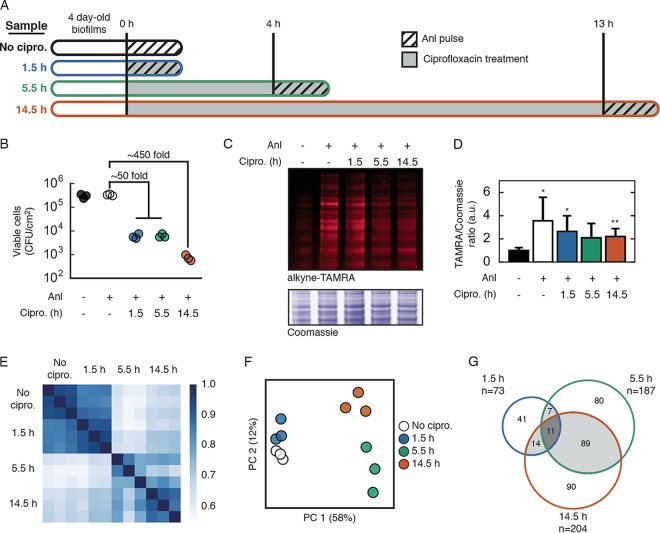
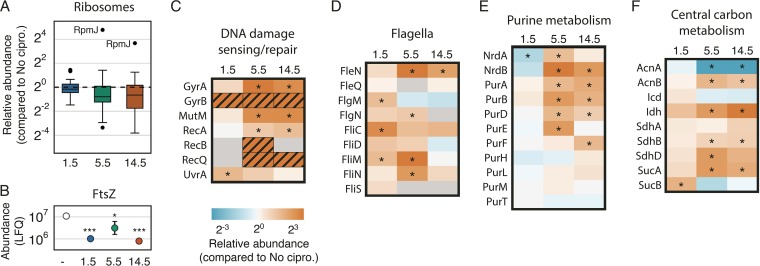
Biofilm infections exhibit high tolerance against antibiotic treatment. The study of biofilms is complicated by phenotypic heterogeneity; biofilm subpopulations differ in their metabolic activities and their responses to antibiotics. Here, we describe the use of the bio-orthogonal noncanonical amino acid tagging (BONCAT) method to enable selective proteomic analysis of a Pseudomonas aeruginosa biofilm subpopulation. Through controlled expression of a mutant methionyl-tRNA synthetase, we targeted BONCAT labeling to cells in the regions of biofilm microcolonies that showed increased tolerance to antibiotics. We enriched and identified proteins synthesized by cells in these regions. Compared to the entire biofilm proteome, the labeled subpopulation was characterized by a lower abundance of ribosomal proteins and was enriched in proteins of unknown function. We performed a pulse-labeling experiment to determine the dynamic proteomic response of the tolerant subpopulation to supra-MIC treatment with the fluoroquinolone antibiotic ciprofloxacin. The adaptive response included the upregulation of proteins required for sensing and repairing DNA damage and substantial changes in the expression of enzymes involved in central carbon metabolism. We differentiated the immediate proteomic response, characterized by an increase in flagellar motility, from the long-term adaptive strategy, which included the upregulation of purine synthesis. This targeted, selective analysis of a bacterial subpopulation demonstrates how the study of proteome dynamics can enhance our understanding of biofilm heterogeneity and antibiotic tolerance.IMPORTANCE Bacterial growth is frequently characterized by behavioral heterogeneity at the single-cell level. Heterogeneity is especially evident in the physiology of biofilms, in which distinct cellular subpopulations can respond differently to stresses, including subpopulations of pathogenic biofilms that are more tolerant to antibiotics. Global proteomic analysis affords insights into cellular physiology but cannot identify proteins expressed in a particular subpopulation of interest. Here, we report a chemical biology method to selectively label, enrich, and identify proteins expressed by cells within distinct regions of biofilm microcolonies. We used this approach to study changes in protein synthesis by the subpopulation of antibiotic-tolerant cells throughout a course of treatment. We found substantial differences between the initial response and the long-term adaptive strategy that biofilm cells use to cope with antibiotic stress. The method we describe is readily applicable to investigations of bacterial heterogeneity in diverse contexts.

Keywords: BONCAT; Pseudomonas aeruginosa; antibiotic resistance; biofilms; proteomics.


Figures

FIG 1
FIG 1
Cell-state-selective labeling using the rpoS promoter. (A) P. aeruginosa was engineered to express GFP or an NLL-MetRS–mCherry translational fusion under control of the endogenous rpoS promoter. Expression cassettes were transposed to the Tn7 chromosomal locus. (B) Representative images of GFP fluorescence of the PrpoS:gfp strain throughout growth in LB medium. GFP fluorescence (top) and a GFP–bright-field merge (bottom) are shown. The arrow indicates a GFP-positive cell at the early time point. The times after 1:200 dilution into fresh medium are indicated above the panels. (C) Optical density at 500 nm of PrpoS:nll-mc cells grown in liquid culture in minimal FAB medium. At each indicated time point, an aliquot was removed and incubated with 1 mM Anl for 15 min. (D) Lysates were treated with alkyne-TAMRA and separated via SDS-PAGE to visualize Anl incorporation. Coomassie staining of the same gel indicates equal protein loading. Lysates were probed by Western blotting for the six-histidine tag on NLL-MetRS.
FIG 2
FIG 2
Targeted proteomic analysis of a biofilm subpopulation. (A) Detection of mCherry fluorescence (green) in live biofilms was used to locate cells expressing the NLL-MetRS–mCherry fusion. Biofilms were counterstained with SYTO9 (magenta) immediately before imaging. (B) Following Anl treatment, BONCAT labeling in biofilms was visualized by treating fixed biofilms with DBCO-TAMRA (green). Biofilms were counterstained with SYTO9 (magenta). Colocalization of fluorescent signals is displayed in white. For panels A and B, cross-sections were reconstructed from confocal image stacks. (C) Proteins identified following BONCAT enrichment from PrpoS:nll-mc and Ptrc:nll-mc strains. (D) Quantification of relative protein abundances following enrichment from both strains. Ribosomal proteins are shown in orange. Proteins discussed in the text are indicated by gene name. The complete set of LFQ values, ratios, and adjusted P values is provided in Data Set S1. (E) Spatial distribution of GFP expression (green) under control of the rpoS or algP promoters in live biofilms. Biofilms were counterstained with SYTO62 (magenta).
FIG 3
FIG 3
BONCAT analysis of protein synthesis during ciprofloxacin treatment. (A) Experimental timeline of biofilm treatment and proteome labeling. Biofilms were grown in silicone rubber tubing for 4 days and then treated with 60 μg/ml ciprofloxacin (gray). Control biofilms were untreated. For each condition, biofilms were treated with Anl at the designated time point for 1.5 h (cross-hatched portion), harvested, and lysed. (B) Survival of biofilm cells following exposure to ciprofloxacin for the indicated treatment time and to 1 mM Anl as indicated. (C) Visualization of Anl incorporation in lysates treated with alkyne-TAMRA. Coomassie staining was used to verify equal protein loading. (D) Anl incorporation was quantified by dividing the TAMRA fluorescence by the Coomassie intensity for four gel regions (means + standard deviations; n = 4). Welch’s t-test results are indicated: *, P < 0.05; **, P < 0.01. (E) Spearman rank correlation coefficients for protein LFQ values, calculated among all MS runs. (F) The top two principal component weights for each MS run. The percent variance explained by each component is shown in parentheses. (G) Overlap of significantly changed or uniquely identified proteins (down- and upregulated proteins) at each time point throughout ciprofloxacin treatment.
FIG 4
FIG 4
Dynamic cellular responses to ciprofloxacin. (A) Box plots showing the distribution of ribosomal protein abundances for treated samples compared to the untreated control. Each box indicates the second and third quartiles, and whiskers indicate the rest of the distribution. Values exceeding 1.5 times the interquartile range are displayed as points. The nonessential ribosomal protein RpmJ is indicated. (B) Abundance of FtsZ in each sample (mean ± standard deviation; n = 3; FDR adjusted P values are designated: *, P < 0.05; ***, P < 0.001). (C to F) Heat maps indicating the median abundance ratio for each time point compared to the untreated control for proteins involved in DNA damage sensing and repair (C), flagellum synthesis (D), purine metabolism (E), and central carbon metabolism (F). *, P < 0.05 (FDR-adjusted P value). The color scale for abundance ratios is shown under panel C. Gray boxes indicate time points for which that protein was not quantitated. Hatched orange boxes indicate proteins that were identified for that time point (in at least two replicates) but absent from the untreated control. An example of raw abundance measurements for panel C is given in Fig. S4. The complete set of LFQ values, ratios, and adjusted P values is provided in Data Set S2.

References

    1. Fux CA, Costerton JW, Stewart PS, Stoodley P. 2005. Survival strategies of infectious biofilms. Trends Microbiol 13:34–40. doi:10.1016/j.tim.2004.11.010. - DOI - PubMed
    1. Levin BR, Rozen DE. 2006. Non-inherited antibiotic resistance. Nat Rev Microbiol 4:556–562. doi:10.1038/nrmicro1445. - DOI - PubMed
    1. Oliver A, Cantón R, Campo P, Baquero F, Blázquez J. 2000. High frequency of hypermutable Pseudomonas aeruginosa in cystic fibrosis lung infection. Science 288:1251–1254. doi:10.1126/science.288.5469.1251. - DOI - PubMed
    1. Høiby N, Bjarnsholt T, Givskov M, Molin S, Ciofu O. 2010. Antibiotic resistance of bacterial biofilms. Int J Antimicrob Agents 35:322–332. doi:10.1016/j.ijantimicag.2009.12.011. - DOI - PubMed
    1. Stewart PS, Franklin MJ. 2008. Physiological heterogeneity in biofilms. Nat Rev Microbiol 6:199–210. doi:10.1038/nrmicro1838. - DOI - PubMed

MeSH terms