. 2017 Nov 22;37(47):11455-11468.
doi: 10.1523/JNEUROSCI.1091-17.2017. Epub 2017 Oct 24.

Concerted Interneuron Activity in the Cerebellar Molecular Layer During Rhythmic Oromotor Behaviors

Affiliations

Concerted Interneuron Activity in the Cerebellar Molecular Layer During Rhythmic Oromotor Behaviors

Guadalupe Astorga et al. J Neurosci. .

Abstract

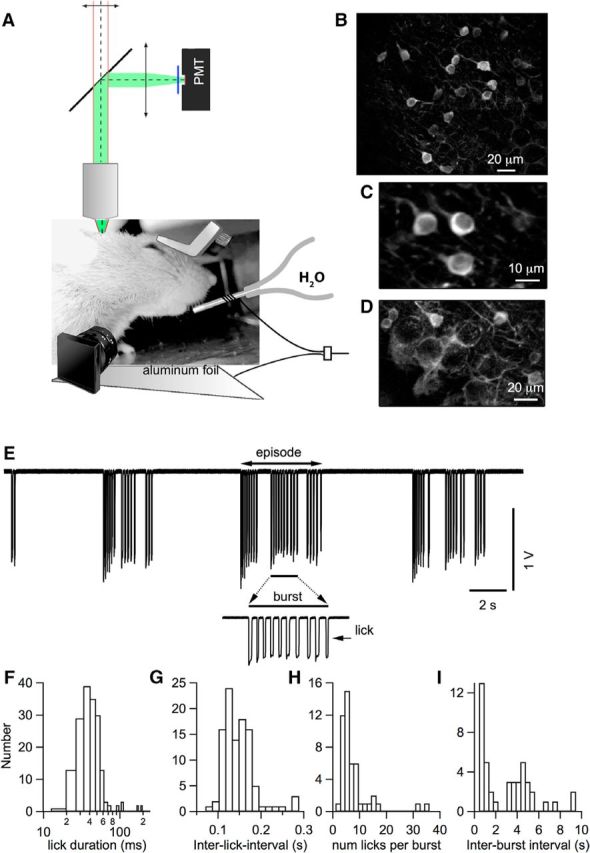
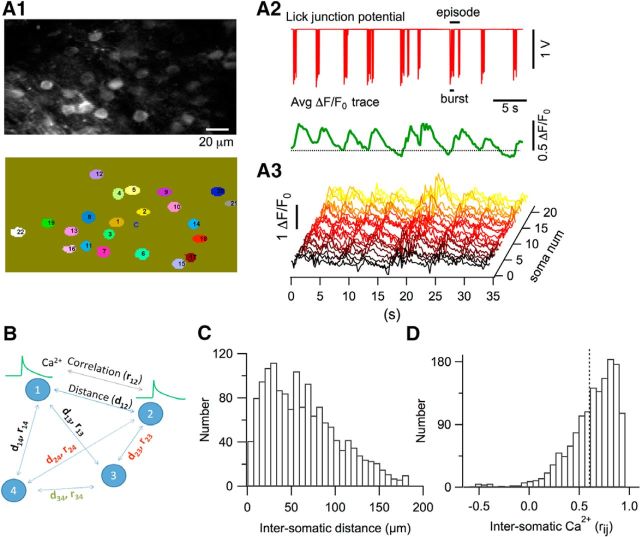
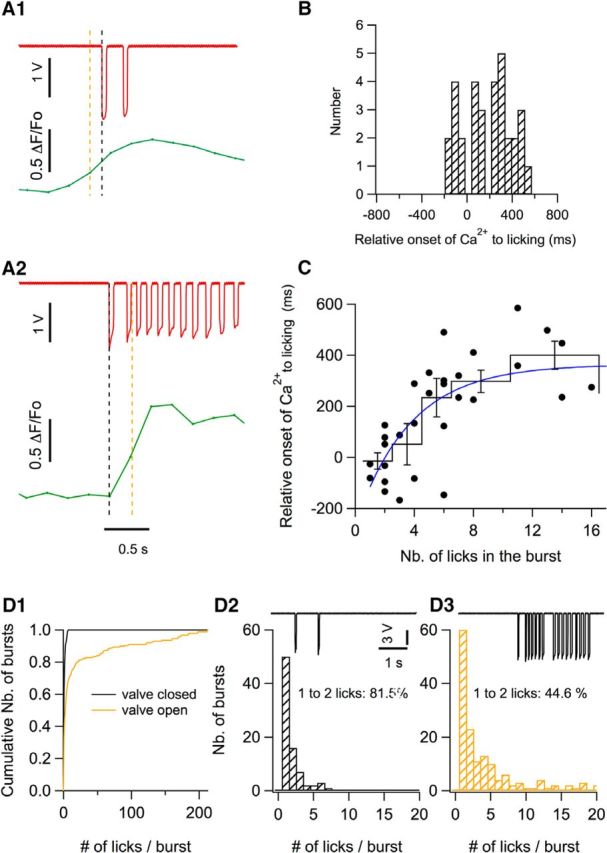
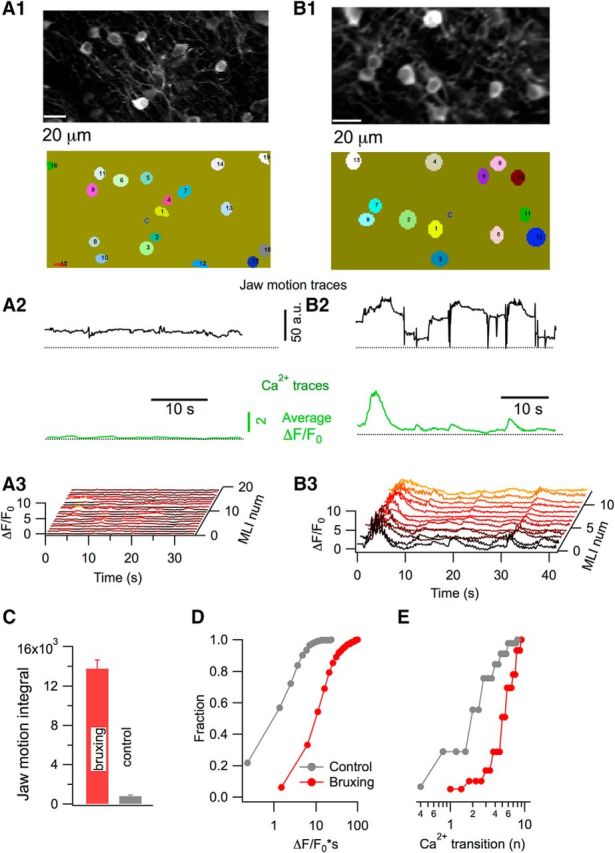
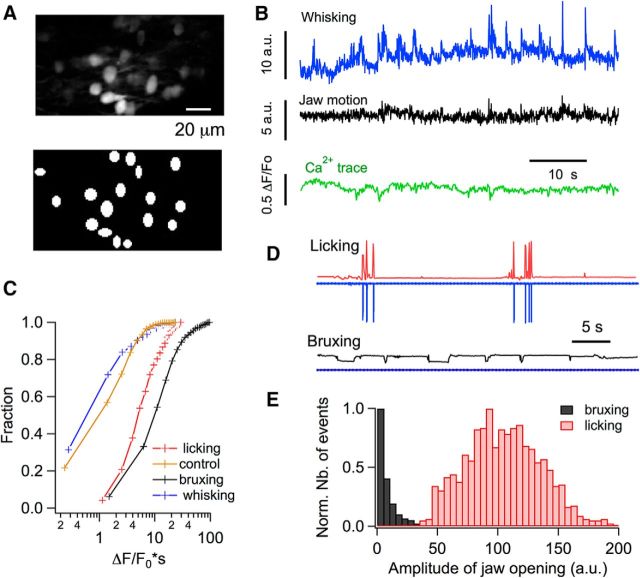
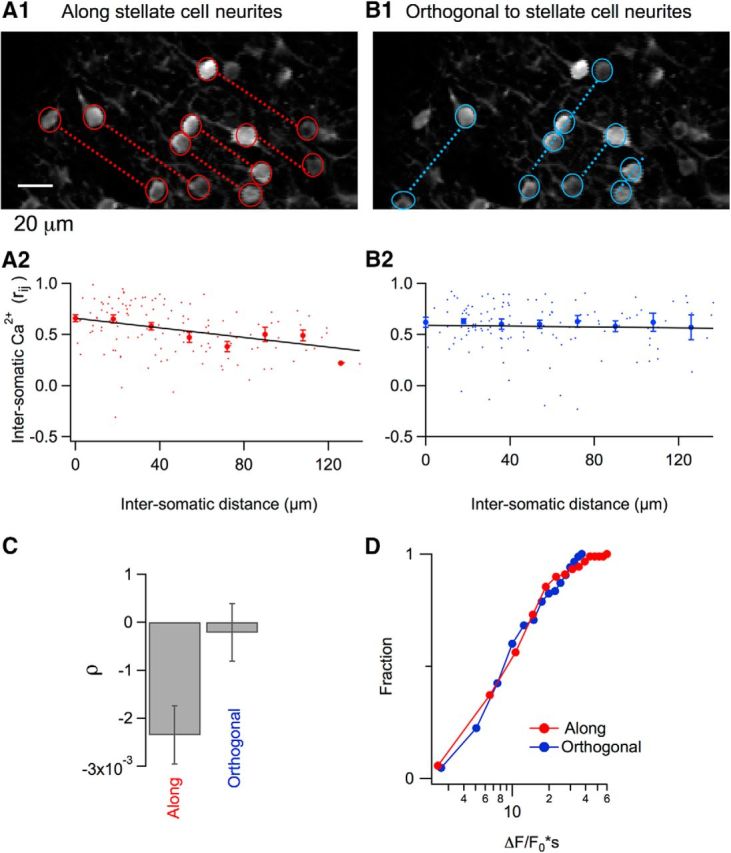
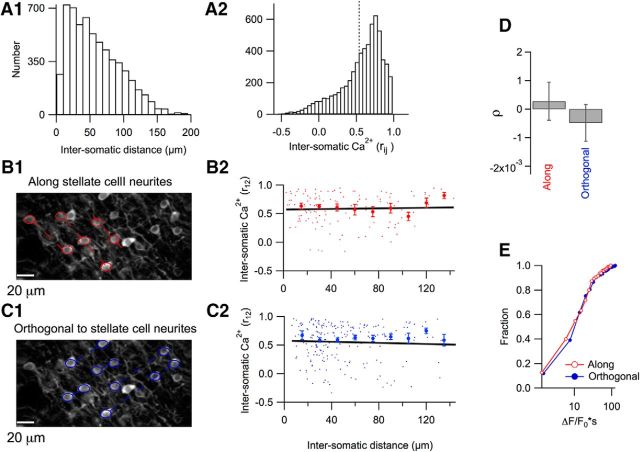
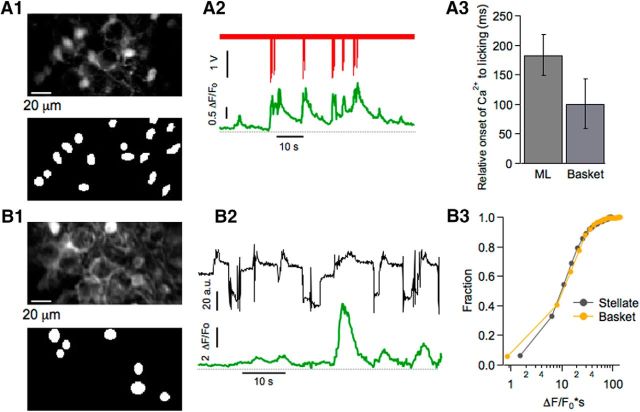
Molecular layer interneurons (MLIs, stellate and basket cells) of the cerebellar cortex are linked together by chemical and electrical synapses and exert a potent feedforward inhibition on Purkinje cells. The functional role of MLIs during specific motor tasks is uncertain. Here, we used two-photon imaging to study the patterns of activity of neighboring individual MLIs in the Crus II region of awake female mice during two types of oromotor activity, licking and bruxing, using specific expression of the genetically encoded calcium indicator protein GCaMP6s. We found that both stellate and basket cells engaged in synchronized waves of calcium activity during licking and bruxing, with high degrees of correlation among the signals collected in individual MLIs. In contrast, no calcium activity was observed during whisking. MLI activity tended to lag behind the onset of sustained licking episodes, indicating a regulatory action of MLIs during licking. Furthermore, during licking, stellate cell activity was anisotropic: the coordination was constant along the direction of parallel fibers (PFs), but fell off with distance along the orthogonal direction. These results suggest a PF drive for Ca2+ signals during licking. In contrast, during bruxing, MLI activity was neither clearly organized spatially nor temporally correlated with oromotor activity. In conclusion, MLI activity exhibits a high degree of correlation both in licking and in bruxing, but spatiotemporal patterns of activity display significant differences for the two types of behavior.SIGNIFICANCE STATEMENT It is known that, during movement, the activity of molecular layer interneurons (MLIs) of the cerebellar cortex is enhanced. However, MLI-MLI interactions are complex because they depend both from excitatory electrical synapses and from potentially inhibitory chemical synapses. Accordingly, the pattern of MLI activity during movement has been unclear. Here, during two oromotor tasks, licking and bruxism, individual neighboring MLIs displayed highly coordinated activity, showing that the positive influences binding MLIs together are predominant. We further find that spatiotemporal patterns differ between licking and bruxing, suggesting that the precise pattern of MLI activity depends on the nature of the motor task.

Keywords: behaving mice; cerebellum; inhibition; interneurons; two-photon imaging.


Figures

Figure 1.
Figure 1.
Chronic window imaging of the cerebellar cortex in mice performing rhythmic licking. A, Experimental setup for two-photon laser-scanning Ca2+ imaging in head-fixed awake mice. Mice were head-fixed with a chronically implanted custom-made titanium piece, as depicted in the image. All experiments were performed in Crus II. Water was delivered through a metal tube with a copper cable soldered around it. This cable was connected to an A/D converter. Mice were in direct contact with an aluminum-covered platform that was connected to the ground of the A/D converter. Each lick closed an electrical circuit and was recorded as the junction potential between the metal tube and water. An infrared sensitive video camera was used to record orofacial behaviors. B, Representative image from the molecular layer showing GCaMP6s expressing interneurons in a PV-Cre mouse (see Materials and Methods). C, Average image of a smaller field in the molecular layer showing three stellate cells expressing GCaMP6s. D, z-projection of 15 images at 1.5 μm steps in the vicinity of the PC layer. PCs do not express GCaMP6s and their dark somata are surrounded by basket cell axons. E, Representative licking signals recorded when the mouse tongue touched the water. A single licking event is reflected by a pulse of potential change. A portion of the licking trace above the bar is enlarged to show a licking burst. F, Distribution of individual lick duration, with a mean ± SEM of 48.2 ± 3.1 ms (n = 284). G, Distribution of the ILIs, with a mean of 138.0 ± 3.7 ms (n = 103). Values were derived from licking events within single bursts, where a burst is defined as a temporal block comprising consecutive licks with ILIs <0.5 s. H, Distribution of the numbers of lick events within a single burst, with a mean of 6.7 ± 0.9 (n = 48). I, Distribution of the interburst intervals, with a median of 2.9 ± 0.3 s (n = 44). Data were pooled from 13 recordings in n = 4 mice.
Figure 2.
Figure 2.
Ca2+ transients in GCAMP6s-expressing stellate cells during rhythmic licking. A1, Top, Average two-photon image of the molecular layer during a licking session. Bottom, Ovals with numbers identify single stellate cell somata, which were traced with ImageJ software and then automatically scrutinized and numbered with MATLAB routines. A2, Top, Electrical signal generated by licking episodes. Bottom, Average of the time-dependent ΔF/F0 traces for the 21 stellate cells outlined in A1. The dotted line marks the zero ΔF/F0 level. A3, Corresponding waterfall plot for individual stellate cells. B, Schematics for the calculation of rij between Ca2+ responses of all combined neuron pairs and the corresponding dij. C, Histogram distribution of the distances of stellate cell pairs. D, Histogram distribution of all soma-to-soma correlations in Ca2+ responses. The dotted line marks the mean value. A total of 1494 combined neuronal pairs were analyzed in 14 imaging runs from n = 4 mice.
Figure 3.
Figure 3.
Temporal correlation between licking behavior and Ca2+ rises. A1, A2, Two examples of lick bursts (red) and of the corresponding averaged ΔF/F0 traces (green) illustrate the analysis done to determine the relative onset of the Ca2+ signal with respect to the licking trace. The black dotted line marks the onset time for licking, determined as the first data point that deviates from the baseline by >3 times the SD. The green trace shows the Ca2+ signal corresponding to a time window ranging from −1 s to 1.5 s with respect to licking onset. The Ca2+ onset time (orange dotted line) was determined as the first data point deviating by >3 times the SD from the Ca2+ trace baseline. In one case, the Ca2+ trace precedes licking onset (A1) and, in the other example, the Ca2+ trace lags after licking onset (A2). B, Distribution of the relative onset of the Ca2+ traces versus the licking traces, with a mean value of 183.6 ± 37.4 ms (n = 32 bursts from 8 imaging sections, n = 5 animals). C, Relationship between the Ca2+ onset time and the number of licks in the burst. The black circles show individual data points; the continuous black profile shows means ± SEM of binned data; blue curve shows the fit of the data points by an exponential function with a lick number parameter value of 3.7 licks and a saturation at 364 ms. D, Comparison of the distribution of number of licks per burst when a valve controlling water delivery is closed (black cumulative histogram in D1; corresponding expanded histogram in D2) and when the valve is open (yellow plot in D1; corresponding histogram in D3). The traces in D2 and D3 show examples of licking recording when the valve is closed (D2) or open (D3). The histograms correspond to data pooled from 9 licking sessions from n = 3 mice.
Figure 4.
Figure 4.
Stellate cells Ca2+ signals during bruxing. A1, B1, GCAMP6-expressing stellate cells imaged by two- photon microscopy (top) and the ROIs used for analysis (bottom). A2, B2, Representative traces for jaw motion (black) and Ca2+ (green) for periods of low and high jaw motility. Jaw motility traces were extracted from infrared video imaging and the Ca2+ corresponds to the average of 19 individual stellate cells in A2 and 13 in B2. A3, B3, Corresponding waterfall plots for individual stellate cells. C, Comparison of the jaw motion integral in periods of high and low motility shows a marked difference between the two groups (t = 10.2; p < 0.0001). D, Ca2+ strength is significantly higher for periods of high motility than during low-motility sessions (t = 13.4; p < 0.0001). E, Difference between the two conditions is also highly significant when the number of Ca2+ transitions is compared (t = 7.3; p < 0.0001). Data for CE are from three mice, 788 stellate cells from 50 imaging runs during high-motility periods, and 364 stellate cells from 27 imaging runs during low-motility periods.
Figure 5.
Figure 5.
Stellate cells Ca2+ signals are absent during whisking. A, Two-photon images of GCAMP6-expressing stellate cells (top) and the ROIs used for analysis (bottom). B, Representative traces for whisker movement (blue), jaw motion (black), and Ca2+ (green) during a period of low jaw motility and active whisking. Jaw motility and whisking traces were extracted from infrared video imaging as detailed in the Materials and Methods and the Ca2+ corresponds to the average of 16 stellate cells. C, Ca2+ strength is significantly lower for whisking than for either bruxing (t = 7.6, p < 0.0001) or licking (t = 8.1, p < 0.0001), whereas bruxing periods have a significantly higher Ca2+ strength than licking episodes (t = 5.3, p < 0.0001). The data were pooled from 788 stellate cells from 50 imaging runs, n = 3 mice for bruxing episodes; 188 stellate cells from 15 imaging runs, n = 4 mice for licking episodes; and 124 stellate cells from 11 imaging runs, n = 4 mice for whisking episodes. The control trace depicts the data for low jaw motility runs, as in Figure 4D. D, Examples of jaw motility and licking signals for a recording session in which the mouse performed rhythmic licking (top) and for a different session for the same mouse during bruxing (bottom). The electrical signals for licking are shown in blue. Note that the signal is flat for the bruxing episode. The corresponding jaw motility traces are shown in red (licking; note the temporal correspondence with the electrical licking trace) and black (bruxing). Vertical scales are the same for top and bottom. E, Comparison of the amplitude distributions of the jaw movement during licking and bruxing. Data were pooled form 7 recording sessions (n = 4 mice). The jaw movement amplitude was quantified by calculating the difference between the maximum and minimum gray values inside a ROI drawn in the inferior part of the jaw, as detailed in the Materials and Methods.
Figure 6.
Figure 6.
Spatial dependence of somatic Ca2+ correlations during licking. A1, Two-photon image in which individual stellate cell somata are marked with red circles and dotted lines join somata oriented along the axis of stellate cell neurites. A2, Red dots show individual rij values plotted against soma-to-soma distances. Red filled circles correspond to the mean ± SEM for 18 μm bins running over the whole range of distances. The black line shows the fit of the data by a linear function that yields a significant negative correlation with a slope of −0.0023 ± 0.0006 (t = 3.8, p < 0.001; 130 stellate cell pairs from 13 imaging runs, n = 4 mice). B1, B2, Similar analysis of the same data pool for stellate cells oriented orthogonally to the neurites. In this case, the fit of the data by a linear regression yields a slope value of −0.0002 ± 0.0006 (t = 0.36, p > 0.5; 125 stellate cell pairs from 15 imaging runs, n = 4 mice), indicating that there is no significant dependence of the correlation on distance. C, Pooled results for the dependence of correlation of the Ca2+ responses on the distance for the two orientations. D, No difference was found for the Ca2+ signal integral when stellate cells were compared in the two orientations (t = 0.49; p > 0.5; 85 and 81 stellate cells from 13 and15 imaging runs, respectively; n = 4 mice).
Figure 7.
Figure 7.
Spatial correlation analysis for stellate cells Ca2+ activities during bruxing. A1, Histogram distribution of the distances of all combined stellate cell pairs studied during bruxing. A2, Histogram distribution of all soma-to-soma correlations in Ca2+ responses (6118 pairs from 50 imaging runs, n = 3 mice). The dotted line marks the mean value. B1, Two-photon image with individual stellate cell somata marked by red circles and dotted lines joining somata oriented along the axis of the stellate cell neurites. B2, Red dots show individual rij values plotted against soma-to-soma distances. Red filled circles indicate mean ± SEM as in Figure 6. The fit of the data by a linear function (black line) indicates no dependence of the rij values on distance (slope = 0.0002 ± 0.006; p > 0.05; n = 129 stellate cell pairs from 25 imaging runs, n = 2 mice). C1, C2, Similar analysis of the same data for stellate cells oriented orthogonal to the neurites. The linear regression yields a slope of −0.0004 ± 0.0006 (p > 0.05; 224 pairs from 25 imaging runs). D, Pooled results showing a lack of correlation of Ca2+ responses on distance for the two orientations. E, No difference was found between the stellate cells along and orthogonal to the neurites axis in terms of the Ca2+ signal integral (t = 0.7; p = 0.5).
Figure 8.
Figure 8.
Ca2+ signals in basket cell during licking and bruxing. A1, B1, Two-photon images at the depth of the PC layer showing GCAMP6-expressing basket neurons (top) and ROIs used for analysis (bottom). Note the prominent basket-like structure surrounding the PC soma. A2, Representative example of a licking episode (red trace) and the Ca2+ signal averaged from 16 basket cells (green trace). A3, Mean values for the delay of Ca2+ onset relative to licking do not differ significantly (t = 1.11; p > 0.2) between stellate cells (mean: 183.6 ± 37.4 ms; 32 bursts, 8 imaging runs, n = 5 mice) and basket cells (mean: 100.9 ± 42 ms; 10 bursts from 5 imaging runs, n = 4 mice). B2, Representative example of jaw motility (black trace) and the corresponding Ca2+ signal (green trace) averaged from seven basket cells. B3, Ca2+ strength during periods of high jaw motility is similar (t = 0.7; p = 0.5) for stellate cells (788 cells from 50 imaging runs, n = 3 mice) and basket cells (480 cells from 43 imaging runs, n = 4 mice).

References

    1. Alcami P, Marty A (2013) Estimating functional connectivity in an electrically coupled interneuron network. Proc Natl Acad Sci U S A 110:E4798–E4807. 10.1073/pnas.1310983110 - DOI - PMC - PubMed
    1. Astorga G, Bao J, Marty A, Augustine GJ, Franconville R, Jalil A, Bradley J, Llano I (2015) An excitatory GABA loop operating in vivo. Front Cell Neurosci 9:275. 10.3389/fncel.2015.00275 - DOI - PMC - PubMed
    1. Bao J, Reim K, Sakaba T (2010) Target-dependent feedforward inhibition mediated by short-term synaptic plasticity in the cerebellum. J Neurosci 30:8171–8179. 10.1523/JNEUROSCI.0276-10.2010 - DOI - PMC - PubMed
    1. Blot A, de Solages C, Ostojic S, Szapiro G, Hakim V, Léna C (2016) Time-invariant feed-forward inhibition of Purkinje cells in the cerebellar cortex in vivo. J Physiol 594:2729–2749. 10.1113/JP271518 - DOI - PMC - PubMed
    1. Bosman LW, Koekkoek SK, Shapiro J, Rijken BF, Zandstra F, van der Ende B, Owens CB, Potters JW, de Gruijl JR, Ruigrok TJ, De Zeeuw CI (2010) Encoding of whisker input by cerebellar Purkinje cells. J Physiol 588:3757–3783. 10.1113/jphysiol.2010.195180 - DOI - PMC - PubMed

Publication types

LinkOut - more resources