Comparative Study
. 2017 Dec;27(12):2025-2039.
doi: 10.1101/gr.215129.116. Epub 2017 Oct 24.

A novel approach for data integration and disease subtyping

Affiliations
Comparative Study

A novel approach for data integration and disease subtyping

Tin Nguyen et al. Genome Res. 2017 Dec.

Abstract

Advances in high-throughput technologies allow for measurements of many types of omics data, yet the meaningful integration of several different data types remains a significant challenge. Another important and difficult problem is the discovery of molecular disease subtypes characterized by relevant clinical differences, such as survival. Here we present a novel approach, called perturbation clustering for data integration and disease subtyping (PINS), which is able to address both challenges. The framework has been validated on thousands of cancer samples, using gene expression, DNA methylation, noncoding microRNA, and copy number variation data available from the Gene Expression Omnibus, the Broad Institute, The Cancer Genome Atlas (TCGA), and the European Genome-Phenome Archive. This simultaneous subtyping approach accurately identifies known cancer subtypes and novel subgroups of patients with significantly different survival profiles. The results were obtained from genome-scale molecular data without any other type of prior knowledge. The approach is sufficiently general to replace existing unsupervised clustering approaches outside the scope of bio-medical research, with the additional ability to integrate multiple types of data.


Figures

Figure 1.
Figure 1.
The PINS algorithm applied on a single data type, using the simulated data named Dataset3. (A) The data set consists of 100 patients and three subtypes, each having a different set of 100 differentially expressed genes. The numbers of patients in each subtype are 33, 33, and 34, respectively. (BE) Original connectivity matrix (top), perturbed connectivity matrix (middle), and CDF of the difference matrix (bottom) for k = 2, 3, 4, and 5, respectively. (F) CDF of the difference matrix (CDF-DM) for k ∈ [2..10]. (G) AUC values for Dataset3 (red curve), random data (black curve), and the difference (blue) between the two curves.
Figure 2.
Figure 2.
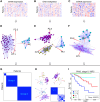
Data integration and disease subtyping illustrated on the kidney renal clear cell carcinoma (KIRC) data set. (AC) The input consists of three matrices that have the same set of patients but different sets of measurements. (DF) The optimal connectivity between the samples for each data type. (G) The similarity between patients that are consistent across all data types. Partitioning this matrix results in three groups of patients. (H) Group 1 is further split into two subgroups in stage II. (I) Kaplan-Meier survival curves of four subtypes after stage II splitting of group 1. The survival analysis indicates that the four groups discovered after stage II have significantly different survival profiles (Cox P-value 0.00013).
Figure 3.
Figure 3.
Kaplan-Meier survival analysis for glioblastoma multiforme (A) and acute myeloid leukemia (B). The horizontal axes represent the time passed after entry into the study, while the vertical axes represent estimated survival percentage.
Figure 4.
Figure 4.
Number of patients in each group for each mutated gene for GBM (A) and LAML (B). The horizontal axes represent the count in short-term survival group, while the vertical axes show the count for long-term survival group(s). Interesting genes/variants will appear in the lower right or upper left corners. (A) There are nine patients in group “1-1” that have a mutation in IDH1, while there is no patient in group 2 reported to have any mutation in this gene. Furthermore, all patients in group 1 share exactly the same mutation, rs121913500 (in dbSNP), which is a T replacing a C on Chromosome 2. (B) Mutations in TP53 are associated with short-term survival in LAML.

References

    1. Alizadeh AA, Eisen MB, Davis RE, Ma C, Lossos IS, Rosenwald A, Boldrick JC, Sabet H, Tran T, Yu X, et al. 2000. Distinct types of diffuse large B-cell lymphoma identified by gene expression profiling. Nature 403: 503–511. - PubMed
    1. Amelio I, Cutruzzola F, Antonov A, Agostini M, Melino G. 2014. Serine and glycine metabolism in cancer. Trends Biochem Sci 39: 191–198. - PMC - PubMed
    1. The American Cancer Society. 2014. How is acute myeloid leukemia classified? http://www.cancer.org/cancer/leukemia-acutemyeloidaml/detailedguide/leuk....
    1. Bellman R. 1957. Dynamic programming. Princeton University Press, Princeton, NJ.
    1. Ben-Dor A, Shamir R, Yakhini Z. 1999. Clustering gene expression patterns. J Comput Biol 6: 281–297. - PubMed

Publication types

LinkOut - more resources