. 2017 Dec 22;292(51):21035-21046.
doi: 10.1074/jbc.M117.815589. Epub 2017 Oct 24.

Reconciling contradictory findings: Glucose transporter 1 (GLUT1) functions as an oligomer of allosteric, alternating access transporters

Affiliations

Reconciling contradictory findings: Glucose transporter 1 (GLUT1) functions as an oligomer of allosteric, alternating access transporters

Kenneth P Lloyd et al. J Biol Chem. .

Abstract

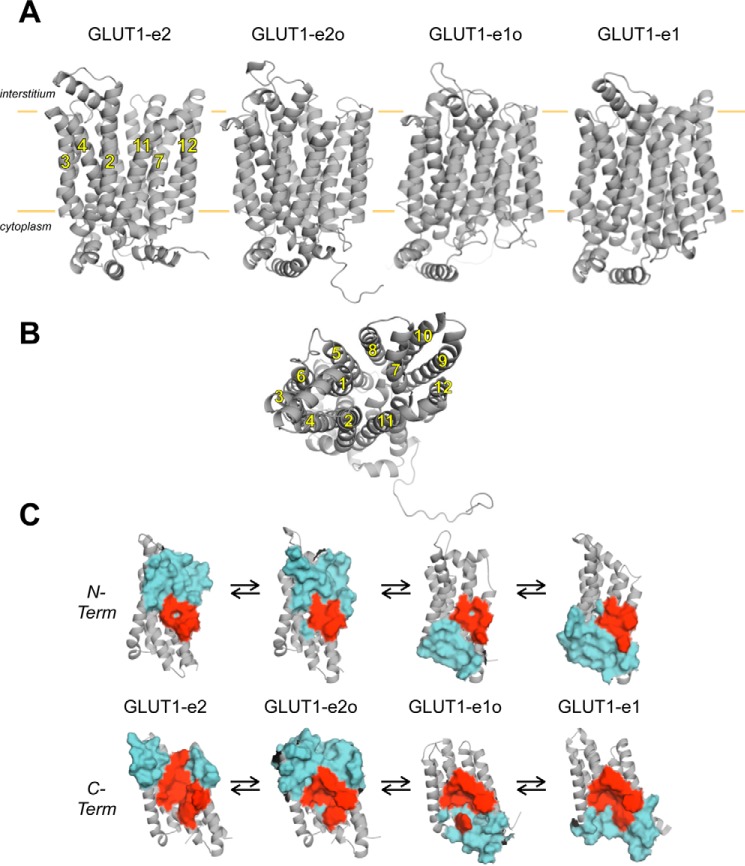
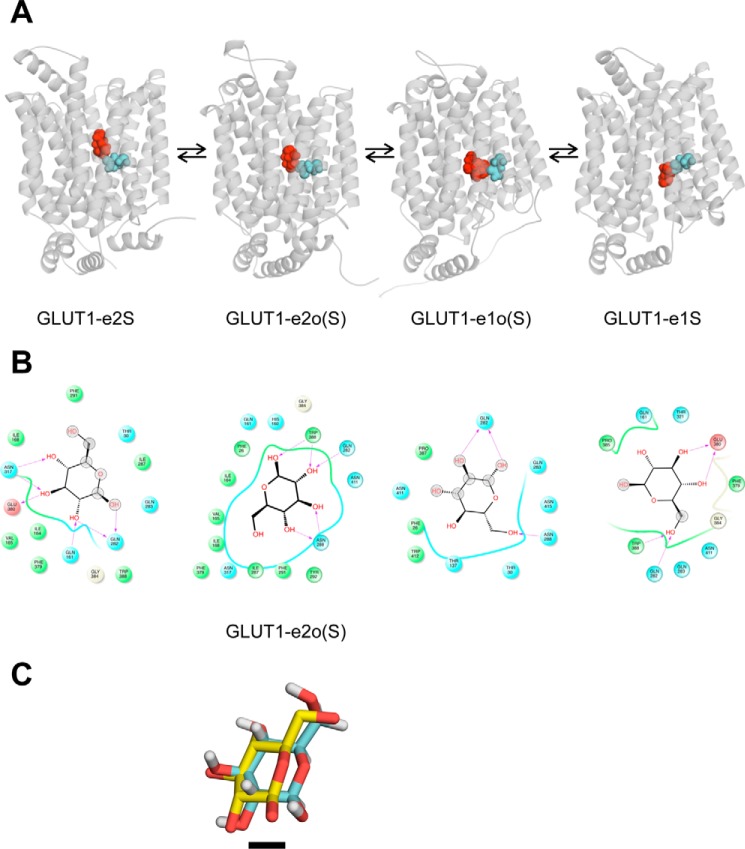
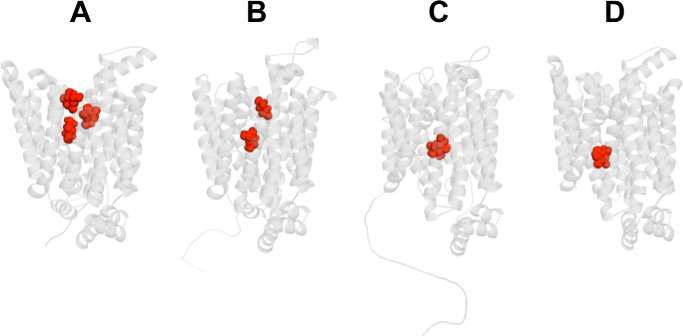
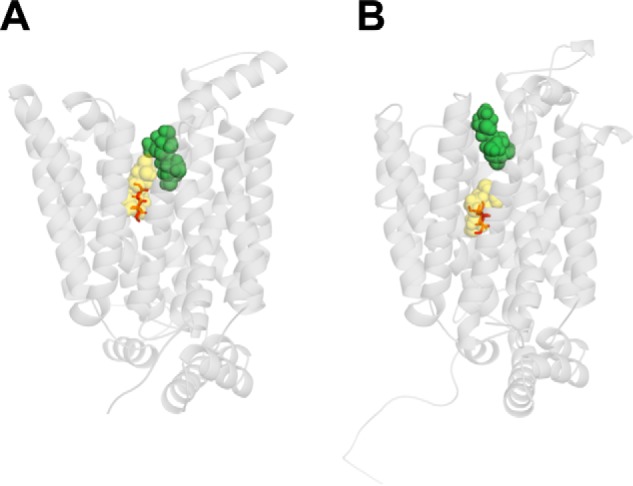
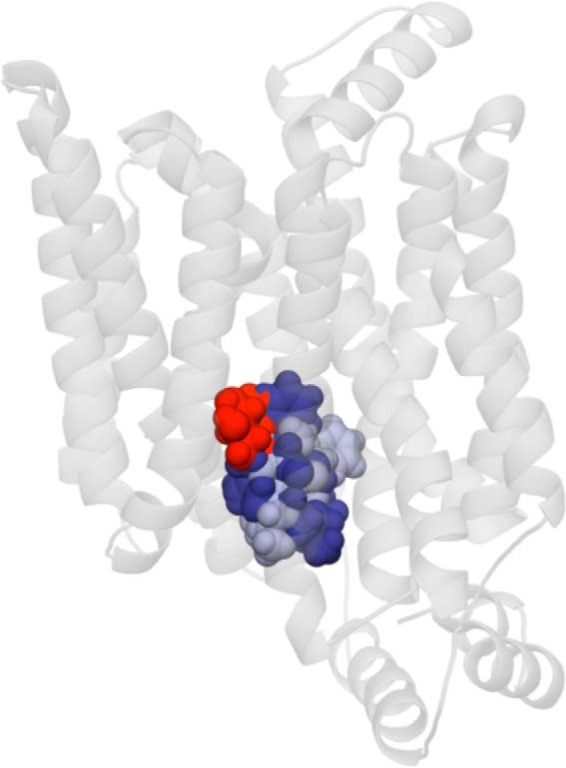
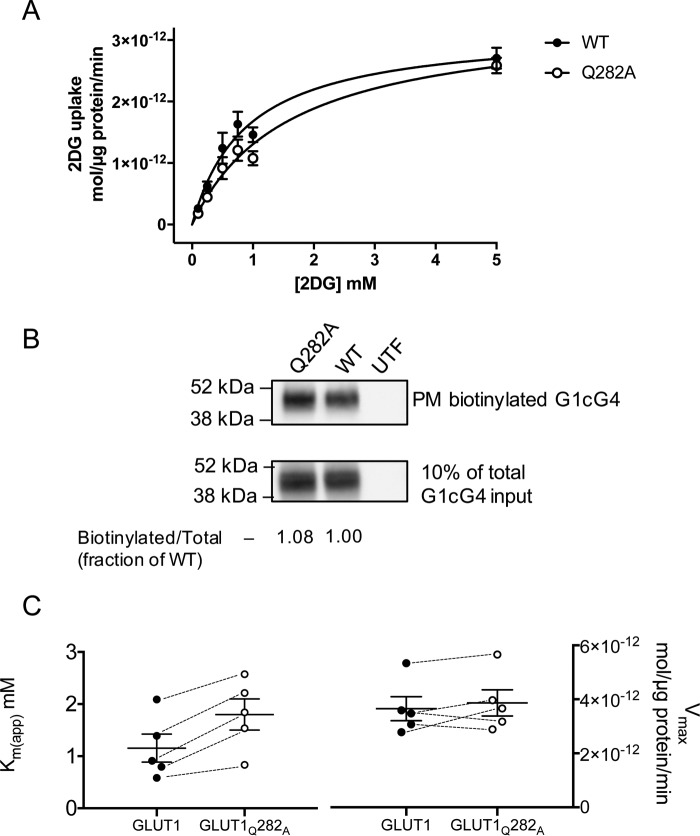
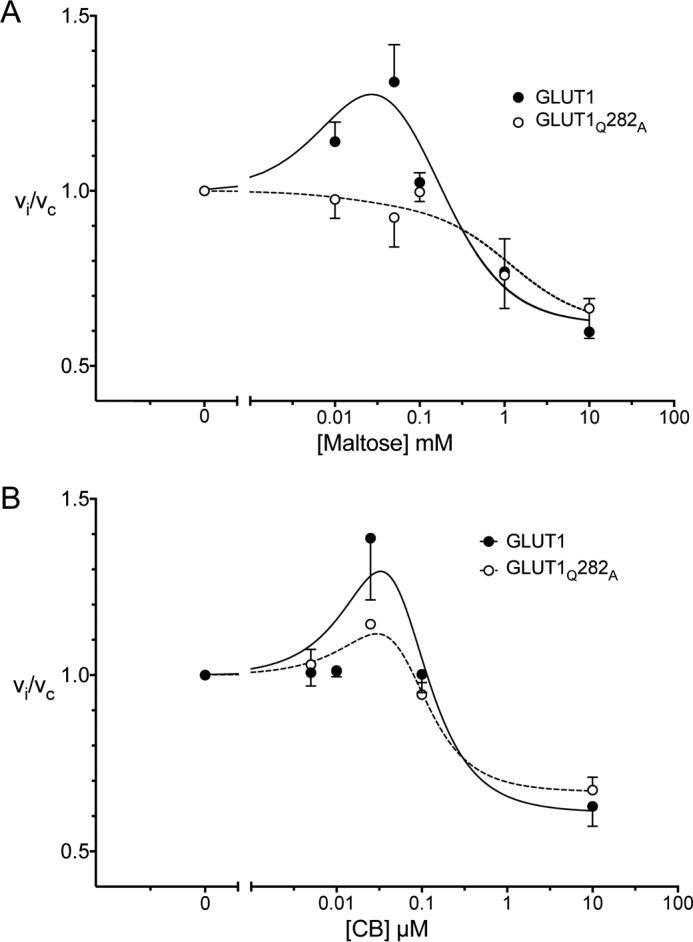
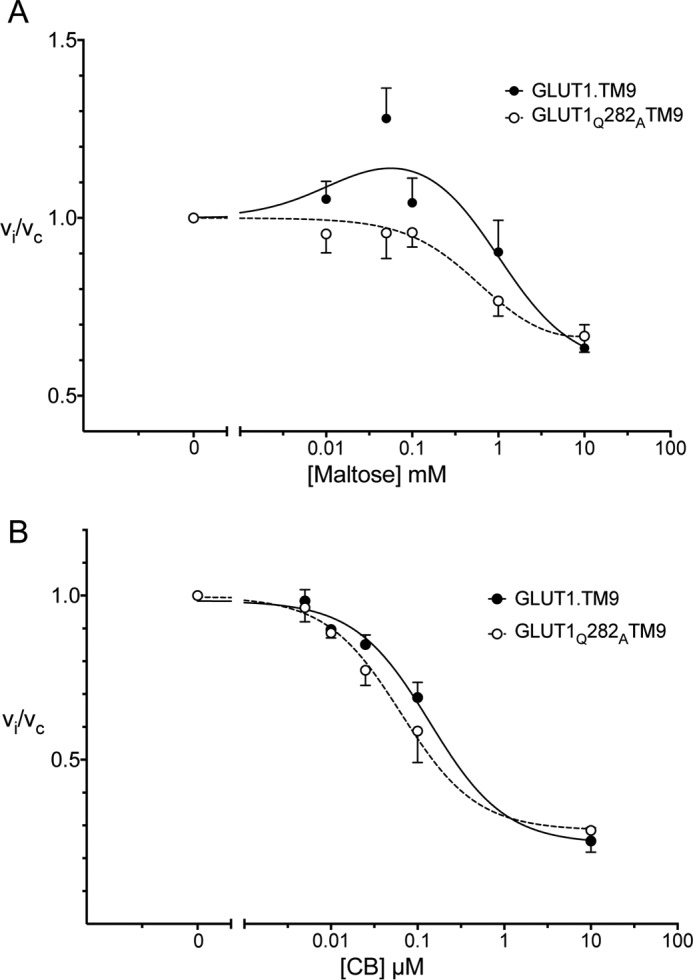
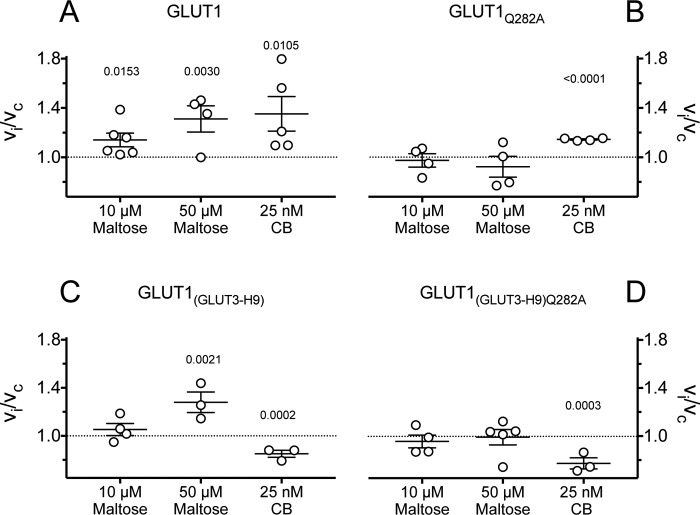
Recent structural studies suggest that GLUT1 (glucose transporter 1)-mediated sugar transport is mediated by an alternating access transporter that successively presents exofacial (e2) and endofacial (e1) substrate-binding sites. Transport studies, however, indicate multiple, interacting (allosteric), and co-existent, exo- and endofacial GLUT1 ligand-binding sites. The present study asks whether these contradictory conclusions result from systematic analytical error or reveal a more fundamental relationship between transporter structure and function. Here, homology modeling supported the alternating access transporter model for sugar transport by confirming at least four GLUT1 conformations, the so-called outward, outward-occluded, inward-occluded, and inward GLUT1 conformations. Results from docking analysis suggested that outward and outward-occluded conformations present multiple β-d-glucose and maltose interaction sites, whereas inward-occluded and inward conformations present only a single β-d-glucose interaction site. Gln-282 contributed to sugar binding in all GLUT1 conformations via hydrogen bonding. Mutating Gln-282 to alanine (Q282A) doubled the Km(app) for 2-deoxy-d-glucose uptake and eliminated cis-allostery (stimulation of sugar uptake by subsaturating extracellular maltose) but not trans-allostery (uptake stimulation by subsaturating cytochalasin B). cis-Allostery persisted, but trans-allostery was lost in an oligomerization-deficient GLUT1 variant in which we substituted membrane helix 9 with the equivalent GLUT3 sequence. Moreover, Q282A eliminated cis-allostery in the oligomerization variant. These findings reconcile contradictory conclusions from structural and transport studies by suggesting that GLUT1 is an oligomer of allosteric, alternating access transporters in which 1) cis-allostery is mediated by intrasubunit interactions and 2) trans-allostery requires intersubunit interactions.

Keywords: allosteric regulation; glucose transport; membrane transport; oligomerization; structure-function.


Conflict of interest statement

The authors declare that they have no conflicts of interest with the contents of this article

Figures

Figure 1.
Figure 1.
Homology-modeled GLUT1 conformations. A, GLUT1 is shown in cartoon representation normal to the bilayer plane (horizontal orange lines). Membrane spanning α-helices (2, 3, 4, 7, 11, and 12) are indicated, and the locations of the interstitium and cytoplasm are highlighted. Four conformations are depicted: exofacial (GLUT1-e2), exofacial-occluded (GLUT1-e2o), endofacial-occluded (GLUT1-e1o), and endofacial (GLUT1-e1). B, a second depiction of GLUT1-e1 is shown along the bilayer normal from the cytoplasmic side. Membrane spanning α-helices (noted by numbers 1–12) are indicated. C, representation of ligand-interaction cavities present in all four GLUT1 conformations shown normal to the bilayer plane. N- (N-Term) and C-terminal (C-Term) halves (helices 1–6 and 7–12, respectively, shown in gray in cartoon representation) of each conformation are indicated. Solvent-exposed residues in the ligand interaction cavities of each conformation are shown as surface maps colored cyan. Residues common to all four cavities are shown as surface maps colored red and include: N-terminal residues Gly-26 and Thr-30 (of helix 1) and Gln-161, Ile-164, Val-165, and Ile-168 (of helix 5) and C-terminal residues Gln-282, Gln-283, Ile-287, Asn-288, Phe-291, and Tyr-292 (of helix 7); Asn-317 (of helix 8); Phe-379 and Trp-388 (of helix 10); and Asn-411, Trp-412, and Asn415 (of helix 11).
Figure 2.
Figure 2.
β-d-Glc docking to homology-modeled GLUT1 conformations. A, each GLUT1 conformation is shown complexed with β-d-Glc (shown in red as a space-filling representation). The location of GLUT1 Gln-282 is shown in cyan in space-filling format. Conformation nomenclature is indicated beneath each structure where β-d-Glc is represented by the letter S, and occluded β-d-Glc (by convention) is represented by the letter S in parentheses. B, β-d-Glc docking to GLUT1 conformations in which Glc is shown as a 2D structure, coordinating GLUT1 residues are shown as circles and are colored according to their properties: green, hydrophobic, cyan, polar; red, negative. The GLUT1 backbone is shown as ribbons, solvent-exposed regions of β-d-Glc are indicated by gray-shaded circles, and H-bonds shared between amino acid side chain amines, carbonyls, or hydroxyls with β-d-Glc and their directionality are represented as red arrows. C, alignment of XylE-e2o containing a co-crystallized β-d-Glc (Protein Data Bank code 4GBZ (7); XyleE with homology-modeled GLUT1-e2o containing its docked β-d-Glc (GLUT1-e2o(S)). Both proteins are hidden to show the proximity of co-crystallized and docked sugars. XylE-bound β-d-Glc lacks hydrogens, and its carbons are colored yellow. GLUT1-bound β-d-Glc carbons are colored cyan. The black scale bar indicates the length of a single C–C bond (0.154 Å).
Figure 3.
Figure 3.
GLUT1 presents additional β-d-Glc binding sites. GLUT1 is oriented as in Fig. 1A. A, β-d-Glc (in red) docking to GLUT1-e2 reveals three potential sites termed peripheral, intermediate, and core. Computed glide scores (GSs) for ligand binding are as follows: peripheral GS = −5.1 kcal/mol, intermediate GS = −5.1 kcal/mol, core GS = −4.9 kcal/mol. B, β-d-Glc (in red) docking to GLUT1-e2o reveals two potential sites termed peripheral and core. Computed GSs for ligand binding are as follows: peripheral GS = −6.0 kcal/mol, core GS = −5.8 kcal/mol. C, β-d-Glc (in red) docking to GLUT1-e1o reveals one potential site with computed GS for ligand binding = −5.1 kcal/mol. D, β-d-Glc (in red) docking to GLUT1-e1. Computed GSs for ligand binding are as follows: core 1 GS = −5.4 kcal/mol.
Figure 4.
Figure 4.
Maltose binding to the exofacial conformation of GLUT1. GLUT1 is oriented as in Fig. 1A. A, β-maltose binding. Maltose (a disaccharide comprising two glucose units joined with an α(1→4) bond) can occupy two sites in GLUT1-e2: a site (shown in yellow) comprising the core β-d-Glc site and extending into additional space or a site (shown in green) comprising intermediate and peripheral β-d-Glc sites. β-d-Glc is indicated as a stick figure occupying its core site. Glide scores for maltose-binding core and intermediate sites are −6.1 and −5.6 kcal/mol, respectively. B, maltose occupies two sites in GLUT1-e2o comprising core (yellow) and peripheral (green) sites. Glide scores for maltose binding at core and peripheral sites are −3.4 and −5.0 kcal/mol, respectively. β-d-Glc is indicated as a stick figure occupying the core site.
Figure 5.
Figure 5.
CB interaction sites in GLUT1-e1. GLUT1 is oriented as in Fig. 1A. CB adopts two overlapping coordinations in GLUT1-e1. These are shown as space-filling molecules in dark blue (CB site 1) and light blue (CB site 2). GS for CB binding to sites 1 and 2 are −7.2 and −6.6 kcal/mol, respectively. Both CB sites suggest steric hindrance with the core β-d-Glc binding site (shown as a space-filling molecule in red).
Figure 6.
Figure 6.
Sugar transport in HEK293 cells heterologously expressing wtGLUT1 or GLUT1Q282A. A, Michaelis–Menten kinetics of zero-trans 2DG uptake in cells expressing wtGLUT1 (○) or GLUT1Q282A (●). 2DG uptake in μmol/μg cell protein/min is plotted versus [2DG] in mm. Each data point is the mean ± S.E. of three or more duplicate measurements and is corrected for 2DG uptake in mock-transfected cells. The curves were computed by nonlinear regression assuming Michaelis–Menten uptake kinetics (Equation 1) and have the following constants: wtGLUT1 (●): Vmax = 3.2 ± 0.02 pmol/μg protein/min, Km(app) = 0.89 ± 0.18 mm, R2 = 0.884, standard error of regression = 0.31 pmol/μg protein/min; GLUT1Q282A (○): Vmax = 3.4 ± 0.3 pmol/μg protein/min, Km(app) = 1.59 ± 0.28 mm, R2 = 0.926, standard error of regression = 0.24 pmol/μg protein/min. B, cell surface expression of wtGLUT1 and GLUT1Q282A in HEK293 cells. The mobility of molecular weight markers is indicated at the left of the blot which shows GLUT1 levels present in biotinylated membrane proteins collected from untransfected (UTF), wtGLUT1-expressing (WT), and GLUT1Q282A-expressing (Q282A) HEK293 cells. C, Km(app) but not Vmax for 2DG transport is affected in GLUT1Q282A. The results of five separate experiments are shown as scatter-dot plots for both Km(app) and Vmax. The results are shown as means ± S.E. Paired t test analysis (dashed lines indicate paired measurements) indicates that Vmax is not significantly affected by the Q282A mutation (p = 0.2036) but that Km(app) increases 2-fold (p = 0.0046).
Figure 7.
Figure 7.
cis- and trans-Allostery in wtGLUT1 (●) and GLUT1Q282A (○). A, cis-allostery. Concentration dependence of maltose modulation of 2DG influx is shown. Normalized 2DG uptake (vi/vc) is plotted as a function of [maltose] (mm) on a log scale. The curves drawn through the points (solid lines for wtGLUT1 (●) and dashed lines for GLUT1Q282A (○)) were computed by nonlinear regression using Equation 2 and have the following constants: wtGLUT1 (●), K1 = 0.0028, K2 = 0.31 mm−1, K3 = 0.197 mm−1, K4 = 1.62 mm−2, R2 = 0.582, standard error of regression = 0.147; GLUT1Q282A (○), K1 = 0.028, K2 = 1.83 mm−1, K3 = 1.911 mm−1, K4 = 1.62 mm−2, R2 = 0.582, standard error of regression = 0.147. B, trans-allostery. Concentration dependence of CB modulation of 2DG influx is shown. Normalized 2DG uptake (vi/vc) is plotted as a function of [CB] (μm) on a log scale. The curves drawn through the points (solid lines for wtGLUT1 (●) and dashed lines for GLUT1Q282A (○)) were computed by nonlinear regression using Equation 2 and have the following constants: wtGLUT1 (●), K1 = 0.0041 μm2, K2 = 0.073 μm, K3 = 2 × 10⁻¹² μm, K4 = 1.64, R2 = 0.637, standard error of regression = 0.179; GLUT1Q282A (○), K1 = 0.0050 μm2, K2 = 0.039 μm, K3 = 8.3 × 10⁻¹⁴ μm, K4 = 1.495, R2 = 0.849, standard error of regression = 0.067.
Figure 8.
Figure 8.
cis- and trans-Allostery in a GLUT1 oligomerization-deficient background. GLUT1(GLUT3-H9) and GLUT1(GLUT3-H9)Q282A expressed in HEK293 cells were tested for their ability to mediate cis- and trans-allostery. A, cis-allostery. Concentration dependence of maltose modulation of 2DG influx. Normalized 2DG uptake (vi/vc) is plotted versus [maltose] (mm) on a log scale. The curves drawn through the points (solid lines for GLUT1(GLUT3-H9) and dashed lines for GLUT1(GLUT3-H9)Q282A) were computed by nonlinear regression using Equation 2 and have the following constants: GLUT1(GLUT3-H9) (●), K1 = 0.0022, K2 = 2.052 mm−1, K3 = 1.707 mm−1, K4 = 1.72 mm−2, R2 = 0.656, standard error of regression = 0.137; GLUT1(GLUT3-H9)Q282A (○), K1 = 0.081, K2 = 0.63 mm−1, K3 = 0.626 mm−1, K4 = 1.528 mm−2, R2 = 0.747, standard error of regression = 0.080. B, trans-allostery. Concentration dependence of CB modulation of 2DG influx. Normalized 2DG uptake (vi/vc) is plotted versus [CB] (μm) on a log scale. The curves drawn through the points (solid lines for GLUT1(GLUT3-H9) and dashed lines for GLUT1(GLUT3-H9)Q282A) were computed by nonlinear regression using Equation 3 and have the following constants: GLUT1(GLUT3-H9) (●), K1 = 0.984 μm/s, K2 = 0.740 μm/s, K3 = 0.138 μm, R2 = 0.963, standard error of regression = 0.058; GLUT1(GLUT3-H9)Q282A (○), K1 = 0.996 μm/s, K2 = 0.711 μm/s, K3 = 0.065 μm, R2 = 0.904, standard error of regression = 0.093.
Figure 9.
Figure 9.
Scatter plots of the effects of maltose (10 and 50 μm) and CB (25 nm) on 0. 1 mm 2DG uptake in cells expressing GLUT1 (A), GLUT1Q282A (B), GLUT1(GLUT3-H9) (C), and GLUT1(GLUT3-H9)Q282A (D). Normalized uptake (vi/vc) is plotted versus concentrations of maltose and CB applied during 2DG uptake measurements. The results are shown as the averages of paired replicates (n = 4) and means ± S.E. of multiple experiments (n ≥ 3). The data were examined by unpaired t test analysis comparing the effect of treatment to no treatment (vi/vc = 1 as indicated by the dashed horizontal line), and the computed significance levels are indicated above the points for treatments resulting in p < 0.05.

Similar articles

Cited by

References

    1. Cura A. J., and Carruthers A. (2012) Role of monosaccharide transport proteins in carbohydrate assimilation, distribution, metabolism, and homeostasis. Compr. Physiol. 2, 863–914 - PMC - PubMed
    1. Cunningham P., and Naftalin R. J. (2014) Reptation-induced coalescence of tunnels and cavities in Escherichia coli XylE transporter conformers accounts for facilitated diffusion. J. Membr. Biol. 247, 1161–1179 - PMC - PubMed
    1. Mueckler M., Caruso C., Baldwin S. A., Panico M., Blench I., Morris H. R., Allard W. J., Lienhard G. E., and Lodish H. F. (1985) Sequence and structure of a human glucose transporter. Science 229, 941–945 - PubMed
    1. Nomura N., Verdon G., Kang H. J., Shimamura T., Nomura Y., Sonoda Y., Hussien S. A., Qureshi A. A., Coincon M., Sato Y., Abe H., Nakada-Nakura Y., Hino T., Arakawa T., Kusano-Arai O., et al. (2015) Structure and mechanism of the mammalian fructose transporter GLUT5. Nature 526, 397–401 - PMC - PubMed
    1. Deng D., Sun P., Yan C., Ke M., Jiang X., Xiong L., Ren W., Hirata K., Yamamoto M., Fan S., and Yan N. (2015) Molecular basis of ligand recognition and transport by glucose transporters. Nature 526, 391–396 - PubMed

Publication types

MeSH terms

LinkOut - more resources