. 2017 Oct 24;8(1):916.
doi: 10.1038/s41467-017-00914-9.

Citizen science provides a reliable and scalable tool to track disease-carrying mosquitoes

Affiliations

Citizen science provides a reliable and scalable tool to track disease-carrying mosquitoes

John R B Palmer et al. Nat Commun. .

Abstract

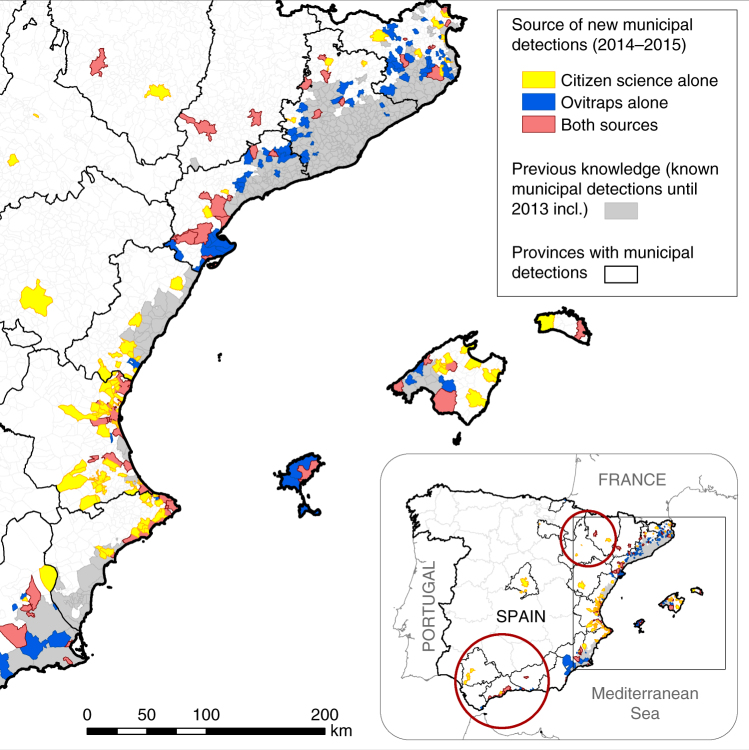
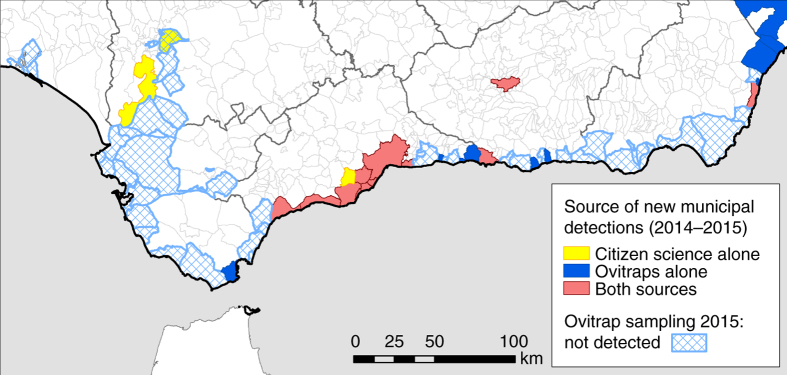
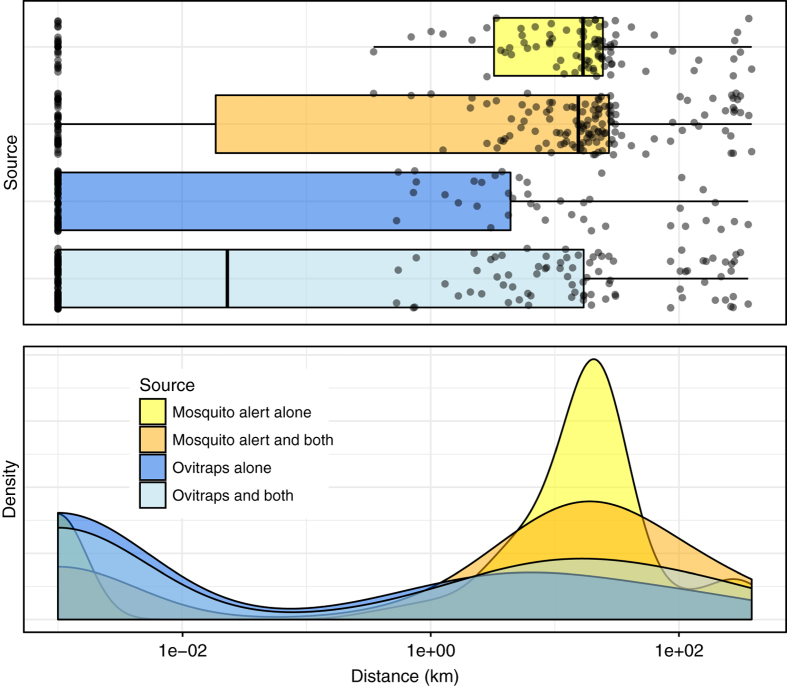
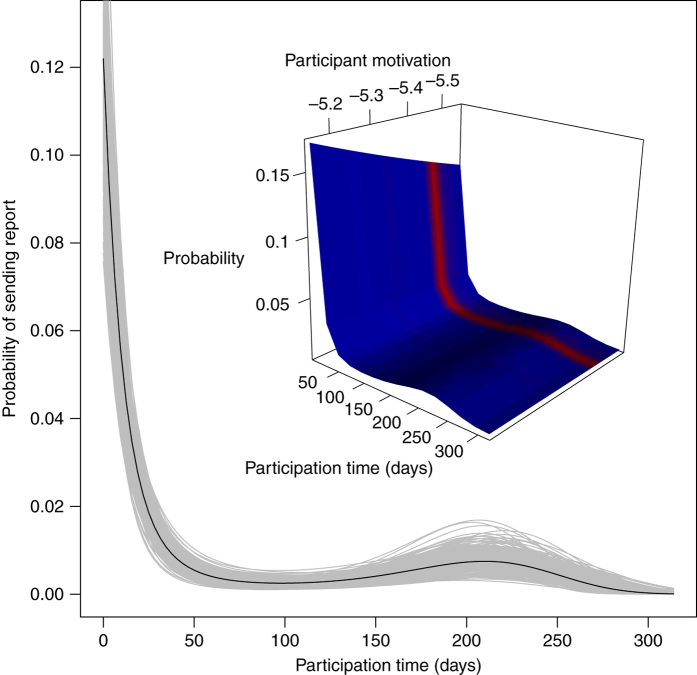
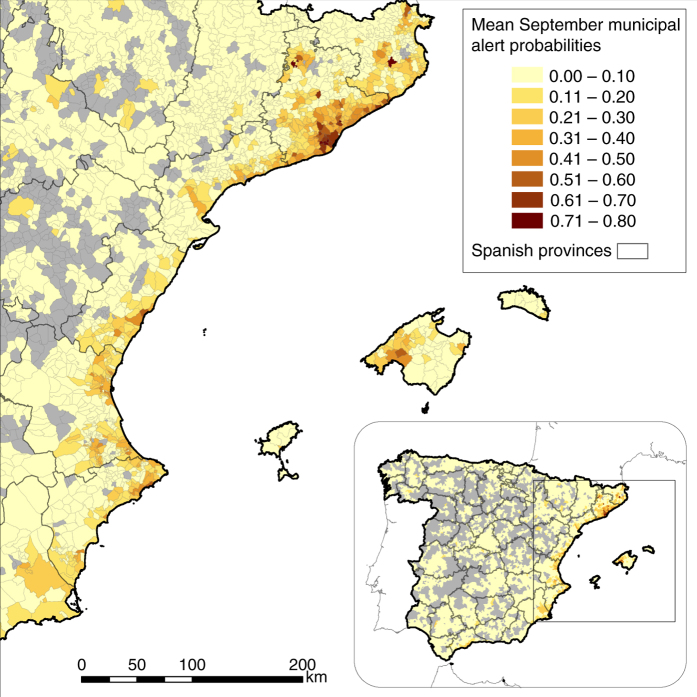
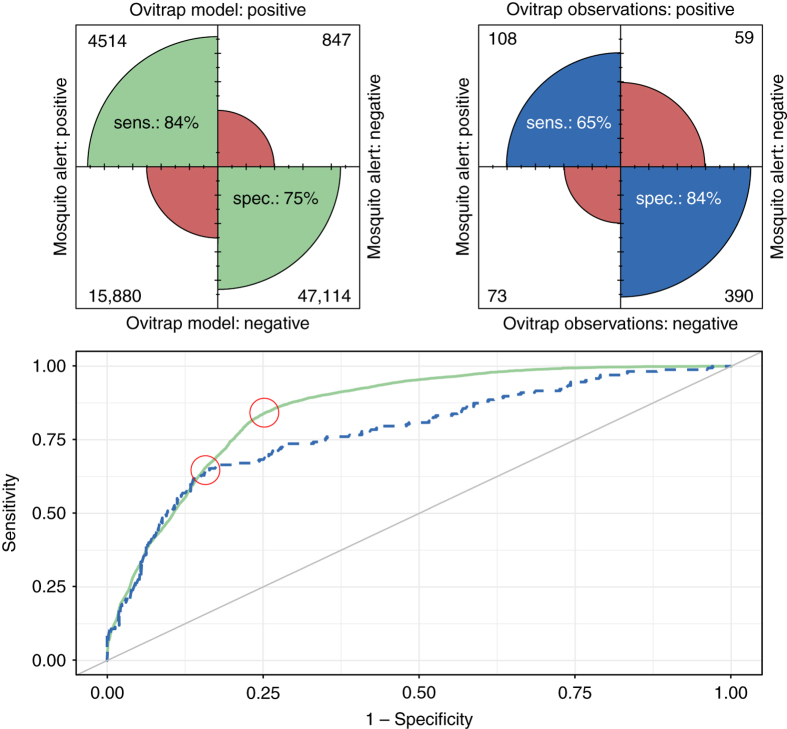
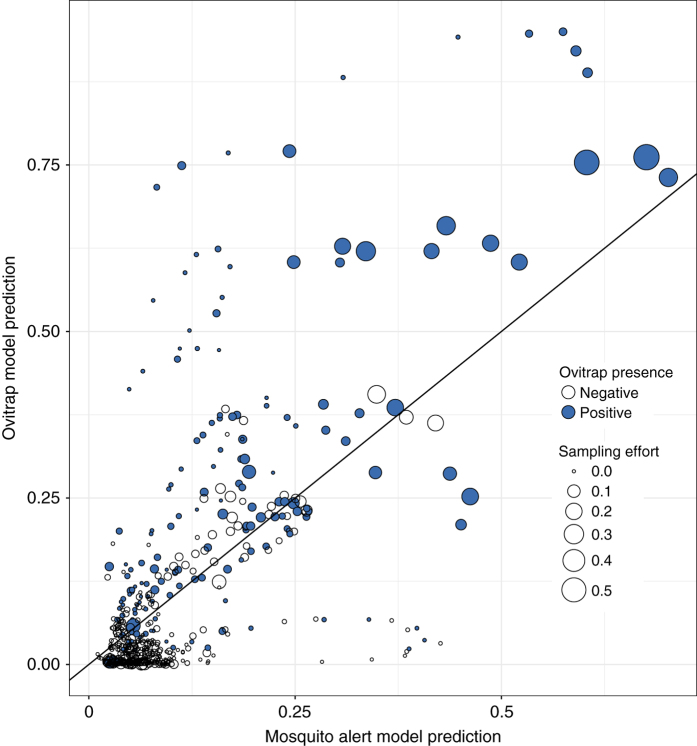
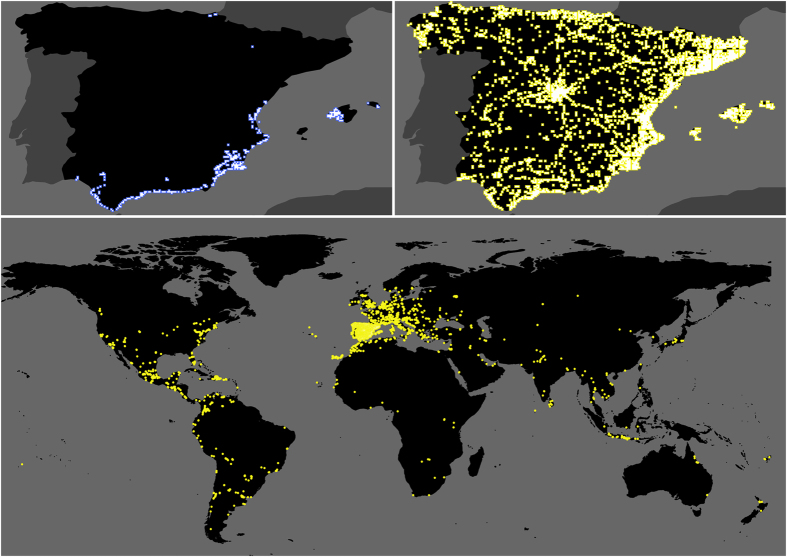
Recent outbreaks of Zika, chikungunya and dengue highlight the importance of better understanding the spread of disease-carrying mosquitoes across multiple spatio-temporal scales. Traditional surveillance tools are limited by jurisdictional boundaries and cost constraints. Here we show how a scalable citizen science system can solve this problem by combining citizen scientists' observations with expert validation and correcting for sampling effort. Our system provides accurate early warning information about the Asian tiger mosquito (Aedes albopictus) invasion in Spain, well beyond that available from traditional methods, and vital for public health services. It also provides estimates of tiger mosquito risk comparable to those from traditional methods but more directly related to the human-mosquito encounters that are relevant for epidemiological modelling and scalable enough to cover the entire country. These results illustrate how powerful public participation in science can be and suggest citizen science is positioned to revolutionize mosquito-borne disease surveillance worldwide.


Conflict of interest statement

The authors declare no competing financial interests.

Figures

Fig. 1
Fig. 1
Range of expansion of the tiger mosquito in Spain (Canary Islands, Ceuta and Melilla excluded) in 2014–2015. Provinces with municipal-level detections are highlighted. Grey areas denote state of knowledge at the municipal level based on ovitrap surveillance through 2013 (source data from ref. 17). Other colours indicate municipal detections during 2014–2015 by expert validated reports from citizen science (yellow), ovitrap surveillance (dark blue) and both methods (light red) (source data from refs. 17, 18). Red circles indicate areas far from the main invasion front, from which the discoveries of the species were corroborated in the field using ovitraps, but triggered by citizen science, . Boundary data from Spanish National Geographic Institute. © Instituto Geográfico Nacional
Fig. 2
Fig. 2
New detections based on the ovitrap and Mosquito Alert tiger mosquito surveillance performed in the south of Spain in 2014–2015 (as in Fig. 1). Municipalities surveilled with ovitraps during 2015 but ending in no-detections are shown in light dashed blue (source data from ref. 18). Note that a lot of sampling effort is unsuccessful (light dashed blue). Successful detections come from ovitraps alone (dark blue), citizen scientists alone (yellow) or both ovitraps and citizen scientists (light red). In 4 out of the 12 red municipalities, ovitrap surveillance was triggered by citizen science alerts through the Mosquito Alert platform but citizen science reports cannot always be confirmed in the field (e.g. ovitraps are not always placed in municipalities where citizen science reports suggest presence; even when they are placed in these municipalities low ovitrap or population densities may generate false negatives). Boundary data from Spanish National Geographic Institute. © Instituto Geográfico Nacional
Fig. 3
Fig. 3
Distributions of distances between known tiger mosquito invasion front and new municipalities in which tiger mosquitoes were detected in 2014–2015. New municipalities are divided into those in which Mosquito Alert is alone credited for the detection (yellow), those in which Mosquito Alert is alone credited combined with those in which both Mosquito Alert and ovitraps are credited (in other words, all municipalities in which Mosquito Alert is credited; orange), those in which ovitraps are alone credited (dark blue), and those in which ovitraps are alone credited combined with those in which both are credited (in other words, all those in which ovitraps are credited; light blue). All distances calculated between municipality boundaries, using shortest distance to invasion front, and shown on x axis using log-scale to improve visualization of long tails (1 m added to all 0-km distances). Top: boxplots with boxes encompassing central 50% of the data and central bars indicating medians. Whiskers extend to 1.5 times the inter-quartile ranges. Raw data shown with jittered black points. Bottom: Gaussian kernel density estimates
Fig. 4
Fig. 4
Reporting propensity. Probability of participant sending at least one report during a 24-h period as a function of participation time and participant’s intrinsic motivation (modelled as random intercept at participant level). Main: values for the mean random intercept. Each grey curve is based on a random draw from the posterior distributions of the participation time parameters; black is based on the mean of the posteriors. Inset: prediction surface with participant motivation (random intercepts) shown on x axis as continuous variable in observed range; surface colour represents density of participants at each random intercept value (red = higher; blue = lower)
Fig. 5
Fig. 5
Mean September municipal alert probabilities in Spain (Canary Islands, Ceuta and Melilla excluded), based on 2014–2015 Mosquito Alert reliable reports. Grey municipalities were not sampled by Mosquito Alert participants during this period. Boundary data from Spanish National Geographic Institute. © Instituto Geográfico Nacional
Fig. 6
Fig. 6
Receiver operating characteristic (ROC) curves (bottom) and confusion matrix plots (top) for Mosquito Alert human–mosquito encounter probability model predictions. Bottom: ROC curves show trade-off between sensitivity and specificity of biweek municipality predictions depending on the threshold used for predictions, with the area under the curve (AUC) providing a measure of classifier performance that is insensitive to changes in class distribution. Plot shows Mosquito Alert predictions of biweek municipal-level ovitrap model predictions (solid green line; AUC = 0.85) and observations (dashed blue line; AUC = 0.78). Diagonal line shows AUC = 0.50, which is the theoretical value for random guessing. Top: confusion matrix plots drawn using the thresholds that maximize the sum of sensitivity and specificity for the ROC curve drawn from the ovitrap model (left) and observed ovitraps (right). This threshold is indicated on the ROC curves themselves (bottom plot) with red circles
Fig. 7
Fig. 7
Comparison of daily Mosquito Alert with ovitrap predictions and observations for contemporaneously sampled municipalities in 2015. Marker location indicates probability of at least one reliable tiger mosquito report being sent from the municipality during a given 2-week period, as predicted by the Mosquito Alert model (x axis), and of at least one tiger mosquito egg detection in the municipality from a trap left out during the same period, as predicted by the ovitrap model (y axes). Marker colour indicates observed ovitrap results of tiger mosquito egg presence (blue) or absence (white). Reference line indicates equality of ovitrap and Mosquito Alert predictions
Fig. 8
Fig. 8
Ovitrap and citizen scientist locations. Top left: blue markers show locations of sampling cells containing the 1558 ovitraps used in the analysis, accounting for nearly all ovitraps placed in Spain during 2014–2015. Top right and bottom: yellow markers show locations of sampling cells in which Mosquito Alert participants were randomly sampled in Spain (top right, excluding the Canary Islands, Ceuta and Melilla) and around the globe (bottom) during 2014–2015. Sampling occurred on Android devices five times per day at random times between 7:00 am and 10:00 pm (and only if the participant did not opt out of the background tracking feature). In all cases, white square at centre of marker shows actual sampling cell size, while coloured border is used to ease visualization. Boundary data from Natural Earth (naturalearthdata.com)

References

    1. Crowl TA, Crist TO, Parmenter RR, Belovsky G, Lugo AE. The spread of invasive species and infectious disease as drivers of ecosystem change. Front. Ecol. Environ. 2008;6:238–246. doi: 10.1890/070151. - DOI
    1. Lounibos LP. Invasions by insect vectors of human disease. Annu. Rev. Entomol. 2002;47:233–266. doi: 10.1146/annurev.ento.47.091201.145206. - DOI - PubMed
    1. Strayer DL, Eviner VT, Jeschke JM, Pace ML. Understanding the long-term effects of species invasions. Trends Ecol. Evol. 2006;21:645–651. doi: 10.1016/j.tree.2006.07.007. - DOI - PubMed
    1. Pimentel D, Lach L, Zuniga R, Morrison D. Environmental and economic costs of nonindigenous species in the United States. Bioscience. 2000;50:53. doi: 10.1641/0006-3568(2000)050[0053:EAECON]2.3.CO;2. - DOI
    1. Pimentel D, Zuniga R, Morrison D. Update on the environmental and economic costs associated with alien-invasive species in the United States. Ecol. Econ. 2005;52:273–288. doi: 10.1016/j.ecolecon.2004.10.002. - DOI

Publication types

MeSH terms