. 2017 Oct 24;8(1):1121.
doi: 10.1038/s41467-017-01130-1.

Actomyosin pulsation and flows in an active elastomer with turnover and network remodeling

Affiliations

Actomyosin pulsation and flows in an active elastomer with turnover and network remodeling

Deb Sankar Banerjee et al. Nat Commun. .

Abstract

Tissue remodeling requires cell shape changes associated with pulsation and flow of the actomyosin cytoskeleton. Here we describe the hydrodynamics of actomyosin as a confined active elastomer with turnover of its components. Our treatment is adapted to describe the diversity of contractile dynamical regimes observed in vivo. When myosin-induced contractile stresses are low, the deformations of the active elastomer are affine and exhibit spontaneous oscillations, propagating waves, contractile collapse and spatiotemporal chaos. We study the nucleation, growth and coalescence of actomyosin-dense regions that, beyond a threshold, spontaneously move as a spatially localized traveling front. Large myosin-induced contractile stresses lead to nonaffine deformations due to enhanced actin and crosslinker turnover. This results in a transient actin network that is constantly remodeling and naturally accommodates intranetwork flows of the actomyosin-dense regions. We verify many predictions of our study in Drosophila embryonic epithelial cells undergoing neighbor exchange during germband extension.


Conflict of interest statement

The authors declare no competing financial interests.

Figures

Fig. 1
Fig. 1
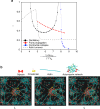
Schematic of apical cortex and linear stability results: a Schematic showing the medial actomyosin cytoskeletal meshwork within the apical region of a cell belonging to the tissue. The actin filaments are attached to the cell junctions via E-cadherin (red dots). Myosin minifilaments bind (unbind) with rates k b(k u) and when bound, apply contractile stresses on the actin filament meshwork—the red circle demarcates a region of higher mesh compression. Both actin filaments and myosin minifilaments undergo turnover. b (I–II) Linear stability phase diagrams in (I) effective elastic stress density vs. contractile stress density at k = 1 and (II) Effective contractile stress density vs. inverse lifetime of bound myosin at B = 4. The stresses are normalized by the frictional stress density, Γk b l 2. The phases are described in the legend. Rest of the dimensionless parameters are α = 0.1, c = 0.1, D = 0.1 (see “Methods” section)
Fig. 2
Fig. 2
Phase diagram obtained from numerical solutions of Eqs. 7 and 8. a Effective elastic stress density vs. contractile stress density, with k = 0.1. b Effective contractile stress density vs. inverse-lifetime, with B = 5. The phases are (i) Stable (yellow), (ii) spontaneous Oscillatory (blue), (iii) spontaneous Moving (grey) and (iv) contractile Collapse (light-green). The corresponding kymographs of the bound myosin density (indicated by the color and symbol on the upper right corner) is shown in c, d, f and h, respectively. The regions marked violet and dark-green are the coexistence phases—the oscillatory-moving coexistence (open circle) and the collapse-moving coexistence (open square), with the corresponding kymographs shown in e and g, respectively. Apart from the new phases, the topology of the phase diagrams are roughly similar to the linear stability diagram (Fig. 1b), except for the upturn of the phase boundaries towards larger active stress in b, which arises from the nonlinear strain-dependent unbinding. Symbols are points at which numerical solutions have been obtained. Rest of the dimensionless parameters are, α = 3, c = 0.1, χ(ρ 0)ζ 1 = −0.5, and ζ 2 = 0.1 (see “Methods” section)
Fig. 3
Fig. 3
Kymographs of bound myosin density from theory and experiment: a, b Kymograph of the spatial profile of bound myosin density from theory, shows nucleation and growth (0 < t < 0.15), followed by coalescence (0.15 < t < 0.7) and movement (t > 0.7). Here B = 6, −ζ 1Δμ = 5.5, k = 0.5, α = 1 and D = 0.15. Rest of the parameters as in Fig. 2. c Kymograph of the spatial profile of labeled myosin from experiment, shows nucleation and growth (0 < t < 5 s), followed by coalescence (5 < t < 10 s) and d eventual movement of the formed actomyosin-rich region (t > 10 s)
Fig. 4
Fig. 4
Time evolution of ρ b, the density profile of bound myosin in a cluster prior to movement: a Prior to movement the myosin density profile is seen to be symmetric, following which we compute the instantaneous left-right fluxes, J L,R of myosin drawn into it. b Time evolution of the algebraic sum J L + J R, shows that after a while, there develops a net flux in one direction as a precursor to the asymmetric traveling front. c Emergence of the asymmetric traveling front which moves towards the right in a shape-invariant manner. df Myosin intensity profiles from experiments, which shows how an initial stationary symmetric myosin profile at t = 0, finally evolves to an asymmetric profile at t = 4.5 s, which then travels to the right. The degree of shape asymmetry of the profiles is described by the skewness S, the standard error of mean(s.e.m.) reported is due to projection of the images to one dimension
Fig. 5
Fig. 5
Anatomy of the traveling front in the co-moving frame: a Spatial profile of excess bound-myosin density (black) and strain ϵ (red) profile, b Spatial profile of Myosin density and derivative of the effective elastic free energy Φ′(ϵ) (red), c Spatial profile of myosin density and active force (red). Horizontal axis is distance from centre of mass position, x CM. Here B = 6.0, −ζ 1Δμ = 4.8, k = 0.2, α = 1.0 and D = 0.25. d Theory predicts that the traveling front velocity is proportional to the net active force integrated over the front profile across the moving front. We demonstrate this fact from a numerical solution of the dynamical equations by varying the parameters of the active stress (circle) and the elastic stress (triangle). for different values of B (with −ζ 1Δμ = 6.0, k = 0.2 and D = 0.15 fixed) and −ζ 1Δμ (with B = 8.0, k = 0.2 and D = 0.15 fixed). Rest of the parameters as in Fig. 2.The color bar shows the magnitude of these stresses in dimensionless units. (inset) Skewness of bound myosin profile in the traveling front vs. velocity, obtained by varying the contractile stress −ζ 1Δμ from 3–4 shows a linear increase followed by saturation. The other dimensionless parameters are: B = 4, k = 0.2, D = 0.1, α = 1 and c = 0.1. The error bars are calculated as s.e.m
Fig. 6
Fig. 6
Possible mechanisms for the movement of actomyosin-dense structures in an active affine elastomer: a moving deformation of the actomyosin mesh without turnover, implying a traveling front, and b moving deformation of the actomyosin mesh with differential myosin binding unbind rates at the leading and trailing edges of the front
Fig. 7
Fig. 7
Enhanced actin turnover results in nonaffine deformation of the elastomer: a Qualitative behavior of the actin turnover time as a function of contractile stress, which is consistent the with data from refs. . This should be compared with the time scales of oscillation, front propagation and contractile collapse obtained from the affine theory (see, Supplementary Fig. 5). Based on the discussion in the text, we have placed the crossover stress σ in the moving regime, thus implying that the crossover to the nonaffine description occurs in this regime. b Schematic showing the intranetwork flow of an actomyosin-dense region (enclosed within the yellow circle) resulting from active stress induced unbinding and rapid turnover of the actin in a transient actomyosin network
Fig. 8
Fig. 8
Spatial profile and movement of myosin dense regions: Excess bound myosin density in the moving frame. ac Three separate examples of the spatial profile of myosin intensity in the co-moving frame of the flowing actomyosin-dense cluster displayed at different times. Note that the actomyosin-dense cluster hardly changes its shape as it flows towards a junction
Fig. 9
Fig. 9
Velocity and profile of myosin dense regions: a Histogram of the number of flows that move to the right junction R starting from either the right R (P(R|R) or the left L (P(R|L) region of the cell (inset shows schematic). The data collected from 24 actomyosin-dense clusters over 18 cells. The fact that the histograms are similar is consistent with the theoretical prediction that the flow is spontaneous and not driven by the cell boundaries. b Velocity of an isolated flowing actomyosin-dense cluster monitored over time shows that it is a constant, as predicted by theory. c Here we present average skewness values of 28 different pulses plotted against average velocities of the respective pulses. The linear behavior is quite clear from the data and a linear fit produced a slope value of 2.6 ± 0.5. This intensity data set was prepared from 20 myosin-GFP-tagged germband cells (N = 20). Error bars indicate s.e.m. of fluctuation of skewness and velocity values of a pulse in time

Similar articles

Cited by

References

    1. Martin AC, Kaschube M, Wieschaus EF. Pulsed contractions of an actin-myosin network drive apical constriction. Nature. 2009;457:495–499. doi: 10.1038/nature07522. - DOI - PMC - PubMed
    1. Solon J, Kaya-Copur A, Colombelli J, Brunner D. Pulsed forces timed by a ratchet-like mechanism drive directed tissue movement during dorsal closure. Cell. 2009;137:1331–1342. doi: 10.1016/j.cell.2009.03.050. - DOI - PubMed
    1. Meghana C, et al. Integrin adhesion drives the emergent polarization of active cytoskeletal stresses to pattern cell delamination. Proc. Natl Acad. Sc. 2011;108:9107–9112. doi: 10.1073/pnas.1018652108. - DOI - PMC - PubMed
    1. Blanchard GB, Murugesu S, Adams RJ, Martinez-Arias A, Gorfinkiel N. Cytoskeletal dynamics and supracellular organisation of cell shape fluctuations during dorsal closure. Development. 2010;137:2743–2752. doi: 10.1242/dev.045872. - DOI - PubMed
    1. Roh-Johnson M, et al. Triggering a cell shape change by exploiting preexisting actomyosin contractions. Science. 2012;335:1232–1235. doi: 10.1126/science.1217869. - DOI - PMC - PubMed

Publication types

LinkOut - more resources