. 2017 Oct 24;8(1):1130.
doi: 10.1038/s41467-017-01236-6.

Activation of STAT3 integrates common profibrotic pathways to promote fibroblast activation and tissue fibrosis

Affiliations

Activation of STAT3 integrates common profibrotic pathways to promote fibroblast activation and tissue fibrosis

Debomita Chakraborty et al. Nat Commun. .

Erratum in

Abstract

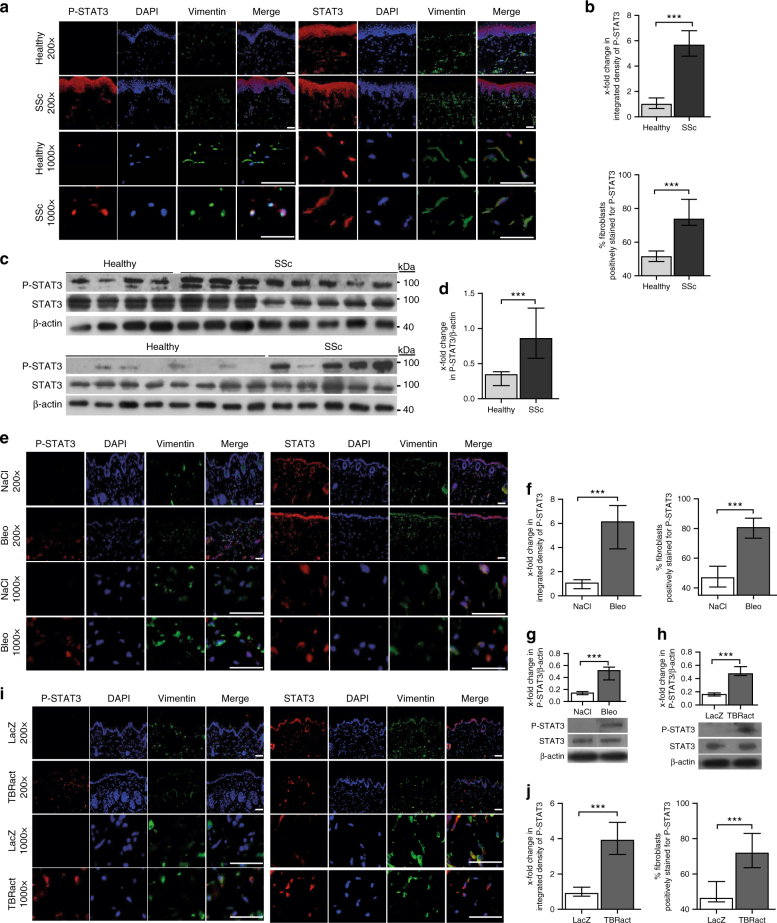
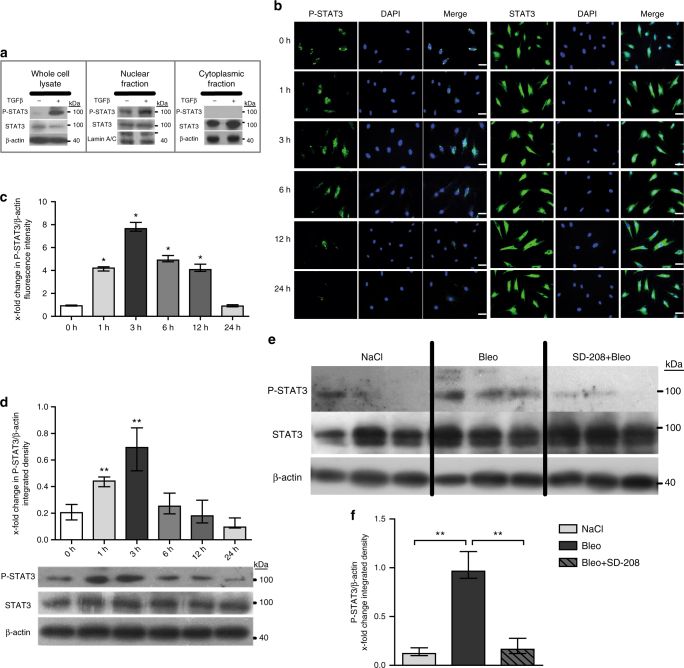
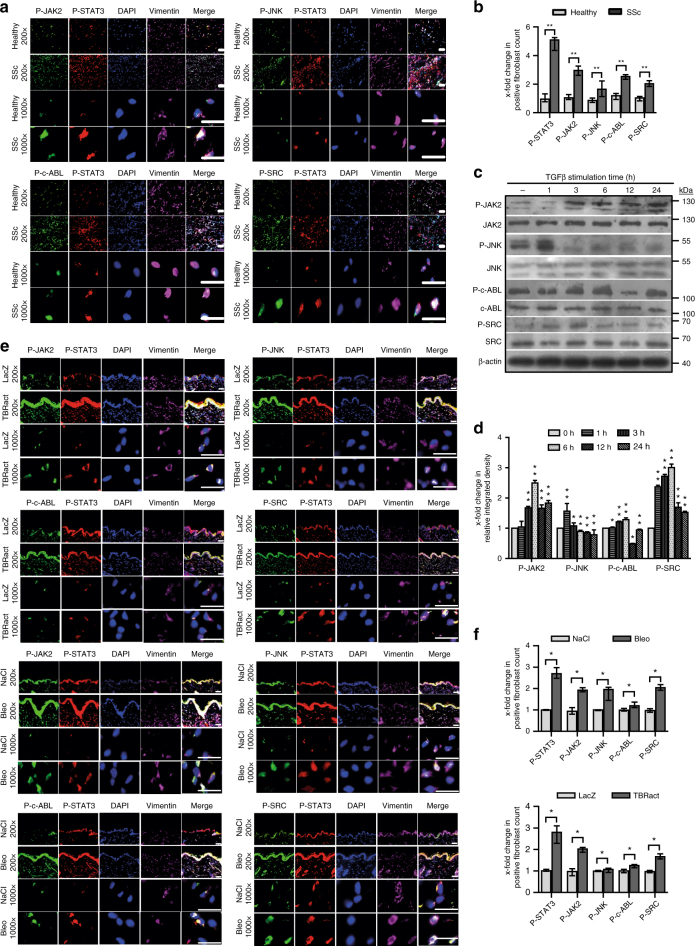
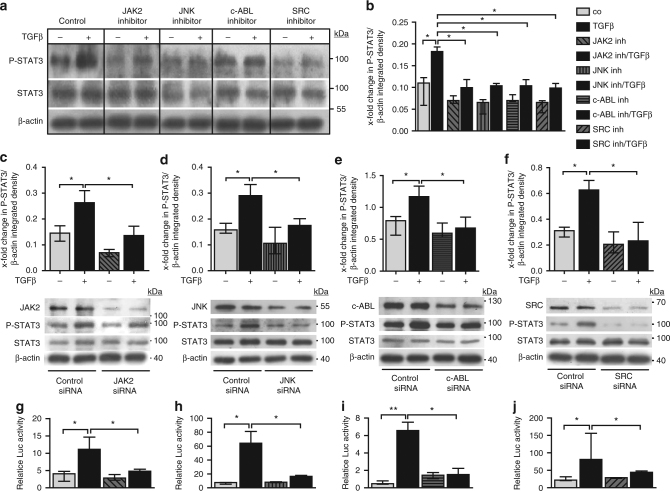
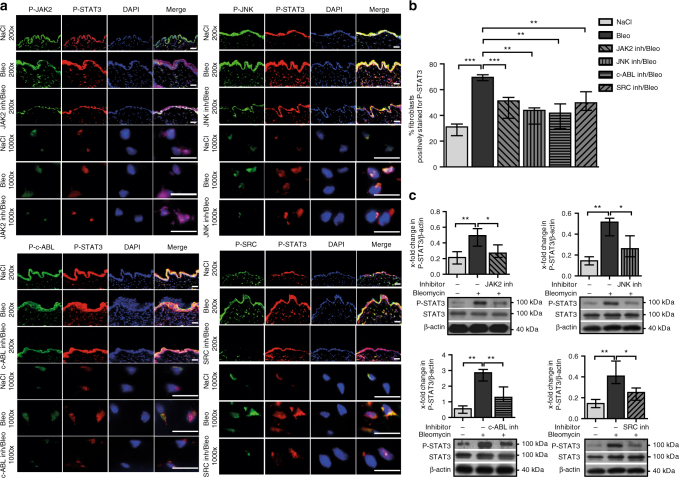
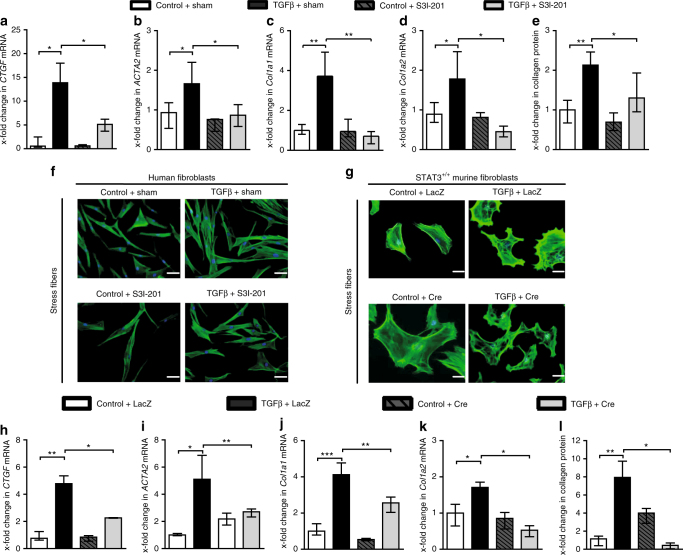
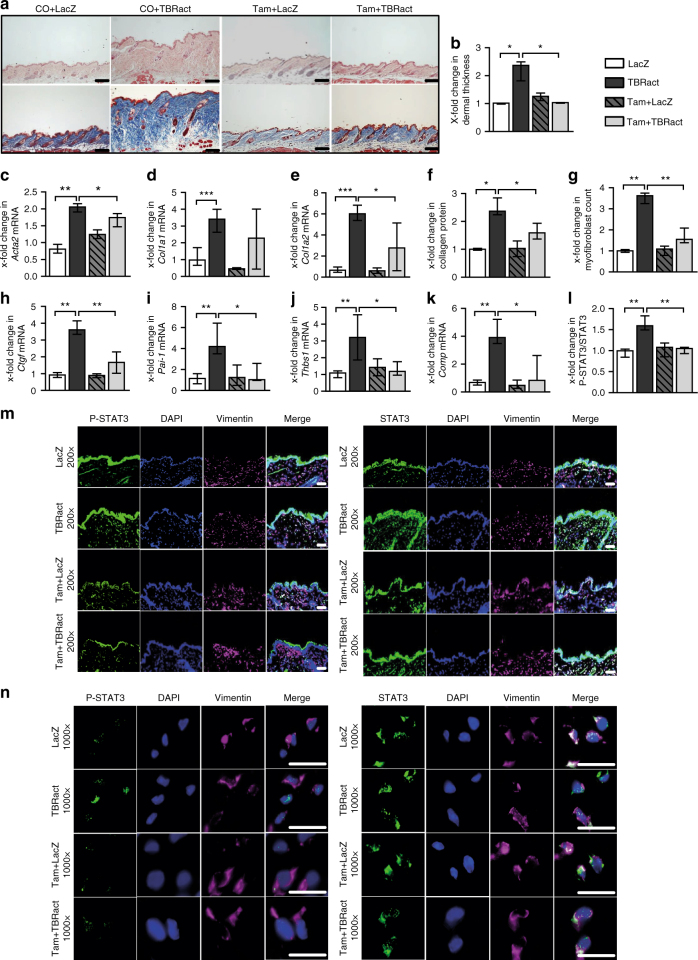
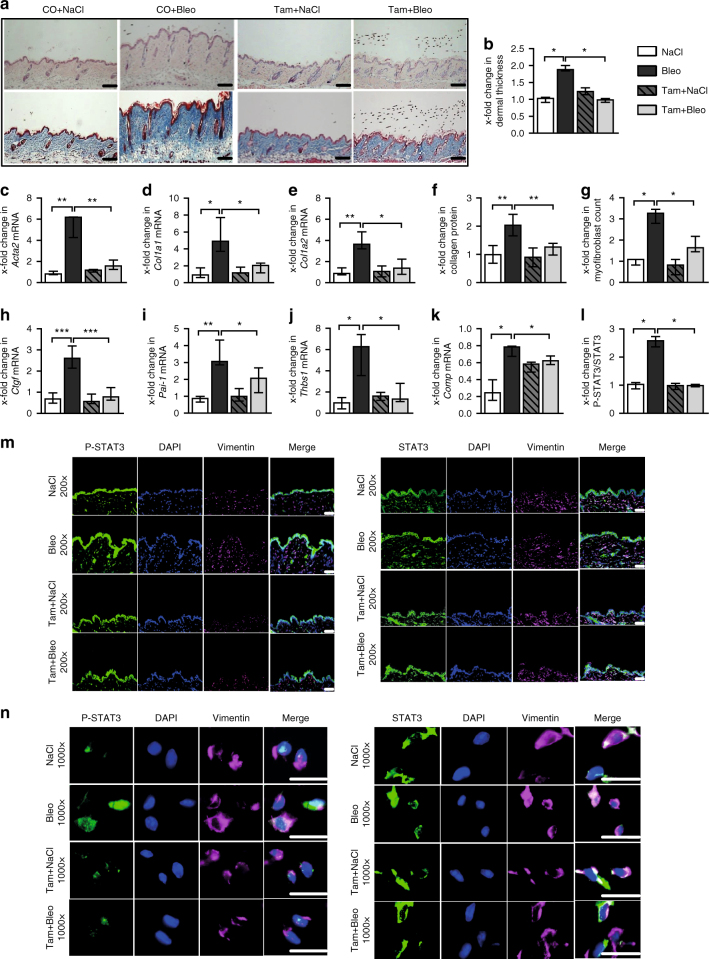
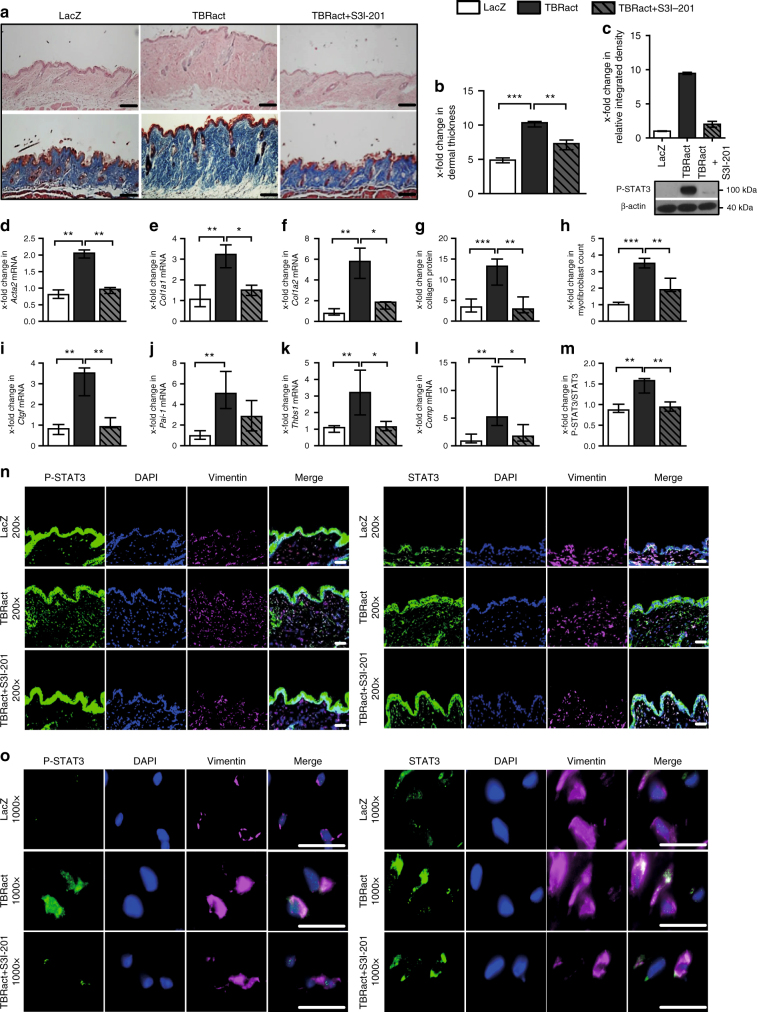
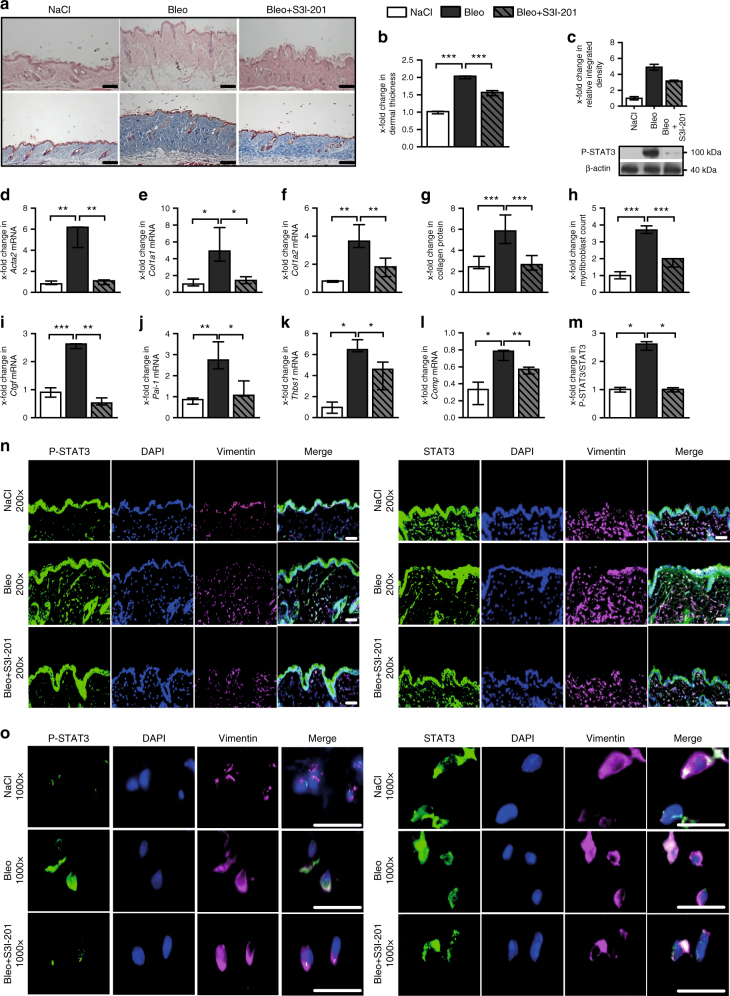
Signal transducer and activator of transcription 3 (STAT3) is phosphorylated by various kinases, several of which have been implicated in aberrant fibroblast activation in fibrotic diseases including systemic sclerosis (SSc). Here we show that profibrotic signals converge on STAT3 and that STAT3 may be an important molecular checkpoint for tissue fibrosis. STAT3 signaling is hyperactivated in SSc in a TGFβ-dependent manner. Expression profiling and functional studies in vitro and in vivo demonstrate that STAT3 activation is mediated by the combined action of JAK, SRC, c-ABL, and JNK kinases. STAT3-deficient fibroblasts are less sensitive to the pro-fibrotic effects of TGFβ. Fibroblast-specific knockout of STAT3, or its pharmacological inhibition, ameliorate skin fibrosis in experimental mouse models. STAT3 thus integrates several profibrotic signals and might be a core mediator of fibrosis. Considering that several STAT3 inhibitors are currently tested in clinical trials, STAT3 might be a candidate for molecular targeted therapies of SSc.


Conflict of interest statement

Although none of the authors has any direct conflict of interest related to the use or development of STAT3 inhibitors, O.D. and J.H.W.D. are involved in the development of new targeted therapies for fibrotic diseases such as SSc. O.D. has consultancy relationships and/or has received research funding from Actelion, Pfizer, Ergonex, BMS, Sanofi-Aventis, United BioSource Corporation, Roche/Genentech, Medac, Biovitrium, Boehringer Ingelheim, Novartis, 4D Science, Active Biotech, Bayer, Sinoxa, Serodapharm, EpiPharm, GSK, Pharmacyclics, and Biogen. J.H.W.D. has consultancy relationships with Actelion, Active Biotech, Anamar, Bayer Pharma, Boehringer Ingelheim, Celgene, Galapagos, Inventiva, JB Therapeutics, Medac, Pfizer, RuiYi, and UCB. J.H.W.D. has received research funding from Anamar, Active Biotech, Array Biopharma, BMS, Bayer Pharma, Boehringer Ingelheim, Celgene, GSK, Novartis, Sanofi-Aventis, and UCB. J.H.W.D. is stock owner of 4D Science. The remaining authors declare no competing financial interests.

Figures

Fig. 1
Fig. 1
Activation of STAT3 signaling in fibrotic SSc skin. ad Evaluation of STAT3 signaling in human samples: a Representative images and b quantitative analysis of immunofluorescence staining for P-STAT3 (left) and total STAT3 (right) co-stained with the vimentin (fibroblast marker) and DAPI (staining of nuclei) shown at 200-fold and 1000-fold magnification (n = 12 for SSc and n = 10 for healthy skin). c Western blots and d quantification of the levels of P-STAT3 and total STAT3 in human dermal fibroblasts from 13 SSc patients and 12 healthy individuals. eg Evaluation of STAT3 signaling in the mouse model of bleomycin-induced skin fibrosis: e Representative images of immunofluorescence stainings (200-fold and 1000-fold magnification) showing P-STAT3 (left) and total STAT3 (right) along with f quantification and g confirmation by western blot analyses in the skin of mice injected with NaCl or bleomycin (n ≥ 6 for each group). hj Evaluation of STAT3 signaling in the mouse model of TBRact-induced fibrosis: h Western blot and i, j immunofluorescence analyses of P-STAT3 expression in the skin of mice injected with TBRact. N ≥ 6 for each group with two or three technical replicates for all experiments. Expected band size for P-STAT3 and STAT3 are 79 kDa (lower faint band) and 86 kDa (higher intense band) and the ladder represents 100 kDa. Beta-actin expected molecular weight/size is 42 kDa. Horizontal scale bar, 100 μm. Results are shown as median ± interquartile range (IQR). Significance was determined by Mann–Whitney test, as compared to healthy volunteers or with non-fibrotic control mice, respectively. *P < 0.05; **P < 0.01, ***P < 0.001
Fig. 2
Fig. 2
TGFβ activates STAT3 signaling in fibroblasts. a Total nuclear and cytoplasmatic levels of P-STAT3 and total STAT3 in human dermal fibroblasts stimulated for 1 h with TGFβ as analyzed by western blot (n ≥ 4 and 2 technical replicates). bd Time-dependent changes in the levels of P-STAT3 as evaluated by b immunofluorescence staining and c quantification further confirmed by d western blot (n ≥ 5 for all). e, f Levels of P-STAT3 in fibroblasts in bleomycin-challenged mice, treated with SD-208, a selective TGFβ receptor type 1 kinase inhibitor (n ≥ 4 with 2 technical replicates for all groups) analyzed by e western blot and f its quantification. Representative blots and images (200-fold magnification; horizontal scale bar, 100 μm) are shown. Expected band size for P-STAT3 and STAT3 are 79 kDa (lower faint band) and 86 kDa (higher intense band) and the ladder represents 100 kDa. Beta-actin expected molecular weight/size is 42 kDa. Results are shown as median ± interquartile range (IQR). *P < 0.05, **P < 0.01 vs. healthy dermal fibroblasts or unstimulated/untreated control fibroblasts, or vehicle-treated, fibrotic mice, respectively
Fig. 3
Fig. 3
Activation of JAK2, JNK, SRC, and c-ABL in SSc. a, b Representative images (a) and quantification (b) of immunofluorescence stainings for P-SRC, P-JAK2, P-JNK, or P-c-ABL co-stained with P-STAT3, DAPI, and vimentin in skin sections of healthy individuals and SSc patients (n ≥ 4 with 3 technical replicates per group for all experiments). c Western blots and d quantification of the activation of SRC, JAK2, JNK, and c-ABL in human dermal fibroblasts stimulated with TGFβ for different time periods (n ≥ 4 and 2 technical replicates for all). A representative western blot and quantification of four independent experiments are shown. e Representative images and f quantification of immunofluorescence stainings for P-SRC, P-JNK, P- JAK2, and P-c-ABL along with P-STAT3 in the skin of mice challenged with bleomycin or overexpressing TBRact with respective non-fibrotic control mice (n ≥ 4 mice with 3 technical replicates per group for all experiments). Magnifications of 200-fold and 1000-fold are shown for all immunofluorescence stainings (horizontal scale bar, 100 μm). JAK2 (expected molecular size, 132 kDa), JNK (expected molecular size, 49 and 55 kDa), c-ABL (expected molecular size, 125–135 kDa), and SRC (expected molecular size, 60 kDa) are represented by ladders showing 130, 55, 100, and 70 kDa, respectively. Beta-actin expected molecular weight/size is 42 kDa. Results are shown as median ± interquartile range (IQR). Significance was determined by Mann–Whitney test, as compared to healthy individuals, unstimulated fibroblasts or with non-fibrotic control mice, respectively.*P < 0.05; **P < 0.01
Fig. 4
Fig. 4
Profibrotic kinases pathways converge on P-STAT3 in vitro. a, b Effects of pharmacologic inhibition of JAK2, JNK, c-ABL, and SRC kinases on the levels of P-STAT3 in TGFβ-stimulated fibroblasts in vitro as analyzed by a western blot and b its quantification (n ≥ 4 with 2 technical replicates per condition for all experiments). Representative images and quantification of four independent experiments are shown. cf Effects of siRNA-mediated knockdown of c JAK2, d JNK, e c-ABL, and f SRC, respectively, on levels of P-STAT3 in healthy human dermal fibroblasts stimulated with TGFβ, as shown by representative western blots and quantifications (n ≥ 4 with 2 technical replicates per group for all experiments). JAK2 (expected molecular size, 132 kDa), JNK (expected molecular size, 49 and 55 kDa), c-ABL (expected molecular size, 125–135 kDa), and SRC (expected molecular size, 60 kDa) are represented by ladders showing 100, 55, 130, and 70 kDa, respectively. Beta-actin expected molecular weight/size is 42 kDa. gj Relative luciferase activity in fibroblasts transfected with STAT3 luciferase reporter plasmid and treated with g the JAK2 inhibitor TG101209, h the JNK inhibitor SP600125, i the c-ABL inhibitor imatinib mesylate and j the SRC inhibitor SU6656, independently with or without TGFβ stimulation (n = 3 independent experiments with 2 technical replicates per group for all experiments). Luciferase activity was normalized against a non-inducible luciferase construct. Results are shown as median ± interquartile range (IQR). Significance was determined by Mann–Whitney test, as compared to untreated unstimulated fibroblasts or untreated TGFβ-stimulated fibroblasts, respectively. *P < 0.05; **P < 0.01, ***P < 0.001
Fig. 5
Fig. 5
Pharmacological inhibition of JAK2, JNK, c-ABL, and SRC reduces levels of P-STAT3 in bleomycin-challenged mice. ac a Representative images with b quantification of immunofluorescence stainings and c western blot analyses with quantification of P-STAT3 in the skin of bleomycin-challenged mice treated with the JAK2 inhibitor TG101209, the JNK inhibitor CC-930, c-ABL inhibitor imatinib mesylate, or the SRC inhibitor SU6656. Control mice injected with NaCl and bleomycin-challenged receiving vehicle treatment served as controls. N ≥ 4 mice and 3 technical replicates per group for all experiments. Expected band size for P-STAT3 and STAT3 are 79 kDa (lower faint band) and 86 kDa (higher intense band) and the ladder represents 100 kDa. Beta-actin (expected molecular weight/size 42 kDa) is shown by ladder at 40 kDa. Magnifications of 200-fold and 1000-fold are shown for all immunofluorescence stainings. Horizontal scale bar, 100 μm. Results are shown as median ± interquartile range (IQR). Significance was determined by Mann–Whitney test, as compared to sham-treated or bleomycin-challenged mice, respectively. *P < 0.05; **P < 0.01, ***P < 0.001
Fig. 6
Fig. 6
Inactivation of STAT3 inhibits TGFβ-induced myofibroblast differentiation and collagen release. af Effect of the STAT3 inhibitor S3I-201 on the mRNA levels of a CTGF, b ACTA2, c COL1A1, d COL1A2, and e collagen protein (n = 4–7 and 2 technical replicates for all experiments) in human dermal fibroblasts. f Representative images of immunofluorescence staining for stress fibers at 200-fold magnification. Horizontal scale bar, 100 μm. gl Responsiveness of AAV-Cre virus-infected mouse fibroblasts from STAT3 fl/fl mice to TGFβ stimulation, as compared to AAV-LacZ virus-infected fibroblasts, which served as control: g Representative images of immunofluorescence staining for stress fibers at 200-fold magnification. Horizontal scale bar, 100 μm. mRNA levels of h Ctgf, i Acta2, j Col1a1, k Col1a2, and l collagen protein (n = 6 with 2 technical replicates for all experiments). Results are shown as median ± interquartile range (IQR). Significance was determined by Mann–Whitney test, as compared to the unstimulated control fibroblasts or TGFβ-stimulated control fibroblasts, respectively. *P < 0.05; **P < 0.01, ***P < 0.001. AAV adeno-associated virus
Fig. 7
Fig. 7
Fibroblast-specific knockout of STAT3 reduced the effects of TBRact-induced skin fibrosis. a Representative histological sections stained with hematoxylin and eosin (top) and trichrome (bottom). b Dermal thickness, ce mRNA levels of Acta2, Col1a1, and Col1a2, respectively, f hydroxyproline content, g myofibroblast count, and hk levels of h Ctgf mRNA, i Pai-1 mRNA and of the proposed biomarkers, j Thbs1 mRNA and k Comp mRNA. m, n Representative immmunofluorescence stainings of P-STAT3 (left) and total STAT3 (right) at 200-fold and 1000-fold magnification, respectively, along with their l quantitative analyses. All experiments were performed in dermal tissue sections from the experimental mouse model of TBRact-induced skin fibrosis in mice with fibroblast-specific, tamoxifen-inducible, Cre-loxP-based (Col1a2-Cre-ER) knockout of STAT3 in STAT3 fl/fl mice and control littermates (C57Bl/6background, 12 weeks of age). N ≥ 6 with 2 technical replicates per group for all experiments. Results are shown as median ± interquartile range (IQR). Horizontal scale bar, 100 μm. Significance was determined by Mann–Whitney test, as compared to vehicle-treated, fibrotic mice, respectively. *P < 0.05; **P < 0.01***; P < 0.001. Tam tamoxifen; CO, Corn-oil
Fig. 8
Fig. 8
Fibroblast-specific knockout of STAT3 ameliorates bleomycin-induced skin fibrosis. a Representative histological sections stained with hematoxylin and eosin (top) and trichrome (bottom). b Dermal thickness, ce mRNA levels of Acta2, Col1a1, and Col1a2, respectively, f hydroxyproline content, g myofibroblast count, and hk levels of h Ctgf mRNA, i Pai-1 mRNA and of the proposed biomarkers, j Thbs1 mRNA, and k Comp mRNA. m, n Representative immmunofluorescence stainings of P-STAT3 (left) and total STAT3 (right) at 200-fold and 1000-fold magnification, respectively, along with their l quantitative analyses. All experiments were performed in the skin tissue sections from the experimental mouse model of bleomycin-induced skin fibrosis in mice with fibroblast-specific, tamoxifen-inducible, Cre-loxP-based (Col1a2-Cre-ER) knockout of STAT3 in STAT3 fl/fl mice and control littermates (C57Bl/6background, 12 weeks of age). N ≥ 6 mice with 2 technical replicates per group for all experiments. Results are shown as median ± interquartile range (IQR). Horizontal scale bar, 100 μm. Significance was determined by Mann–Whitney test, as compared to vehicle-treated, fibrotic mice, respectively. *P < 0.05; **P < 0.01***; P < 0.001. Tam tamoxifen, CO Corn-oil
Fig. 9
Fig. 9
Pharmacological inhibition of STAT3 induces the regression of TBRact-induced experimental skin fibrosis. ao Treatment of TBRact-induced skin fibrosis with the STAT3 inhibitor S3I-201 in mice (DBA/2 background, 12 weeks of age). a Representative histological sections stained with hematoxylin and eosin (top) and trichrome (bottom). b Dermal thickness, c western blot analysis of P-STAT3, shown by the ladder representing 100 kDa (expected intense upper band size, 86 kDa and lower faint band size, 79 kDa). Beta-actin (expected molecular weight/size, 42 kDa) is shown by ladder at 40 kDa. df mRNA levels of d Acta2, e Col1a1, and f Col1a2, g hydroxyproline content, h myofibroblast counts and levels of i Ctgf mRNA, j Pai-1 mRNA and of the proposed biomarkers, k Thbs1 mRNA, and l Comp mRNA. mo Immunofluorescence analysis including n, o representative immunofluorescence stainings of P-STAT3 (left) and total STAT3 (right) at 200-fold and 1000-fold magnification, respectively, along with their m quantitative analyses. N ≥ 6 mice with 2 technical replicates per group for all experiments. Results are shown as median ± interquartile range (IQR). Horizontal scale bar, 100 μm. Significance was determined by Mann–Whitney test, as compared to vehicle-treated, fibrotic mice, respectively. *P < 0.05; **P < 0.01***; P < 0.001
Fig. 10
Fig. 10
Pharmacological inhibition of STAT3 exerts potent anti-fibrotic effects in bleomycin-induced experimental skin fibrosis model. ao Treatment of bleomycin-induced skin fibrosis with the STAT3 inhibitor S3I-201 in mice (DBA/2 background, 12 weeks of age). a Representative histological sections stained with hematoxylin and eosin (top) and trichrome (bottom). b Dermal thickness, c western blot analysis of P-STAT3, shown by the ladder representing 100 kDa (expected intense upper band size, 86 kDa and lower faint band size, 79 kDa). Beta-actin (expected molecular weight/size, 42 kDa) is shown by ladder at 40 kDa. df mRNA levels of d Acta2, e Col1a1, and f Col1a2, g hydroxyproline content, h myofibroblast counts and levels of i Ctgf mRNA, j Pai-1 mRNA and of the proposed biomarkers, k Thbs1 mRNA, and l Comp mRNA. mo Immunofluorescence analysis including n, o representative immmunofluorescence stainings of P-STAT3 (left) and total STAT3 (right) at 200-fold and 1000-fold magnification, respectively, along with their m quantitative analyses. N ≥ 6 mice with 2 technical replicates per group for all experiments. Results are shown as median ± interquartile range (IQR). Horizontal scale bar, 100 μm. Significance was determined by Mann–Whitney test, as compared to vehicle-treated, fibrotic mice, respectively. *P < 0.05; **P < 0.01***; P < 0.001

Comment in

References

    1. Wynn T. Cellular and molecular mechanisms of fibrosis. J. Pathol. 2008;214:199–210. - PMC - PubMed
    1. Gabrielli A, Avvedimento EV, Krieg T. Scleroderma. N. Engl. J. Med. 2009;360:1989–2003. - PubMed
    1. Varga J, Abraham D. Systemic sclerosis: a prototypic multisystem fibrotic disorder. J. Clin. Invest. 2007;117:557. - PMC - PubMed
    1. Massagué J. TGFβ signalling in context. Nat. Rev. Mol. Cell Biol. 2012;13:616–630. - PMC - PubMed
    1. Verrecchia F, Mauviel A. Transforming growth factor-β and fibrosis. World J. Gastroenterol. 2007;13:3056. - PMC - PubMed

Publication types

MeSH terms