. 2017 Oct 24;7(1):13945.
doi: 10.1038/s41598-017-14253-8.

Cardamonin inhibits colonic neoplasia through modulation of MicroRNA expression

Affiliations

Cardamonin inhibits colonic neoplasia through modulation of MicroRNA expression

Shirley James et al. Sci Rep. .

Abstract

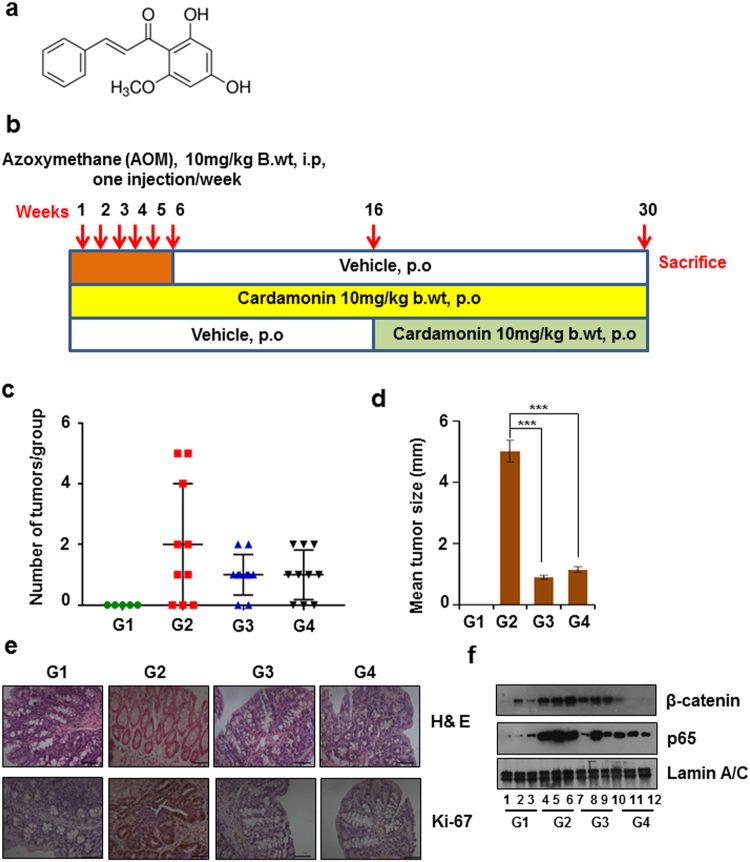
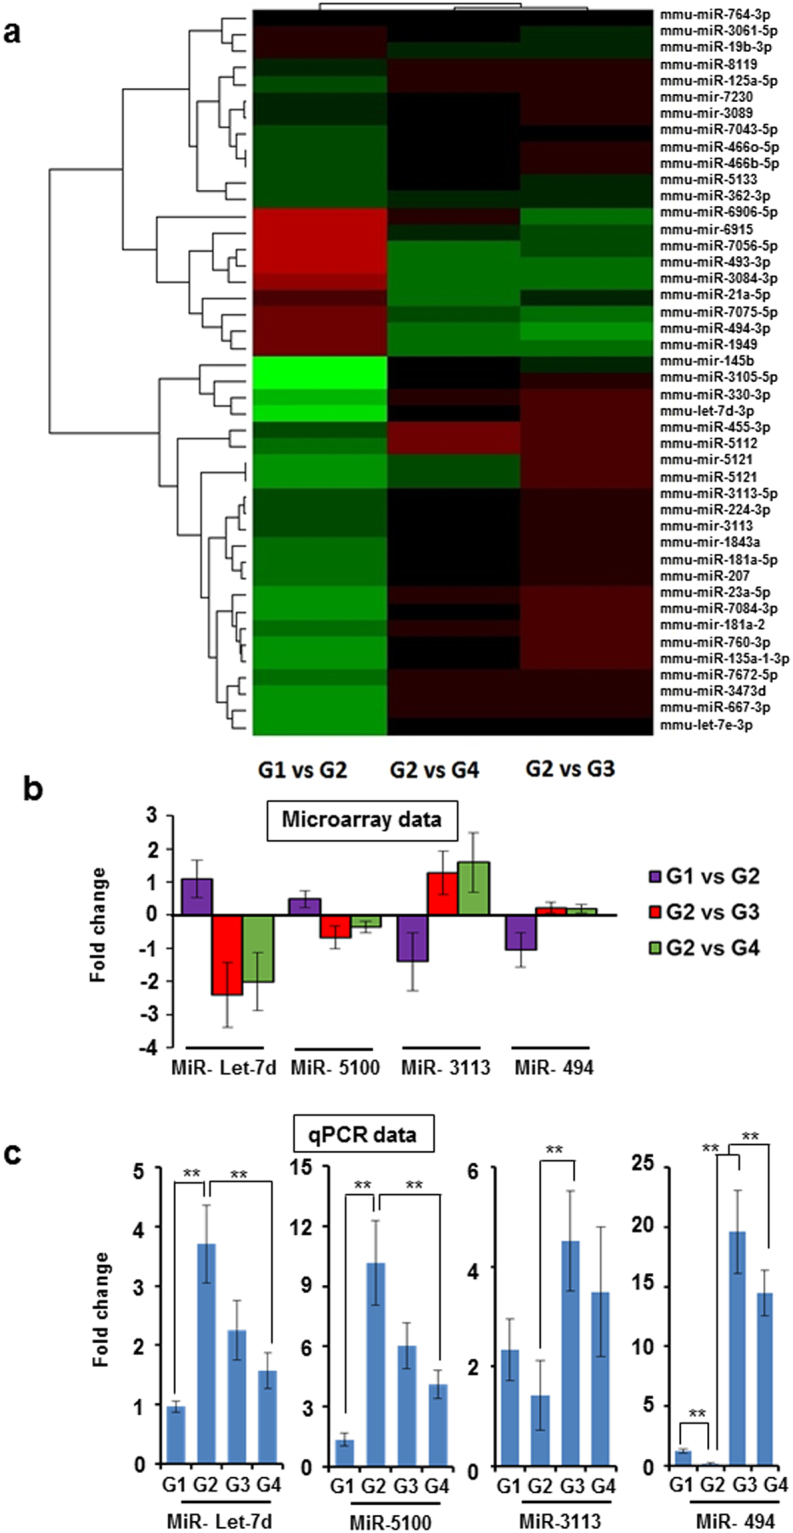
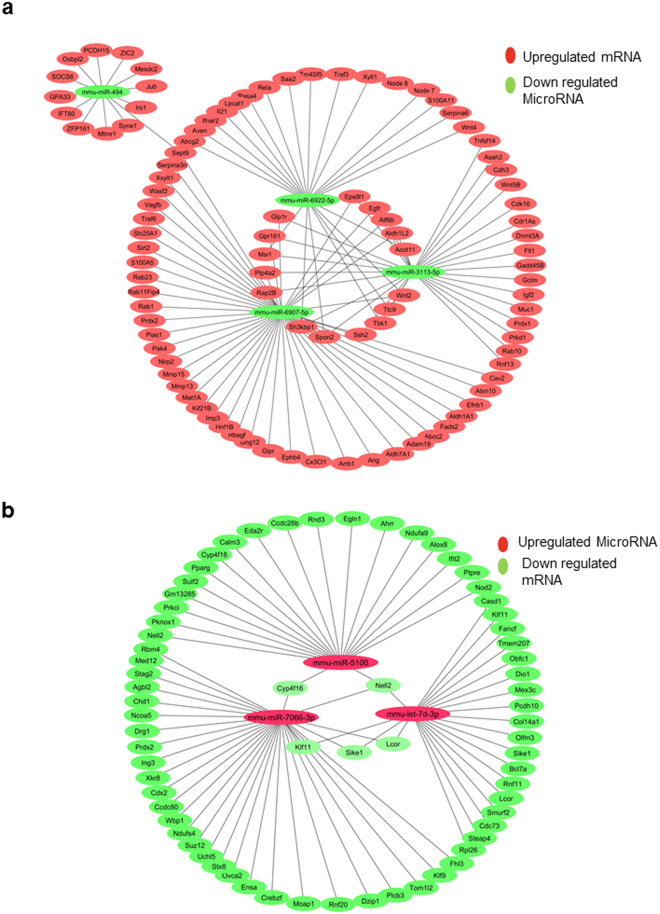
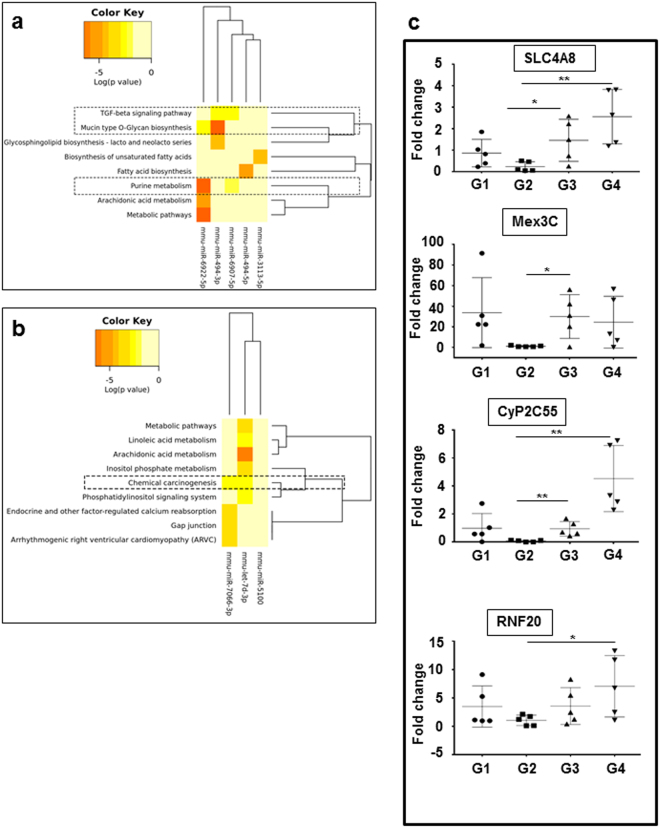
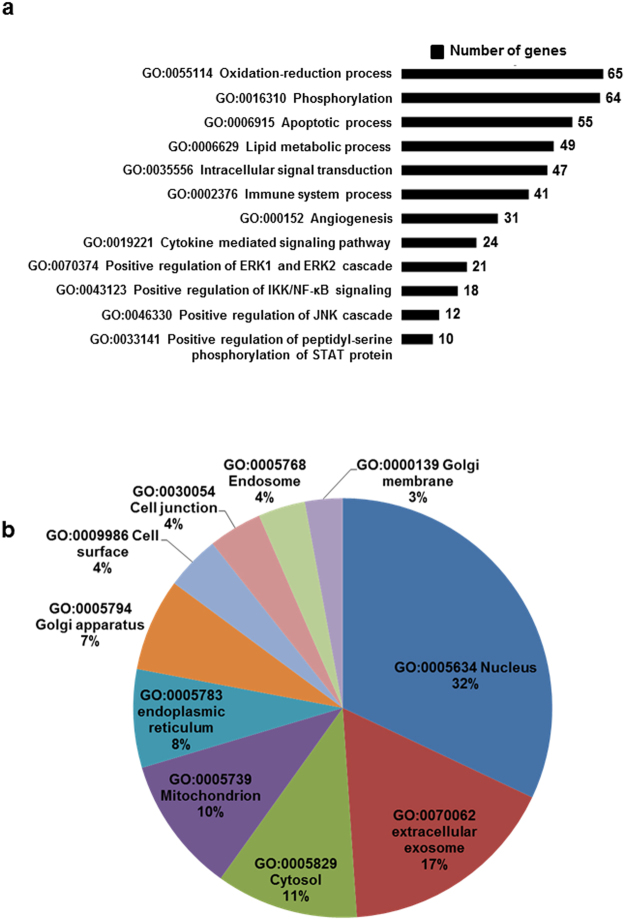
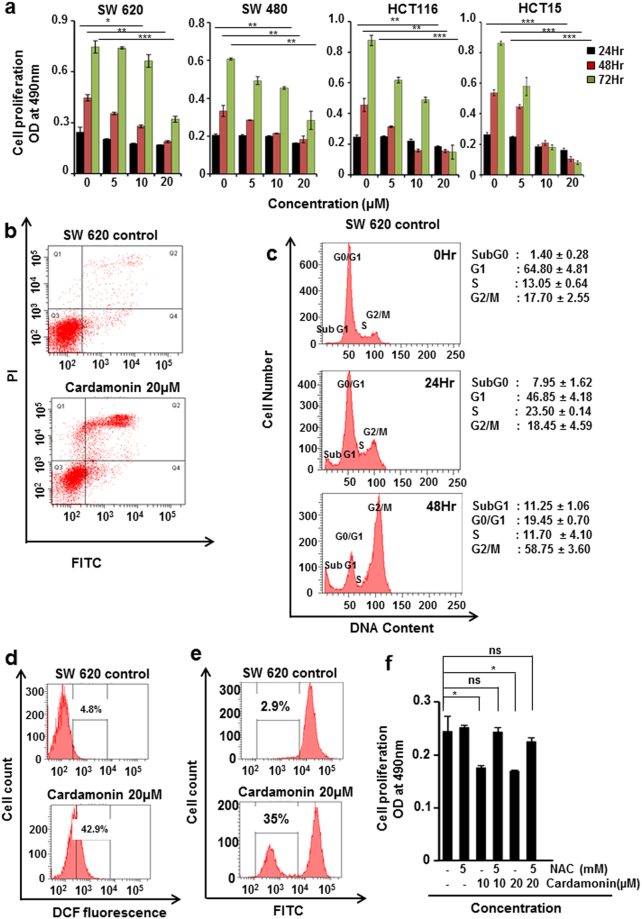
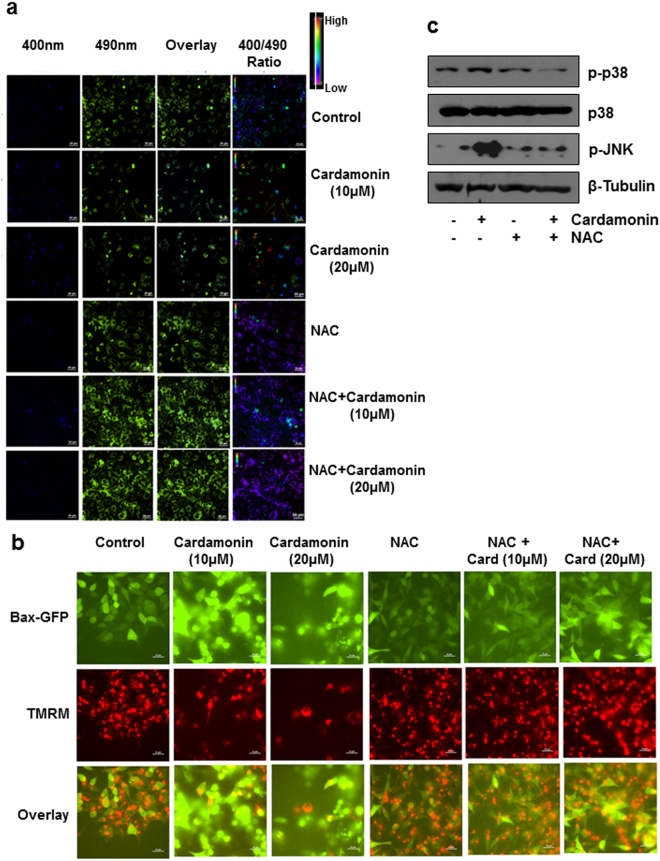
Colorectal cancer is currently the third leading cause of cancer related deaths. There is considerable interest in using dietary intervention strategies to prevent chronic diseases including cancer. Cardamonin is a spice derived nutraceutical and herein, for the first time we evaluated the therapeutic benefits of cardamonin in Azoxymethane (AOM) induced mouse model of colorectal cancer. Mice were divided into 4 groups of which three groups were given six weekly injections of AOM. One group served as untreated control and remaining groups were treated with either vehicle or Cardamonin starting from the same day or 16 weeks after the first AOM injection. Cardamonin treatment inhibited the tumor incidence, tumor multiplicity, Ki-67 and β-catenin positive cells. The activation of NF-kB signaling was also abrogated after cardamonin treatment. To elucidate the mechanism of action a global microRNA profiling of colon samples was performed. Computational analysis revealed that there is a differential expression of miRNAs between these groups. Subsequently, we extend our findings to human colorectal cancer and found that cardamonin inhibited the growth, induces cell cycle arrest and apoptosis in human colorectal cancer cell lines. Taken together, our study provides a better understanding of chemopreventive potential of cardamonin in colorectal cancer.


Conflict of interest statement

The authors declare that they have no competing interests.

Figures

Figure 1
Figure 1
Cardamonin inhibited AOM induced colorectal cancer: (a) Chemical structure of cardamonin; (b) Schematic representation of experimental design; (c) Number of tumors in colon/ group; (d) Mean tumor size between groups expressed as mean ± SEM. The statistical analysis was done using one way ANOVA followed by Tukey HSD posthoc test; ***p < 0.001; (e) Tissue sections were prepared from formalin fixed paraffin embedded samples. Hematoxylin-eosin staining (upper panel) and Ki-67 index (lower panel) of colonic tissue samples, representative images, 40X magnification; (f) Nuclear fractions were prepared from all the 4 groups (n = 3) and western blot analysis was performed for β-catenin (upper panel) and p65 (lower panel). Lamin A/C was used as the loading control.
Figure 2
Figure 2
MicroRNA expression were altered after AOM and cardamonin treatment: Group 1 (normal control) was compared with Group 2 (vehicle control) and group 2 was further compared with group 3 and 4 (Cardamonin treated groups) (a) The number of miRNA expressed between the groups; (b) Venn diagram comparing the expression between groups; (c) scatter plot showing miRNA expression intensity values (log scale).
Figure 3
Figure 3
MicroRNA expression were altered in colorectal cancer: (a) Heat map plot showing the differentially expressed miRNAs with highest standard deviation (p ≤ 0.10); (b) Log fold change values obtained after microarray analysis for selected miRNAs between groups; (c) The validation data of selected miRNAs in all the four groups. The total RNA was isolated from each sample and expression of each miRNA was analyzed using specific Taqman probe. The sno202 was served as internal control. The data is expressed in fold values and expressed mean ± SD, statistical analysis was done using student’s t test; **p < 0.01.
Figure 4
Figure 4
The microRNA-gene interaction network in CRC: The network was visualized using cytoscape for the table of miRNA and mRNA target interaction and displayed as circular architecture: (a) with top 4 upregulated miRNAS (green in color) with p ≤ 0.05 and targeting downregulated mRNA red in color) (b) with top 3 downregulated miRNAs (red in color) with p ≤ 0.05 and targeting upregulated mRNA (green in color).
Figure 5
Figure 5
The correlation between microRNA expression and enriched functional pathways: Dendrogram plot showing down regulated miRNAs (a) and upregulated (b) versus significantly enriched functional pathways. In both figures darker colors represent statistical significance as indicated in the color key. Pathways within dotted box are the functionally relevant pathway clusters regulated by more than one miRNA. (c) The validation data of selected genes using RT-PCR. Statistical analysis was done using student’s t test; *p < 0.05, **p < 0.01.
Figure 6
Figure 6
Functional annotation of genes using the Database for Annotation, Visualization and Integrated Discovery (DAVID) enrichment analysis: (a) The nodes represent the GO_BP terms in the enrichment analysis. The size of a node represents the number of genes associated with each pathway (b) Pie chart showing the expression of organelle specific expression of each gene.
Figure 7
Figure 7
Cardamonin inhibited the growth CRC cell lines in vitro (a) SW620, HCT15, SW480 and HCT116 cells were treated with the indicated concentrations of cardamonin for 24, 48 and 72 hours. Cell viability was accessed using MTT assay, student’s t test *p < 0.05, **p < 0.01, ***p < 0.001 compared to control, OD: optical density. (b–f) SW620 cells were treated with 20 µM of cardamonin for different time points. (b) After 24 hours cells were stained with Annexin V5-FITC and PI and then analyzed by FACS (c) After 24 and 48 hours cells were stained with PI and cell cycle analysis done by FACS (d); Cells were stained with DCFDA and ROS generation was analyzed by FACS (e) after 24hrs the loss in mitochondrial membrane potential was quantified using DiCO6(3) staining. The experiments were repeated at least 3 times and data was expressed as mean ± S.D (f) Cells were pretreated with or without NAC (5 mM) for 2hr followed by treatment with or without cardamonin at indicated doses for 24 hr. Cell viability was accessed using MTT assay, student’s t test; *p < 0.05, ns- not significant p > 0.05 compared to control.
Figure 8
Figure 8
Cardamonin induced apoptosis in a ROS dependent manner (a): HCT116 cells stably expressing a ratio metric redox sensing probe Mito RO-GFP was pretreated with NAC (5 mM) for 2 hr in presence and absence of Cardamonin. The ratio of emission after excitation at 400 nm to 490 nm (400/490) was calculated. Representative images were shown in X; (b) HCT116 Bax−/− stably expressing EGFP were pretreated with NAC (5 mM) for 2 hr in presence and absence of Cardamonin for 48 hr and cells were stained with 100 nM of TMRM. Loss of mitochondrial potential is reflected as loss of red fluorescence and Bax punctae reflects its mitochondrial translocation after activation.

References

    1. Torre LA, et al. Global cancer statistics, 2012. CA: a cancer journal for clinicians. 2015;65:87–108. - PubMed
    1. Arnold, M. et al. Global patterns and trends in colorectal cancer incidence and mortality. Gut, doi:10.1136/gutjnl-2015-310912 (2016). - PubMed
    1. Paulmurugan R. MicroRNAs - a new generation molecular targets for treating cellular diseases. Theranostics. 2013;3:927–929. doi: 10.7150/thno.8113. - DOI - PMC - PubMed
    1. Xuan Y, et al. MicroRNAs in colorectal cancer: small molecules with big functions. Cancer letters. 2015;360:89–105. doi: 10.1016/j.canlet.2014.11.051. - DOI - PubMed
    1. Michael MZ, SM OC, van Holst Pellekaan NG, Young GP, James RJ. Reduced accumulation of specific microRNAs in colorectal neoplasia. Molecular cancer research: MCR. 2003;1:882–891. - PubMed

Publication types

MeSH terms