. 2017 Oct 24;7(1):13894.
doi: 10.1038/s41598-017-14341-9.

Aberrant glioblastoma neovascularization patterns and their correlation with DCE-MRI-derived parameters following temozolomide and bevacizumab treatment

Affiliations

Aberrant glioblastoma neovascularization patterns and their correlation with DCE-MRI-derived parameters following temozolomide and bevacizumab treatment

Wei Xue et al. Sci Rep. .

Abstract

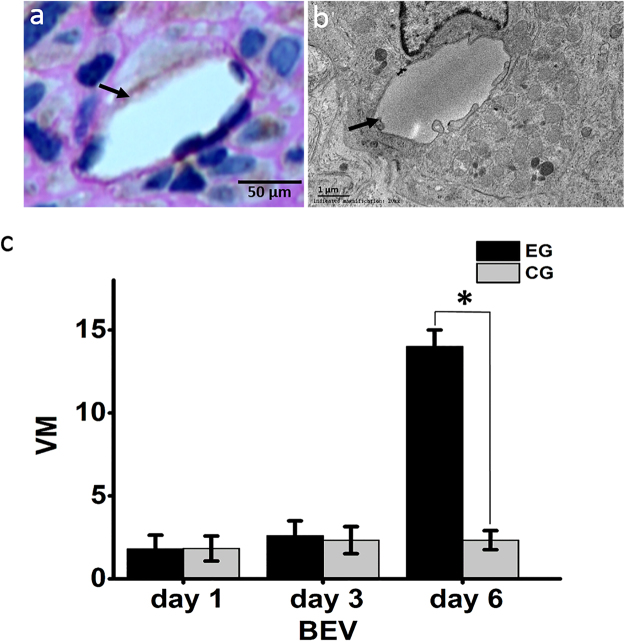
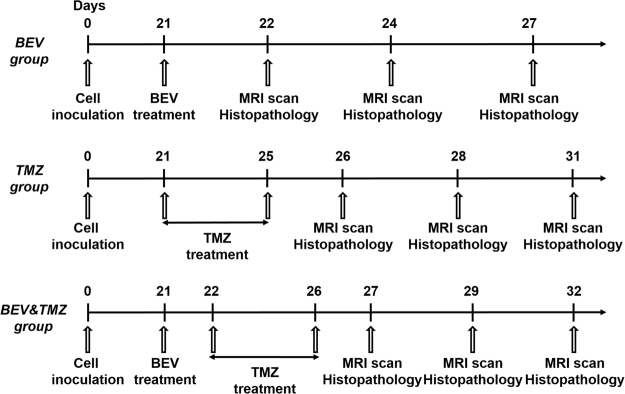
Glioblastoma (GBM) is a highly angiogenic malignancy, and its abundant, aberrant neovascularization is closely related to the proliferation and invasion of tumor cells. However, anti-angiogenesis combined with standard radio-/chemo-therapy produces little improvement in treatment outcomes. Determining the reason for treatment failure is pivotal for GBM treatment. Here, histopathological analysis and dynamic contrast-enhanced MRI (DCE-MRI) were used to explore the effects of temozolomide (TMZ) and bevacizumab (BEV) on GBM neovascularization patterns in an orthotopic U87MG mouse model at 1, 3 and 6 days after treatment. We found that the amount of vascular mimicry (VM) significantly increased 6 days after BEV treatment. TMZ inhibited neovascularization at an early stage, but the microvessel density (MVD) and transfer coefficient (Ktrans) derived from DCE-MRI increased 6 days after treatment. TMZ and BEV combination therapy slightly prolonged the inhibitory effect on tumor microvessels. Sprouting angiogenesis was positively correlated with Ktrans in all treatment groups. The increase in VM after BEV administration and the increase in MVD and Ktrans after TMZ administration may be responsible for treatment resistance. Ktrans holds great potential as an imaging biomarker for indicating the variation in sprouting angiogenesis during drug treatment for GBM.


Conflict of interest statement

The authors declare that they have no competing interests.

Figures

Figure 1
Figure 1
MRI and corresponding histopathological features of the orthotopic U87MG glioblastoma model. HE staining (a) and a T2-weighted image (d) show a quasi-circular mass in the right cerebral hemisphere with mild edema around the tumor mass. The Ktrans map (b) of the tumor is shown. Bright points in the tumor area represent high permeability, especially in the tumor margin, which also showed more abundant neovascularization (c). All images were selected from the maximum cross-section of the tumor.
Figure 2
Figure 2
The variation in neovascularization patterns after BEV administration. The histopathological images show the variation in MVD, sprouting angiogenesis, co-option and IMG at 6 days after BEV administration. Upper row, experimental group (EG), middle row, corresponding control group (CG). The lower bar graphs show the variation in corresponding neovascularization patterns after BEV administration at three time points. (a,e) CD34-positive tumor microvessel. (b,f) Tenascin-C-positive stalk representing vascular sprouting. (c,g) Tumor cells surrounding CD34-positive tubes represent vascular co-option. (d,h) CD34-positive folds across the lumens represent intussusceptive microvascular growth (red arrow). Data were represented as the means ± SD. *Indicates P < 0.05.
Figure 3
Figure 3
Vascular mimicry. (a) Vascular mimicry was characterized by PAS-positive and CD34-negative lumen-like structures (black arrow). (b) Transmission electron microscopy shows tumor cells lining a vascular channel (black arrow). (c) The amount of vascular mimicry (VM) was significantly increased 6 days after BEV administration, experimental group (EG), control group (CG). Data were represented as the means ± SD. *Indicates P < 0.05.
Figure 4
Figure 4
The variation in neovascularization patterns after TMZ administration. The histopathological images show the variation in MVD, sprouting angiogenesis, co-option and IMG at 6 days after TMZ administration. Upper row, experimental group (EG), middle row, corresponding control group (CG). The lower bar graphs show the variation in corresponding neovascularization patterns after TMZ administration at three time points. Data were represented as the means ± SD. *Indicates P < 0.05.
Figure 5
Figure 5
The variation in neovascularization patterns after a combination of BEV and TMZ administration. The histopathological images show the variation in MVD, sprouting angiogenesis, co-option and IMG at 3 days after BEV and TMZ administration. Upper row, experimental group (EG), middle row, corresponding control group (CG). The lower bar graphs show the variation in corresponding neovascularization patterns after the combination administration at three time points. Data were represented as the means ± SD. *Indicates P < 0.05.
Figure 6
Figure 6
The variation in Ktrans after treatment. (a) T2-weighted images (T2WI, left column) and corresponding Ktrans maps (right column) of GBM-bearing mice at 6 days after various treatments. Upper row, experimental group (EG); lower row, control group (CG). (b) Ktrans values at different time points in three treatment groups. Data were represented as the means ± SD. *Indicates P < 0.05.
Figure 7
Figure 7
The amount of sprouting angiogenesis was positively correlated with Ktrans value in experimental groups after three kinds of treatments.
Figure 8
Figure 8
Drug treatment protocols and checkpoints.

References

    1. Nano R, et al. New frontiers for astrocytic tumours. Anticancer Res. 2012;32:2755–2758. - PubMed
    1. Stupp R, et al. Radiotherapy plus concomitant and adjuvant temozolomide for glioblastoma. N Engl J Med. 2005;352:987–996. doi: 10.1056/NEJMoa043330. - DOI - PubMed
    1. Wen PY, Kesari S. Malignant gliomas in adults. N Engl J Med. 2008;359:492–507. doi: 10.1056/NEJMra0708126. - DOI - PubMed
    1. Soda Y, Myskiw C, Rommel A, Verma IM. Mechanisms of neovascularization and resistance to anti-angiogenic therapies in glioblastoma multiforme. J Mol Med (Berl) 2013;91:439–448. doi: 10.1007/s00109-013-1019-z. - DOI - PMC - PubMed
    1. Chen X, et al. A new mosaic pattern in glioma vascularization: exogenous endothelial progenitor cells integrating into the vessels containing tumor-derived endothelial cells. Oncotarget. 2014;5:1955–1968. doi: 10.18632/oncotarget.1885. - DOI - PMC - PubMed

Publication types